In recent decades, increasing research efforts have been focused on direct ethanol fuel cells (DEFCs) as ethanol can be obtained from various sources with a high theoretical energy density of 6.28kWh L–1 (Kamarudin et al., Reference Kamarudin, Kamarudin, Masdar and Daud2013). In addition to the advantage of high energy density as a fuel, ethanol also has many other merits, such as being non-toxic and environmentally friendly, having a large molecular structure and possessing low Nafion™ membrane permeability (Chu & Shul, Reference Chu and Shul2012). Platinum (Pt) is an oft-used catalyst for the electrocatalytic oxidation of ethanol (EOR) as reported in previous work: Lai & Koper (Reference Lai and Koper2008) studied the electrocatalytic oxidation of acetaldehyde and ethanol on single-crystal Pt with various crystal planes and illustrated the detailed reaction mechanism of ethanol electrocatalytic oxidation. However, the application of Pt in DEFCs in the industrial field is hindered by its high price, low reserves and poor long-term stability due to the toxicity of its intermediates (Ma et al., Reference Ma, Chu and Chen2012).
Studies have shown that palladium (Pd) is an excellent substitute for Pt, having similar catalytic activity and stability (Peng et al., Reference Peng, Ren, Wang, Xiong, Wang and Li2021). Compared with that of the Pd metal, the Pt surface is more likely to be covered by strongly absorbed CO and CHx intermediate products produced during the oxidation of ethanol, resulting in catalyst poisoning (Antolini, Reference Antolini2007). Palladium is much cheaper than Pt, and its reserves on Earth are also very abundant, which is beneficial for commercial applications. Although the catalytic effects of Pd-based catalysts on some small organic molecules are not as good as those of Pt, Pd-based catalysts are expected to replace Pt-based catalysts and become the main catalysts for fuel cells in the future.
According to a previous report, Pd-based materials are not very active in acidic media as Pt-based catalysts for electrochemical ethanol oxidation (Akhairi & Kamarudin, Reference Akhairi and Kamarudin2016). Stoichiometric calculations carried out on EOR activity demonstrated that Pd-based catalysts lacked the necessary OH– required for the oxidative dehydrogenation of ethanol in acidic media (Wen et al., Reference Wen, Li, Cao, Wang, Guo and Zhao2016). With increasing alkalinity, the amount of ⋅OH would increase as a result during the electrocatalytic process (Wang & Xu, Reference Wang and Xu2012). Palladium-based catalysts display great electrocatalytic oxidation activity for small-molecule alcohols (e.g. methanol, ethanol, etc.) in alkaline solutions. This is mainly due to the selective adsorption of OH– on Pd nanoparticles in alkaline solutions (Ding et al., Reference Ding, Han, Gao, Wang, Zhou, Qu and He2020), making it easier to remove the intermediate products that are toxic to the catalyst generated in the reaction process (Pan et al., Reference Pan, Qiu, Peng and Yan2012). For example, positive catalytic effects regarding EOR have been achieved with Pd-based layered double hydroxides in alkaline media (Zhou et al., Reference Zhou, Xie, Xie, Guo, Wang and Wang2019).
Sepiolite is a 2:1 trioctahedral phyllosilicate with the structural formula Mg8Si12O30(OH)4(OH2)4⋅8H2O. It is composed of silicon–oxygen tetrahedra and Mg octahedra, and it has a chain and layer transition structure (Mu et al., Reference Mu, Mu, Yuan, Zhong, Saka, Kim, Holm, Han and Xie2005). There are five types of functional groups on the surface of sepiolite, which usually form the residual charge centre and become the active sites of adsorption (Alver, Reference Alver2018). Sepiolite is a natural nanomineral with honeycomb-shaped internal pores, great surface activity and good adsorption performance. Due to its structure, sepiolite can be used as a catalyst carrier. In addition, large numbers of Si–OH active groups are present on the surface of sepiolite. However, there have been few reports on the applications of sepiolite in electrocatalytic reactions in recent years.
In this research, Pd supported by sepiolite was synthesized using a simple ion-exchange process (Zhang et al., Reference Zhang, Huang, Wang, Liu and Zhao2022), and the product was used as a catalyst for ethanol oxidation for the first time. The research hypothesis is that an excellent electrocatalytic effect might be achieved through the interaction of Pd and the surrounding hydroxyl groups on the structure of sepiolite. The structure–activity relationship of Pd-sepiolite regarding EOR is demonstrated through both physicochemical and electrochemical characterizations.
Experimental
Chemical reagents
Sepiolite and PdCl2 were purchased from Shanghai Macklin Biochemical Technology Co., Ltd (Shanghai, China). DuPont Nafion solution D520 (5%) and acetylene black were procured from Fuel Cell Materials Co., Ltd (Shanghai, China). Potassium hydroxide (KOH), sodium sulfate (Na2SO4), anhydrous ethanol (CH3CH2OH), potassium chloride (KCl), potassium ferricyanide (K3Fe(CN)6) and other chemicals were purchased from Sinopharm Chemical Reagent Co., Ltd (Shanghai, China). The electrolyte was prepared from the aforementioned chemicals of analytical grade and deionized water, which had a resistance >18.2 MΩ cm–1.
Synthesis of Pd-sepiolite
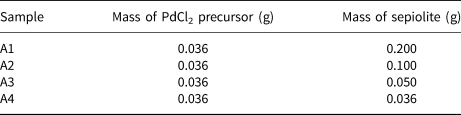
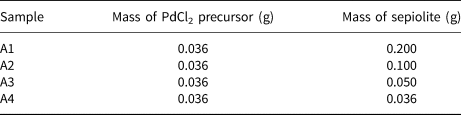
For the synthesis of Pd-sepiolite, 36 mg of PdCl2 was added to a 10 mL beaker with 2 mL of deionized water and then sonicated in an ultrasonic cleaner (model YM-100S3, Shenzhen Fangao Microelectronics Co., Ltd, Beijing, China) until it was dissolved. The catalyst was prepared by mixing sepiolite and PdCl2 solution for 18 h to allow the full exchange of Mg2+ with Pd2+. The slurry was filtered and the residues were dried in a vacuum oven at 60°C (model BPZ-6033, Shanghai No. One Heng Instrument Technology Co., Ltd, Shanghai, China) for 12 h. Finally, the catalyst obtained was ground and sieved at 200 mesh, which was denoted as sample A3 (0.72Pd-sepiolite). Various loadings of Pd could be achieved by changing the dosage of sepiolite to 200, 100 or 36 mg with other parameters remaining fixed, which were denoted sequentially as samples A1 (0.18Pd-sepiolite), A2 (0.36Pd-sepiolite) and A4 (1.00Pd-sepiolite), respectively (Table 1).
Quantity of precursors of Pd-sepiolite prepared via impregnation.
The glassy carbon electrode (GCE) was polished with 1.0 and 0.3 μm Al2O3 powder in sequence to obtain a glossy mirror surface. This was then sonicated in deionized water to remove impurities and dried at room temperature. To prepare the film, 5.0 mg Pd-sepiolite, 2.0 mg acetylene black and 0.1 mL Nafion solution were added to 1.0 mL ethanol and sonicated at 53 kHz for 60 min to obtain a uniform slurry. The working electrode was prepared by coating the glassy carbon with 2 μL of the aforementioned slurry five times and then drying it in a vacuum oven. The prepared working electrode was then activated by electrolysis in 0.5 mol L–1 Na2SO4 solution at –1.2 V (vs saturated calomel electrode; SCE) for 1000 s.
Physicochemical characterization
The crystal structure of the catalysts was characterized using X-ray diffraction (XRD) with a D8 Advance diffractometer (Bruker, Karlsruhe, Germany) with Cu-Kα radiation at a wavelength of 1.5419 Å, 40 mA and 40 kV, at a scanning a rate of 10° min–1, using a step size of 0.02° within the range 5–80°2θ. The catalyst was ground to obtain a particle size <300 mesh, and 50 mg of the sample was used for the XRD test. X-ray photoelectron spectroscopy (XPS) spectra were recorded using an electron spectrometer (ESCALAB Xi+, Thermo Fisher Scientific, Waltham, MA, USA) with a vacuum degree of 8 × l0–10 Pa in the analysis chamber and an Al-Kα ray excitation source (h v = 1486.6 eV). Inductively coupled plasma-optical emission spectrometry (ICP-OES) was used to determine the amount of Pd on the sepiolite (PE Avio 200 spectrometer, PerkinElmer, Waltham, MA, USA). The morphology and structure of the Pd-sepiolite catalysts were analysed using a transmission electron microscope (Talos F200S, Thermo Fisher Scientific) at an accelerating voltage of 200 kV.
Electrochemical performance characterization
The electrocatalytic performance of the as-prepared catalysts was characterized using an electrochemical workstation (CHI660E) in a three-electrode system containing a glass electrolytic cell (diameter 25 mm × height 40 mm), a Pd-sepiolite-coated glassy carbon as the working electrode, a double salt bridge-saturated calomel electrode (saturated KCl type) as the reference electrode and a Pt wire as the counter-electrode. All of the electrochemical devices were purchased from Chenhua Instrument Co., Ltd (Shanghai, China). All experiments except the temperature gradient (15–50°C) tests were carried out at room temperature (15 ± 2°C).
Results and discussion
Structure and composition
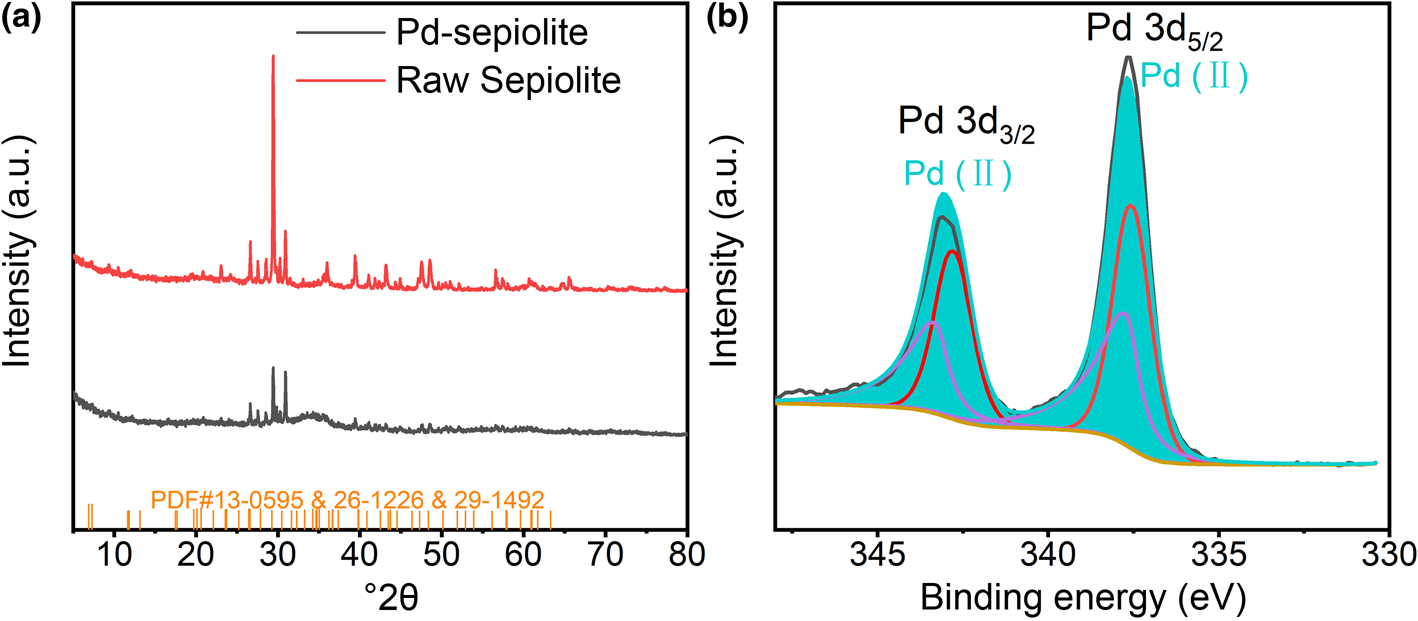
The XRD traces of raw sepiolite and Pd-sepiolite are shown in Fig. 1a. The main diffraction peaks of raw sepiolite and Pd-sepiolite were consistent. The reflections of Pd-sepiolite appeared at ~26.6°, 29.4° and 30.9°, being consistent with the following standard cards: JCPDS no. 13-0595, 26-1226 and 29-1492. All reflections shifted slightly after Pd loading. In the XPS spectra, the peaks centred at 337.5 and 343.0 eV were indexed to Pd 3d5/2 and Pd 3d3/2 states, respectively. Thus, the Pd element mainly existed in the Pd(II) state. After the material was loaded on the GCE, Pd(II) might be reduced to Pd(0) through electrochemical reduction (at –1.2 V vs SCE).
(a) XRD traces of the raw sepiolite and Pd-sepiolite and (b) XPS of the Pd-sepiolite.
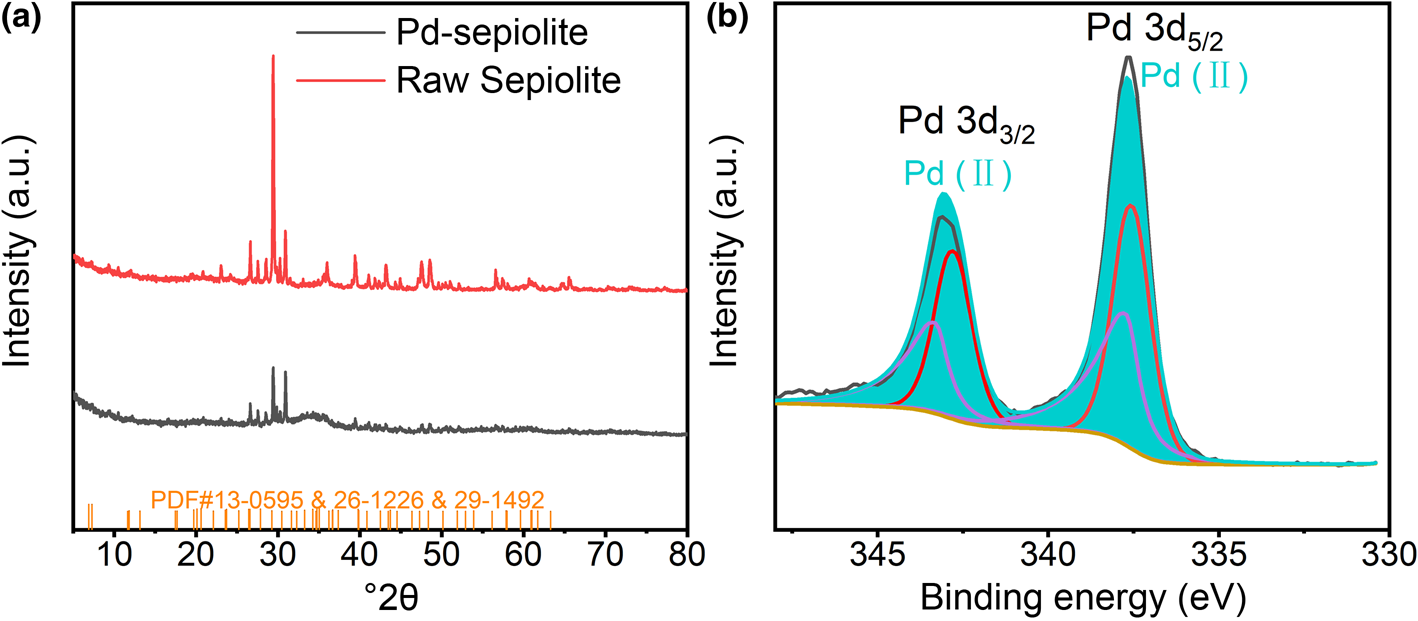
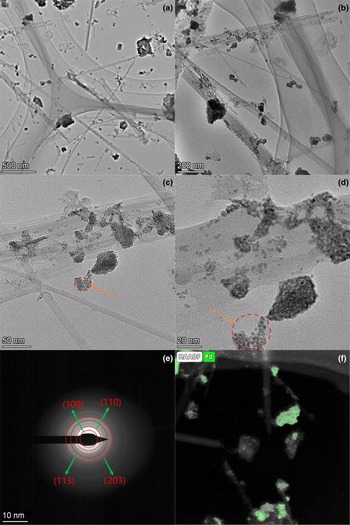
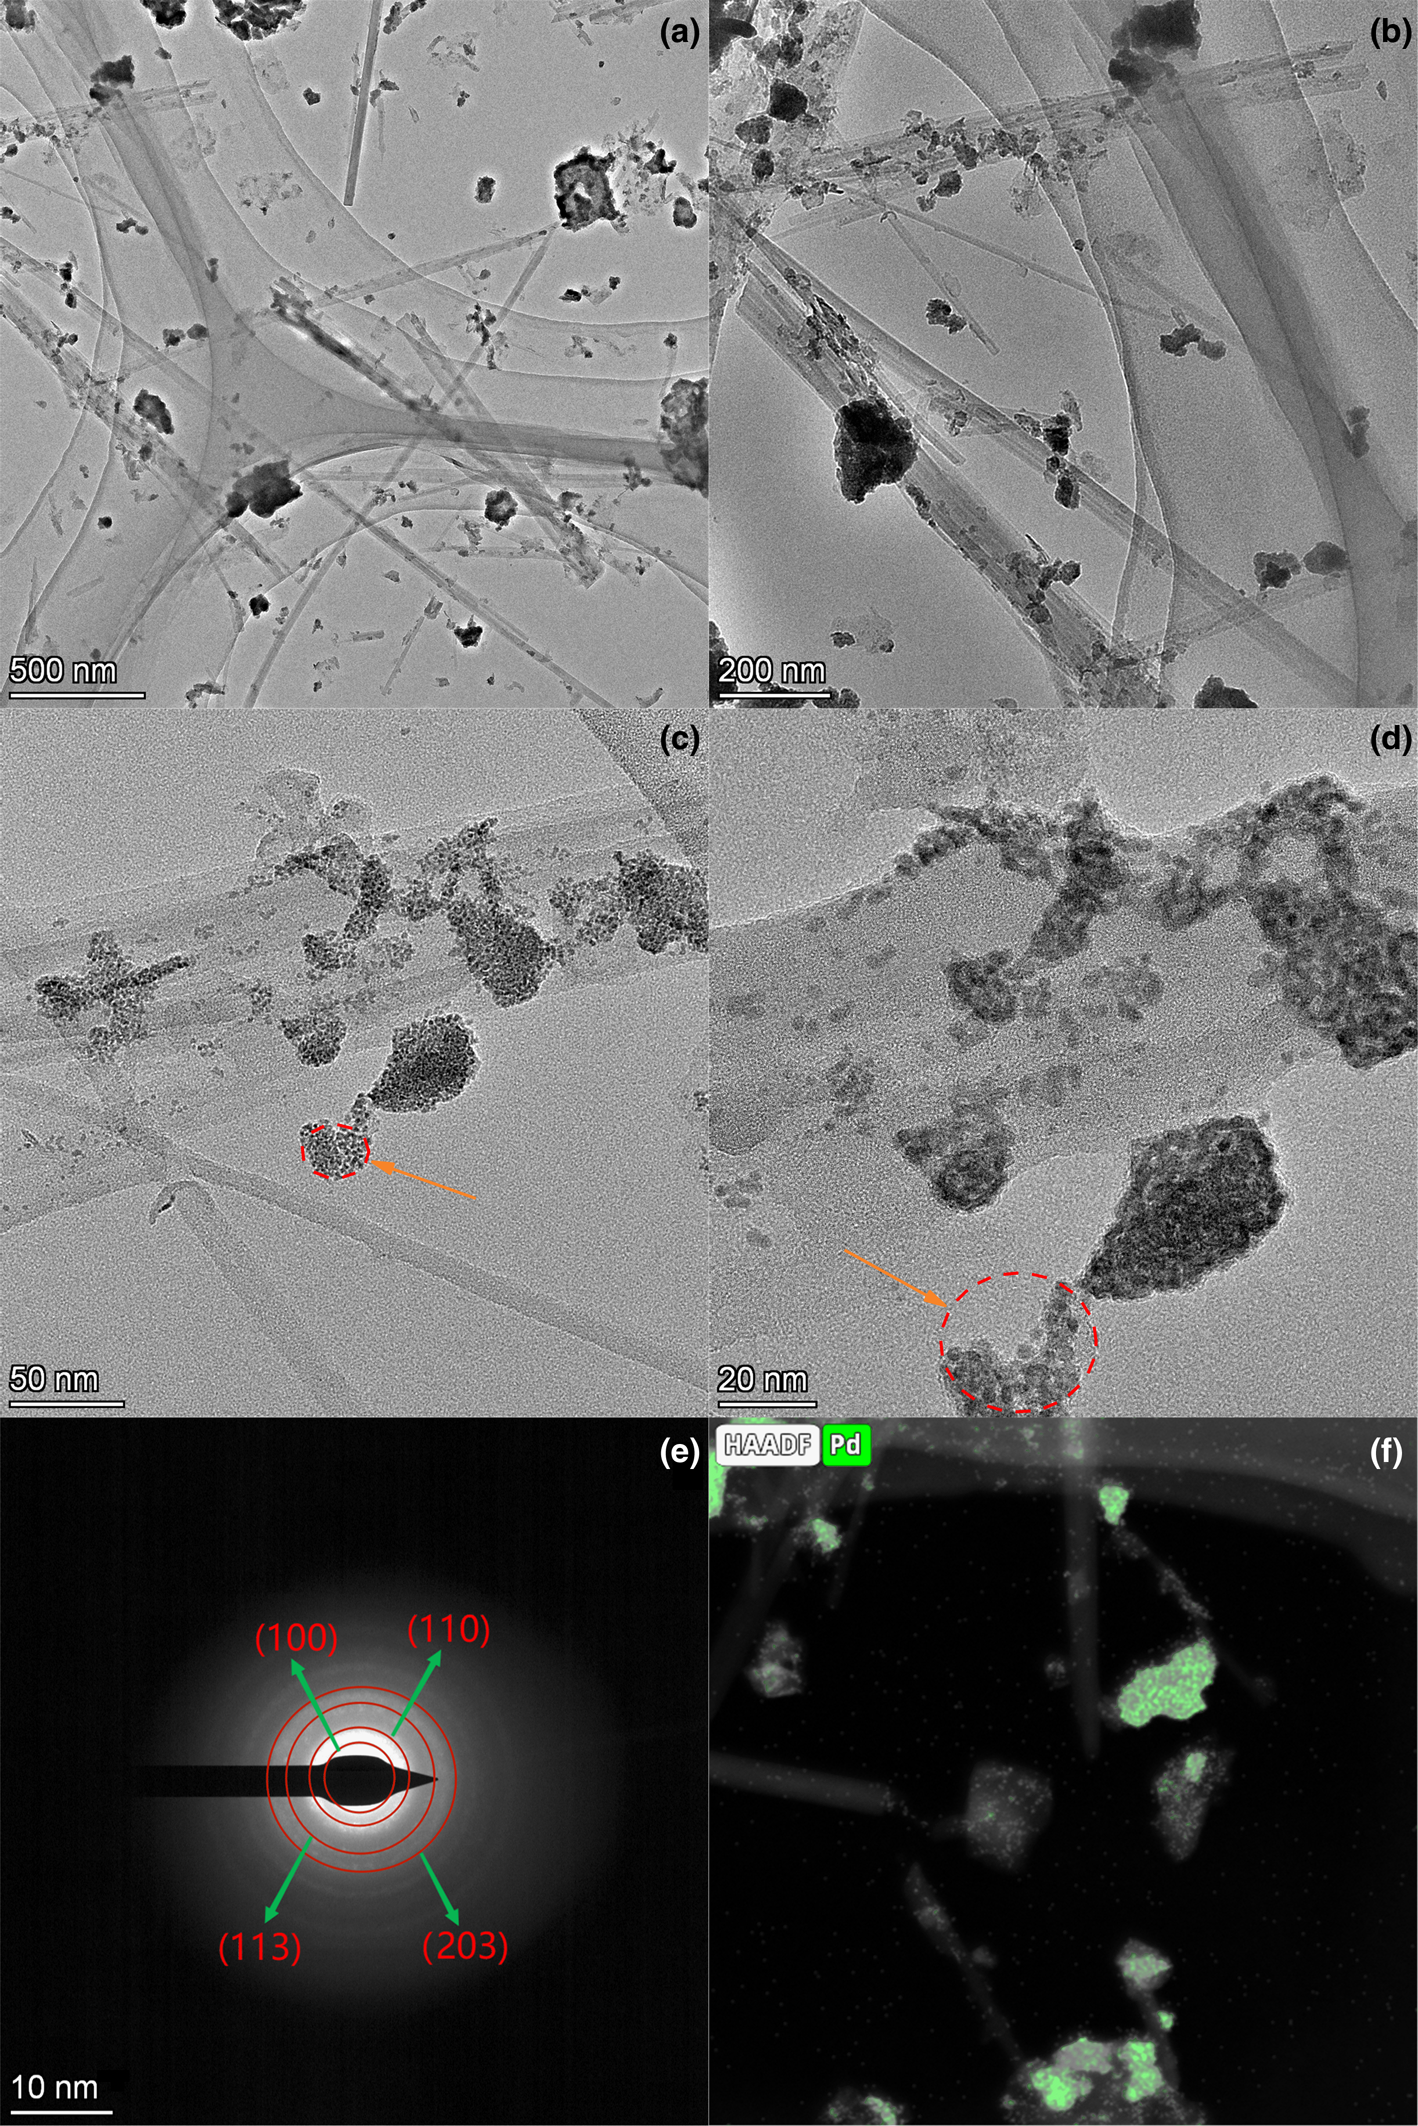
Figure 2a–d presents the morphology of Pd-sepiolite particles. Nanodots are dispersed around the fibrous sepiolite structure. Dark Pd-containing blocks occur on the porous surface of sepiolite, suggesting the aggregation of Pd nanoparticles. The modified sepiolite maintained its crystal structure, with the diffraction rings corresponding to the (100), (110), (113) and (203) planes (Fig. 2e), which provided many surface-active sites of nanometal clusters for electrocatalysis. The elementary distributions of Pd-sepiolite were determined using the high-angle annular dark field technique. The green dots in Fig. 2f show that Pd had various distribution intensities at various positions around the sepiolite. The Pd was distributed evenly around the sepiolite fibre structure, yet it showed greater loading strength on the massive clusters around the fibre.
(a–d) Transmission electron microscope images. The arrows and dashed circles indicate that Pd nanoparticles in the as-prepared catalysts. (e) The corresponding selected area electron diffraction patterns and (f) high-angle annular dark field (HAADF) images of the Pd-sepiolite.
Electrocatalytic activity
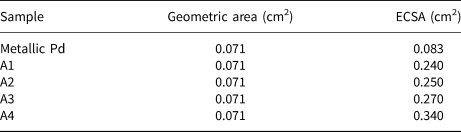
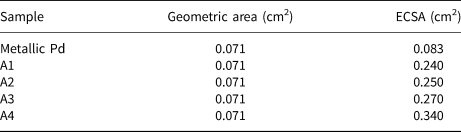
The cyclic voltammetry (CV) curves of the as-prepared catalysts at various scan rates in 0.1 mol L–1 KCl + 1.0 mmol L–1 K3Fe(CN)6 solution are shown in supplementary Figs S2–S6. The electrochemical surface area (ECSA) was calculated from the slope of the plots between the peak current densities and the square root of the scan rates according to the Randles–Sevick method (Equation 1; Li et al., Reference Li, Yang, Li, Huang and Zhao2022b), as is illustrated in Table 2:

where i p, n, F, A, C, v, D, R and T represent the current at the peak potential, the number of electrons transferred, the Faraday constant, the electrochemically active area, the concentration, the scan rate, the diffusion coefficient, the universal gas constant and the temperature, respectively (Li et al., Reference Li, Li, Huang, Zhao, Jin and Yu2022a). For determination of the ECSA, the scanning was repeated >100 times in 0.1 mol L–1 KCl + 1.0 mmol L–1 K3Fe(CN)6 solution until the voltammogram was stable and the target oxidation peak (Fe(II) → Fe(III)) at 0.2–0.4 V could be seen clearly (Fig. S1). The reduction peak at 0–0.2 V was disturbed by other miscellaneous peaks and thus was not suitable for the following analysis. Therefore, for subsequent data processing and calculation, the oxidation peak was chosen. The ECSA of Pd-sepiolite (0.24–0.34 cm2) was significantly greater than that of the metallic Pd disc electrode (0.083 cm2), and this value increased with increasing Pd loading.
ECSA values of the catalysts measured using the Randles–Sevick method.
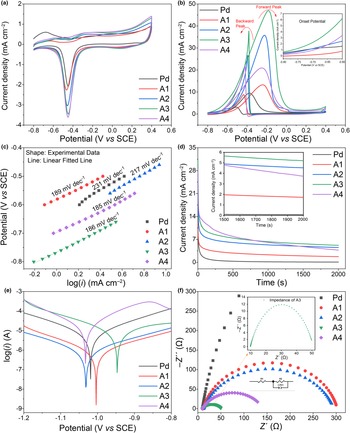
Cyclic voltammograms of samples A1, A2, A3 and A4 and metallic Pd were obtained in 1.0 mol L–1 KOH at a scan rate of 50 mV s–1 (Fig. 3a). A significant reduction peak was observed between –0.4 and –0.5 V, which could be ascribed to the reduction of the Pd(II) species loaded on the sepiolite to Pd0 (Equation 2; Lao et al., Reference Lao, Yang, Chen, Zhang and Guo2021). The oxidation of Pd in the forward scanning process as well as the reduction of Pd(II) in the reverse scanning process are also seen in Fig. 3a. The reduction peak currents followed the order i Pd < i A1 < i A2 < i A3 < i A4, in accordance with the ECSA values. These results indicate that the reduction of Pd(II) was much easier on the surface of sepiolite, which might lead to greater electrochemical activity. In addition, the adsorption and desorption current of hydrogen can be observed at approximately –0.8 V (vs SCE).

The conversion of C2H5OH to CO2 involves a 12-electron transfer reaction, as shown in Equation 3 (Jiang et al., Reference Jiang, Tran, McClure and Chu2014; Zhang et al., Reference Zhang, Ye, Fan, Jiang, Zhu and Li2018). However, an incomplete EOR is often observed on the surface of Pd-based catalysts, as shown in Equation 4 (Lin et al., Reference Lin, Muzzio, Wei, Zhang, Li and Li2019). To analyse quantitatively the catalytic activity of a Pd-based catalyst electrode, two vital parameters – onset potential (E 0) and forward-scanning peak current density (I f) – are used widely, corresponding to thermodynamic and kinetic characteristics, respectively. The peak current density generated by A3-modified GCEs (47.0 mA cm–2 at –0.19 V vs SCE) was 4.9 times greater than that of the single metallic Pd electrode (9.5 mA cm–2 at –0.38 V vs SCE; Fig. 3b). The onset potential of A3-modified GCEs was below –0.80 V (vs SCE), which is much lower than those of the other electrocatalytic materials (approximately –0.76, –0.75, –0.71 and –0.65 V for A2, A4, A1 and single metallic Pd, respectively). In summary, A3 had a lesser onset potential and a greater forward peak current density than A1, A2 and A4, demonstrating that A3 showed greater electrocatalytic oxidation performance for ethanol.


CV curves of the Pd-sepiolite-modified GCEs (A1, A2, A3, A4) and the metallic Pd disc electrode in aqueous (a) 1.0 M KOH solution and (b) 1.0 M KOH + 1.0 M C2H5OH solution at a scan rate of 50 mV s–1. (c) Tafel plots of Pd, A1, A2, A3 and A4 and (d) the corresponding 2000s CA. (e) Tafel corrosion curves of Pd, A1, A2, A3 and A4 and (f) electrochemical impedance spectroscopy curves of Pd, A1, A2, A3 and A4 in 1.0 M KOH + 1.0 M C2H5OH solution.

Prior to EOR, C2H5OH and OH– were absorbed on the active sites of the catalyst surface, which led to the formation of Pd-OHads and Pd-C2H5OHads, as shown in Equations 5 & 6. During forward scanning, Pd-C2H5OHads was gradually oxidized to Pd-CH3COads (Equation 7) through a three-electron reaction in the alkaline environment. Then, Pd-CH3COads reacted with Pd-OHads to form Pd-CH3COOHads, and the active site was exposed again (see Equation 8). Equation 7 is considered the rate-determining step of EOR in most cases (Du et al., Reference Du, Mackenzie, Milano, Deskins, Su and Teng2012; Yuan et al., Reference Yuan, Zhang, Cao, Zhou, Jiang and Chen2019). On the one hand, greater numbers of active sites could lead to a greater peak current during forward scanning (I f), which was affected generally by the amount and distribution of Pd on the carrier. On the other hand, the reverse peak current (I b) of the backward scan was ascribed generally to the oxidative removal of toxic intermediates, which could reach its peak value when all active Pd sites were exposed.




The Tafel slopes gained from each rate-determining step of the CV curves of EOR also represent an important feature of the electrocatalyst (Jin et al., Reference Jin, Xu, Chen, Shang, Wang and Du2019). A lesser Tafel slope indicates a lower reaction barrier, which leads to faster reaction kinetics of the electrocatalytic process (Liu et al., Reference Liu, Huang, Yang, Su and Zhang2021). The slopes of the Tafel curves of Pd-sepiolite (189, 217, 186 and 185 mV dec–1 for A1, A2, A3 and A4, respectively) were less than that of single metal Pd (231 mV dec–1; Fig. 3c), suggesting that the energy barrier of Pd-sepiolite was lower than that of the metallic Pd electrode for electron transfer during EOR. A1 and Pd had considerable anti-poisoning properties. A4 demonstrated the worst anti-poisoning performance due to excessive agglomeration of Pd nanoparticles.
The chronoamperometric experiment is used widely to characterize the stability of electrodes. Figure 3d shows the chronoamperometry (CA) curves of all of the catalysts tested at their peak potentials, respectively. The initial rapid reaction leads to the formation of toxic intermediates that occupy the active sites of catalysts, slowing down the rate of oxidative dehydrogenation of ethanol (Yang et al., Reference Yang, Lao, Sun, Ma, Wang, Ye and Guo2020). The CA curves of A3 and A4 showed a slower current decay rate than the remaining catalysts. After 2000s, A2, A3 and A4 maintained great current densities after reaching a stable state, among which A3 had the greatest terminal current density, indicating the best stability. In contrast, the A1 and metallic Pd electrodes had lesser terminal current densities.
The corrosion resistance or stability of electrode materials under specific conditions can be revealed using Tafel curves under certain conditions. The self-corrosion potential reflects the tendency of metal-containing materials to dissolve in solution. The self-corrosion potentials were –1.02, –1.00, –1.03, –0.95 and –1.03 V(vs SCE) for metallic Pd, A1, A2, A3 and A4 electrodes, respectively, measured in the 1.0 mol L–1 KOH solution (Fig. 3e). The self-corrosion potentials of sepiolite with various Pd loadings all had a slight offset, and the corrosion current decreased with increasing Pd loading. The self-corrosion potential of the A3 sample was the greatest among all of the tested electrodes, indicating that it had the greatest corrosion resistance.
The electron transfer resistance at the electrode interface can be obtained using electrochemical impedance spectroscopy. The electron transfer resistances increased in the following order: A3 < A4 < A2 < A1 < Pd, indicating that the electron transfer of A3 required the least energy, which is in accordance with the results shown in the CV curves (Fig. 3f). In summary, sample A3 is recommended highly for its electrocatalytic performance, which may be explained by the synergistic effect between Pd and sepiolite, leading to an optimized electronic distribution of Pd (Park & McFarland, Reference Park and McFarland2009). Compared with the metallic Pd electrode, the greater specific surface area and unique morphology of sepiolite enabled the good dispersion of Pd, and thus the utilization efficiency of the Pd active sites was optimized, which led to improved catalytic activity. In addition, the synergistic effect between Pd and sepiolite enhanced the electrochemical stability and the ability to resist intermediate poisoning (Peng et al., Reference Peng, Qi, Wu, He, Li and Xie2018).
Kinetic and thermodynamic analyses
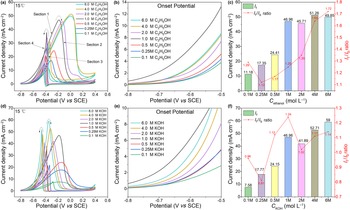
To further explore the catalytic performance of the Pd-sepiolite catalyst regarding EOR, kinetic and thermodynamic studies were performed under various conditions. Figure 4a shows the CVs of A3-modified GCEs in 1.0 mol L–1 KOH with diverse ethanol concentrations ranging from 0.1 to 6.0 mol L–1. The peak current densities increased with increasing ethanol concentration within the range of 0.1–1.0 mol L–1. The concentration gradient between the electrode surface and the bulk solution is lesser in lower-ethanol solutions, the influence of mass transfer is less significant and a greater overpotential is required for a given exchange current. The smaller the exchange current, the slower the reaction kinetics and the greater the reaction activation overpotential under a specific net current. This explains why the onset potential is greater when the ethanol concentration is low. Within a relatively low range (0–1.0 mol L–1), the concentration of ethanol was the control step for EOR. With increasing Pd-C2H5OHads, more Pd-CH3COads could be formed, which accelerated the reaction rate of EOR (Lv et al., Reference Lv, Lopes, Xu and Liu2018). When the concentration of KOH increased from 0.1 to 6.0 mol L–1, the oxidation current increased slightly and the peak potential shifted towards the negative direction (Fig. 4d). In the subsequent backward scan, the reverse peak current values were greater under high KOH concentrations as well. This phenomenon can be interpreted as more ⋅OH being generated on the active sites with increasing KOH concentration, yielding improved catalytic performance.
CV curves of the A3-modified GCEs in aqueous (a) 1.0 M KOH solution with various C2H5OH concentrations and (d) 1.0 M C2H5OH solution with various KOH concentrations ranging from 0.1 to 6.0 M. (b,e) The corresponding onset potential and (c,f) the corresponding specific activities and the I f/I b ratios.
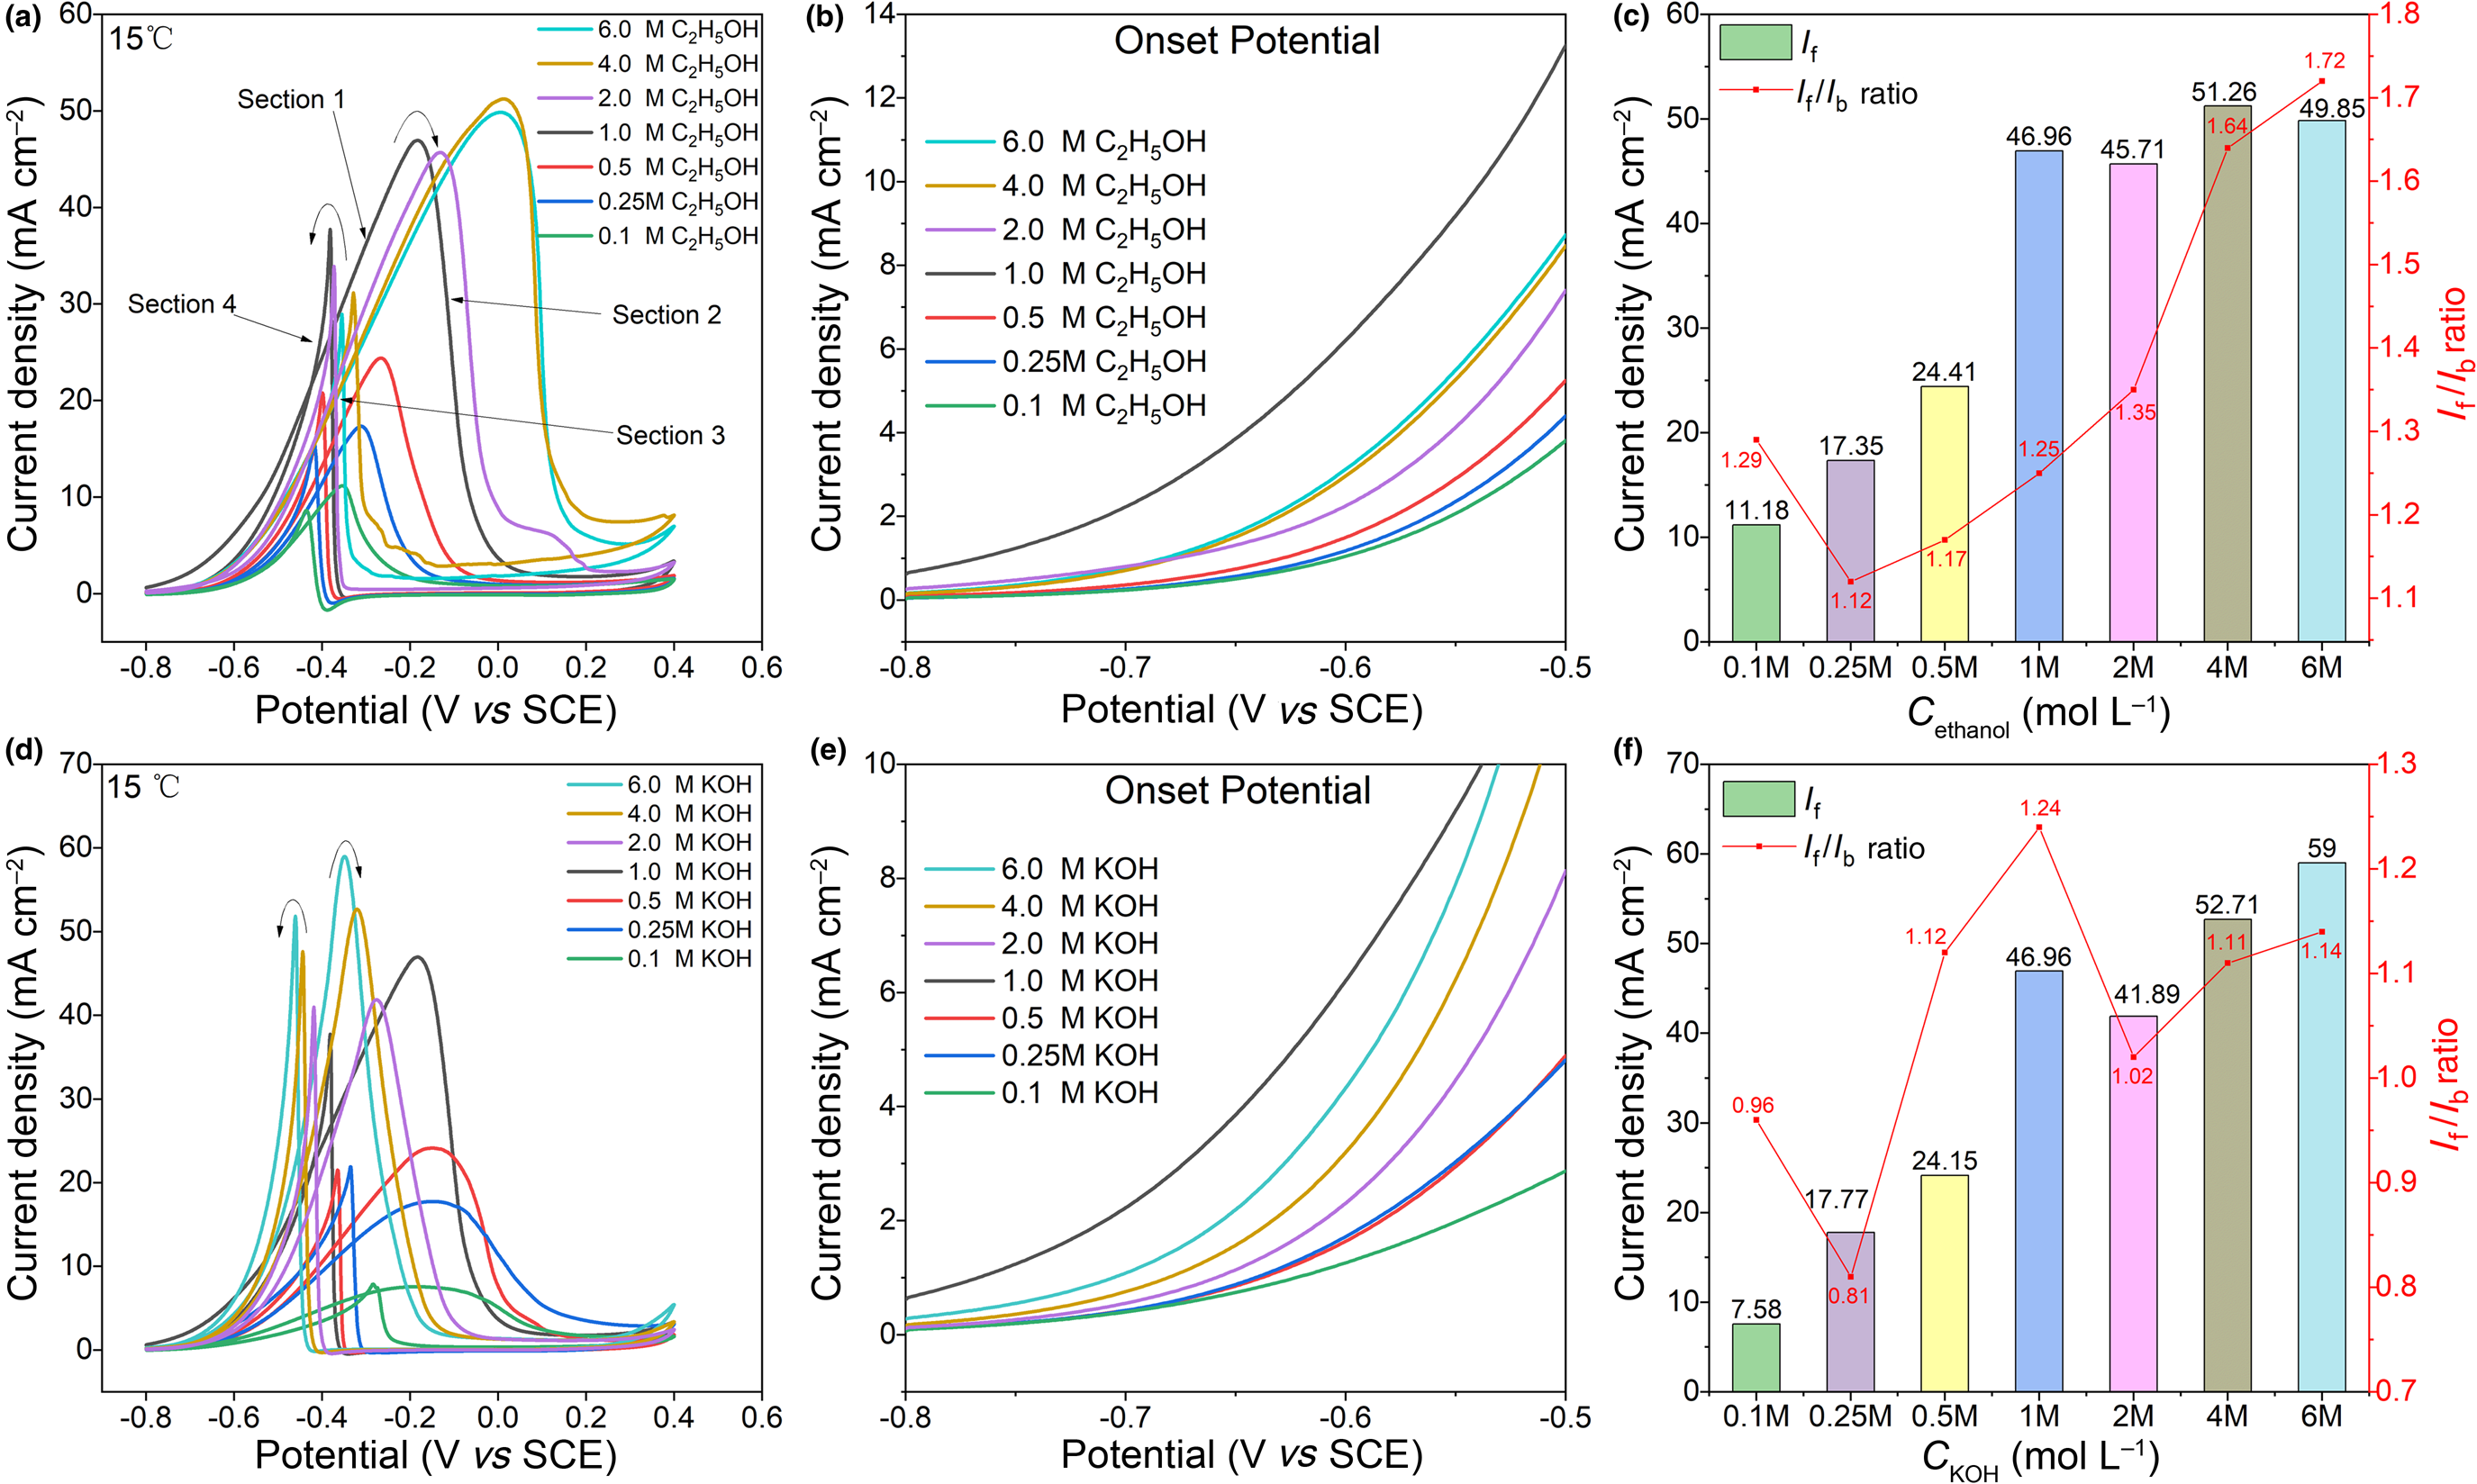
However, the I f/I b ratio did not show a linear trend with increasing ethanol or KOH concentration. With the increase of the C2H5OH concentration from 0.10 to 0.25 mol L–1, the I f/I b ratio decreased and then rose gradually from 0.25 to 6.00 mol L–1 (Fig. 4c). This result indicates that when the ethanol concentration increased from 0.1 to 6.0 mol L–1, the anti-poisoning performance first decreased slightly and then increased, which may be related to the amount of free Pd active sites (Nguyen et al., Reference Nguyen, Law, Nguyen, Kristian, Wang, Chan and Wang2009). When the concentration of KOH was fixed, the amount of ⋅OH remained almost unchanged during the forward scan. With increasing ethanol concentration, more active sites would be occupied by ethanol molecules (cf. Equation 6), which promoted the reaction shown in Equation 9 and decreased the generation of Pd-O shown in Equation 10. Thus, the current density during reverse scanning was reduced as a result.


When the KOH concentration increased from 0.1 to 6.0 mol L–1, the I f/I b ratio was 0.81–1.24, remaining nearly constant. Moreover, as the concentration of C2H5OH increased from 0.1 to 6.0 mol L–1, the peak potential (E p) for ethanol oxidation became more positive by 168 mV. At the end of the reaction in Equation 9, some fresh Pd sites were generated and participated in the subsequent reaction, as was manifested in the right shift of the peak potential, and the current attenuation controlled by Equation 10 was delayed to a certain extent. The E p shift and the decline in the I f/I b ratio indicate that this catalyst has good anti-poisoning ability (Safavi et al., Reference Safavi, Kazemi, Momeni, Tohidi and Mehrin2013). However, when the KOH concentration increased from 0.1 to 6.0 mol L–1, the E p for ethanol oxidation became more negative by 196 mV. Hence, with increasing concentration of C2H5OH and KOH solutions, the peak potential shifted in various directions. This phenomenon could be explained as follows: the increase in ethanol concentration led to the greater production of intermediates, which were oxidized subsequently at a greater potential. With increasing KOH concentration, the concentration of OH– in the solution was greater, resulting in the easier generation of ⋅OH, and so the reaction reached the maximum reaction rate easily. From this general trend, the onset potential decreased with increasing ethanol and KOH concentrations, except for the one at 1.0 mol L–1 (Fig. 4b,e). This might be explained by the fact that the optimum ratio of ethanol:KOH of 1:1 could facilitate the release of active Pd sites by reducing possible intermediates such as Pd-CH3COads and Pd-O, among others.
In summary, greater current density and a lesser onset potential could be observed as the ethanol/KOH concentration increased from 0.1 to 1.0 mol L–1. One possible explanation for this might be the competitive adsorption of ethanol molecules and its oxidative intermediates on the active sites, which alleviates the poisoning of the electrode (Zhou et al., Reference Zhou, Zhai, Du, Xu and Yang2009). Another important explanation could be the increased coverage of hydroxyl ions under a greater KOH concentration, leading to the promotion of the formation of a hydroxyl adsorbent (Pd-OHads) through single-electron transfer during anodic scanning, which led to a more negative onset potential and a greater oxidation current (Lao et al., Reference Lao, Yang, Chen, Zhang and Guo2021). The corresponding catalytic current density in the steady state could be expressed by Equation 11 (Wen et al., Reference Wen, Yang, Liang, He and Song2010):

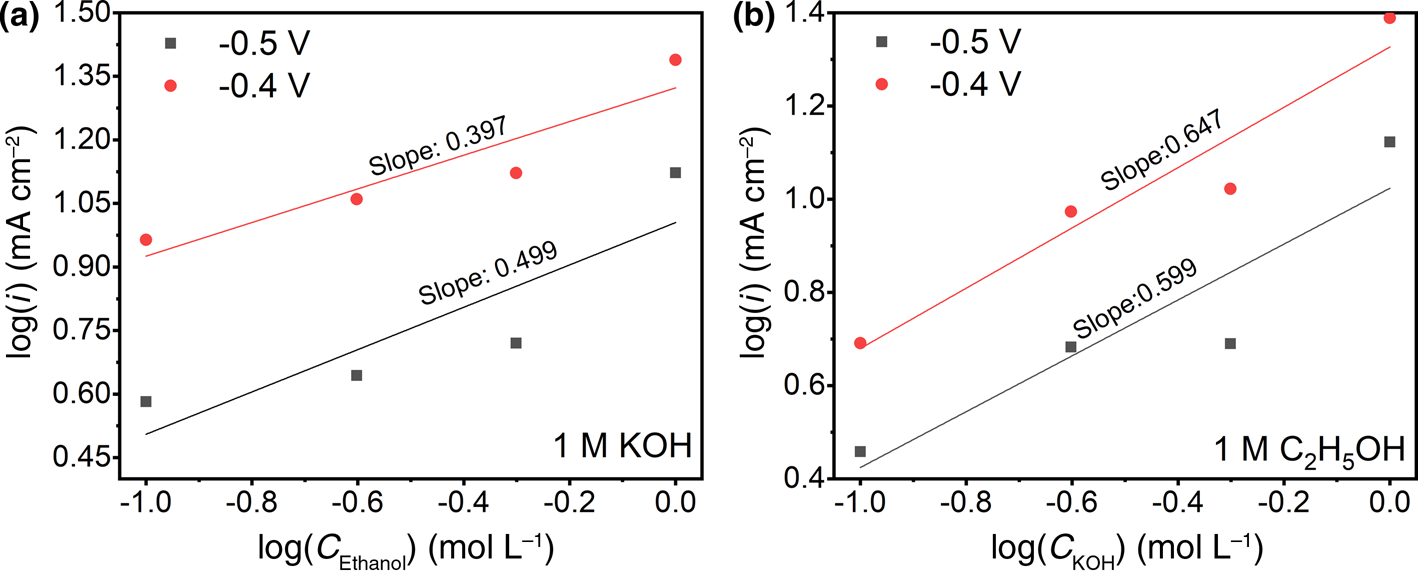
where i, n, F and K are the current at a specific potential, the number of electrons transferred, the Faraday constant and the reaction constant of EOR, respectively, C ethanol and C KOH are the concentrations of ethanol and KOH, respectively, and M and N are constants that can be determined through the slopes of the fitted lines as shown in Fig. 5. Taking logarithms on both sides of Equation 11at the same time, n, F and K will be transferred to the intercept term and the slope will represent the corresponding reaction order at a specific potential (Fig. 5a,b). It is clear that the reaction rate was related more closely with the KOH concentration rather than the ethanol concentration.
(a) Plots of log(i) vs log(C Ethanol) in 1.0 M KOH with various ethanol concentrations from 0.1 to 1.0 M and (b) plots of log(i) vs log(C KOH) in 1.0 M ethanol with various KOH concentrations from 0.1 to 1.0 M of the A3-modified GCE. The current densities at various potentials in CV measurements were used for comparison.

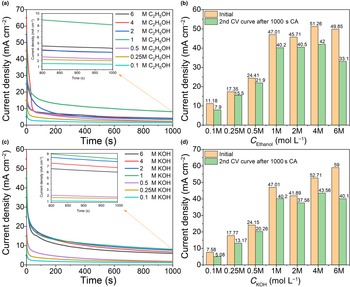
Figure 6a,c shows the 1000 s i–t curves (CA technique) at the peak potential according to the CV curves of A3 at various ethanol and KOH concentrations. Constant currents could be achieved under all tested conditions, indicating the effectiveness of the as-prepared sepiolite catalyst regarding EOR. The peak current density of the CV curves obtained after 1000 s CA was compared with that before CA, which indicated that the activity of the catalyst decreased in high-ethanol/KOH solutions (Fig. 6b,d). After 1000 s of the i–t test, the peak current densities of the CV curves at all concentrations could still reach >66% of the values before the i–t test.
(a) 1.0 M KOH solution with various C2H5OH concentrations ranging from 0.1 to 6.0 M and (c) 1.0 M C2H5OH solution with various KOH concentrations ranging from 0.1 to 6.0 M. (b,d) The corresponding forward peak current densities of initial and second CV curves after 1000 s CA.

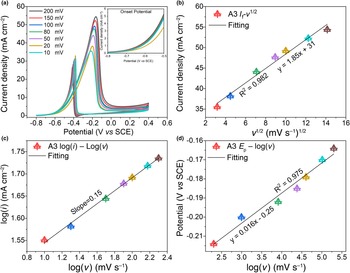
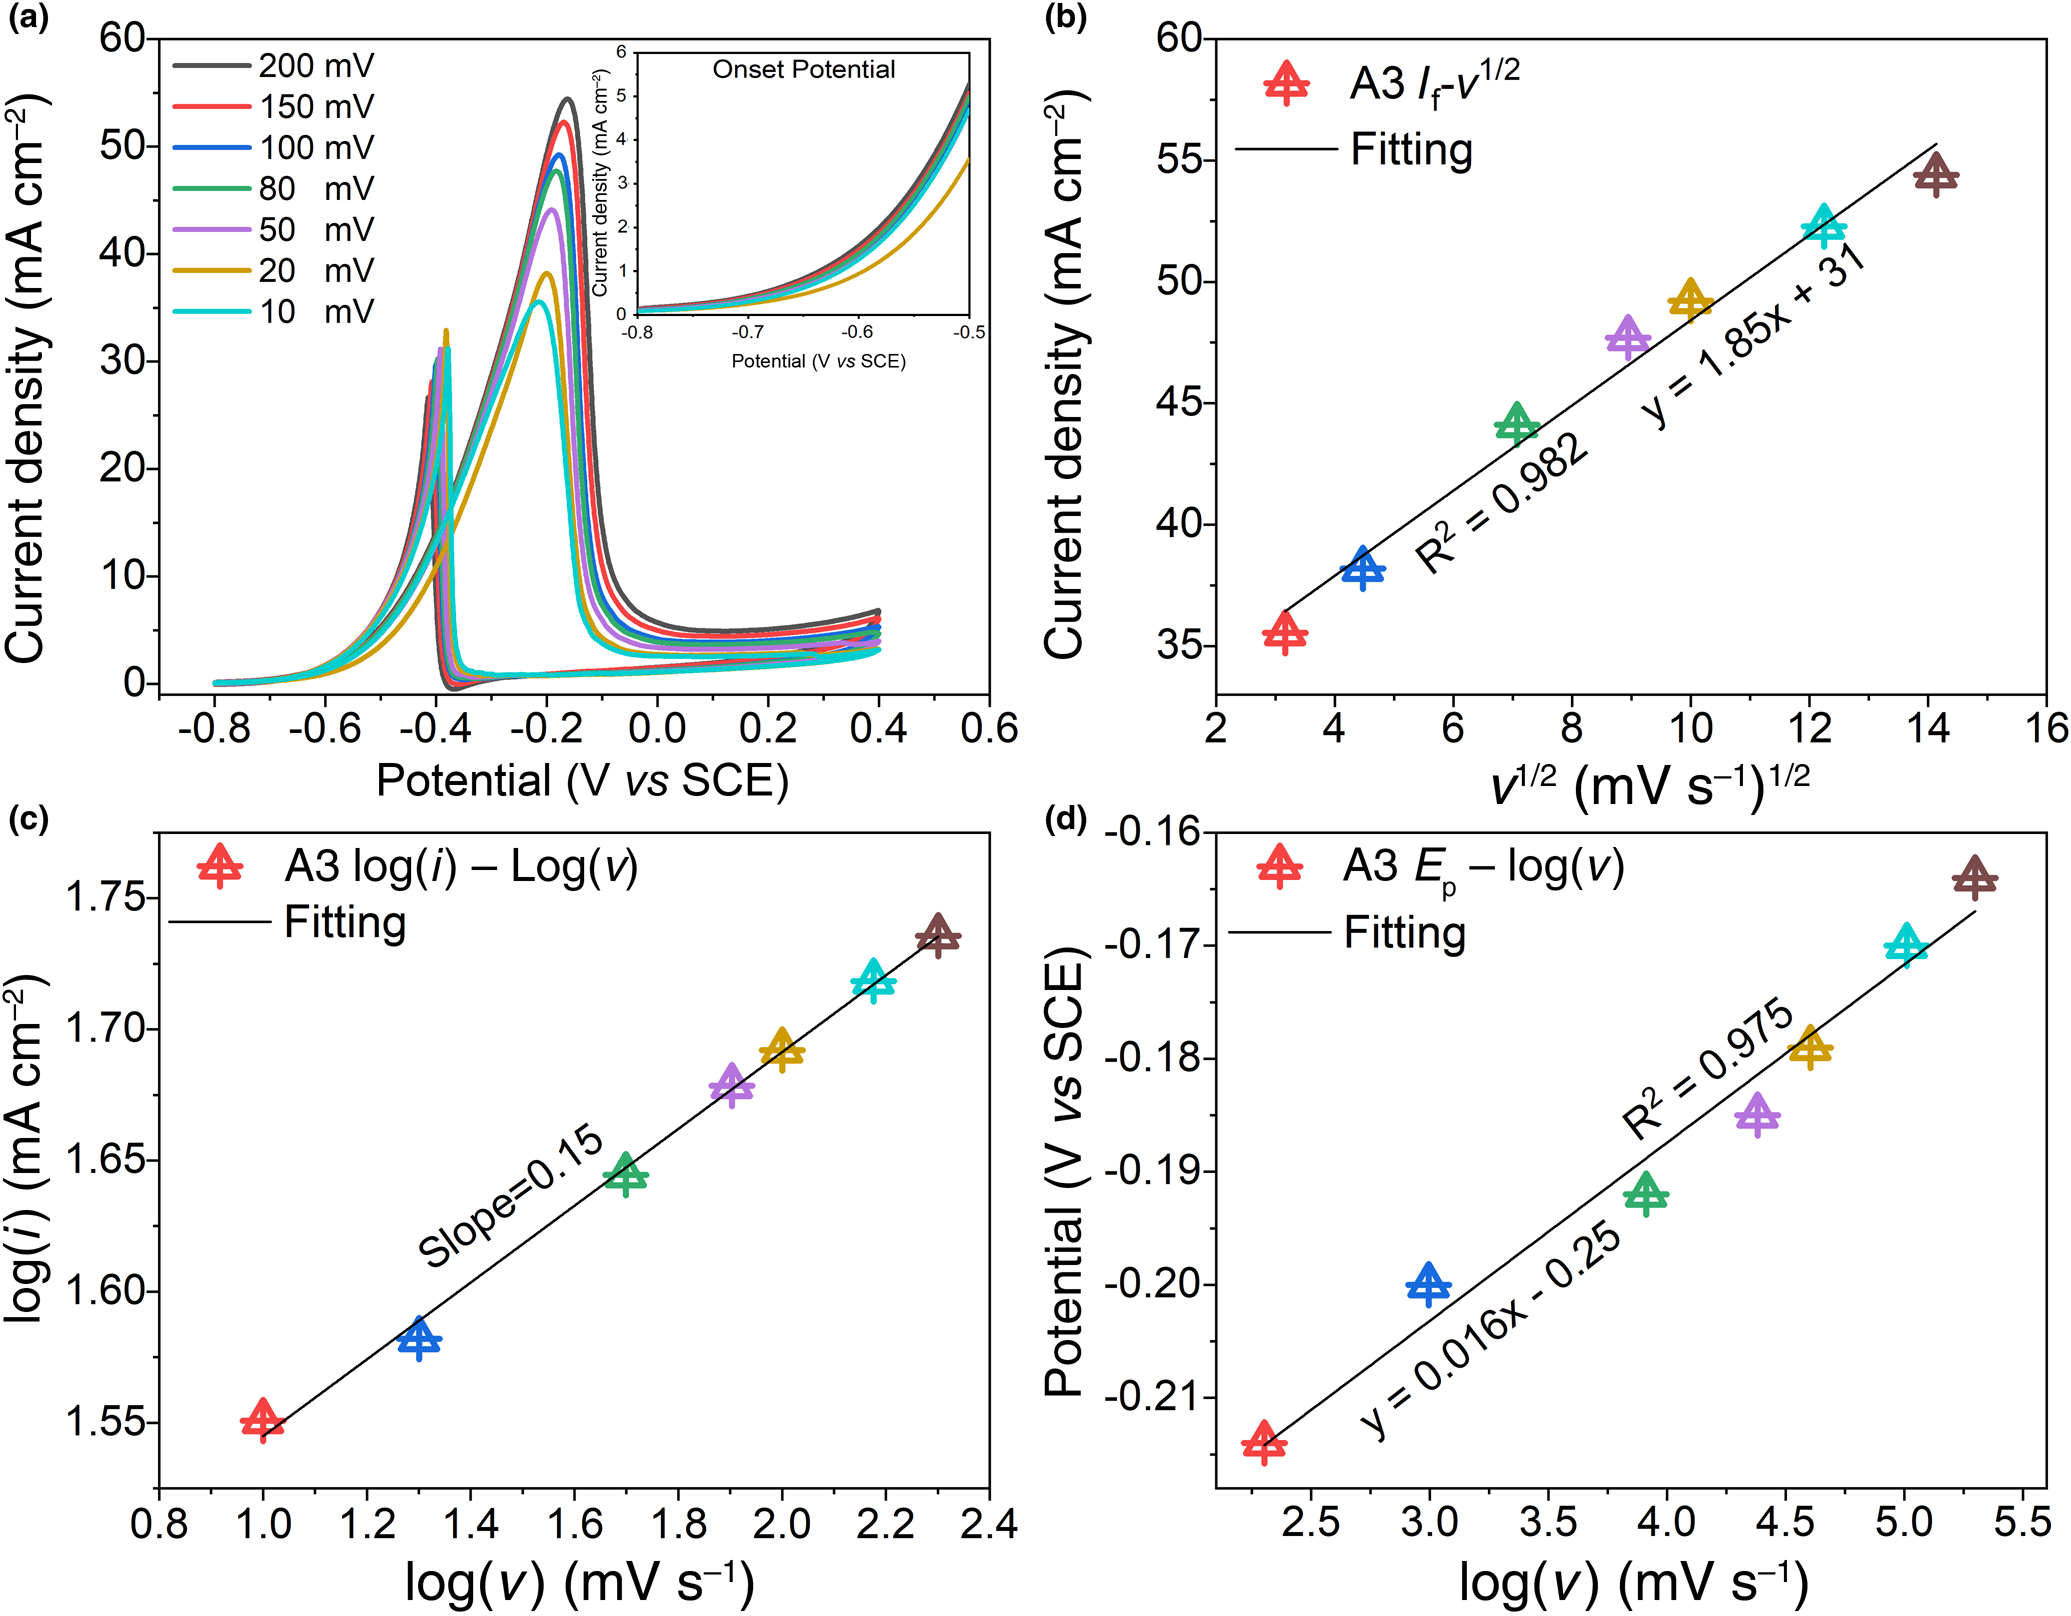
The peak current densities and peak potentials of Pd-sepiolite in 1.0 mol L–1 KOH/ethanol solution were plotted against scanning rates (Fig. 7). A positive linear correlation was observed between the peak current densities of forward scans and the square root of the scan rates (v 1/2) with a correlation coefficient of 0.982 (Fig. 7b), suggesting that the kinetics of EOR catalysed with Pd-sepiolite were influenced by the diffusion process, which is in accordance with previous reports (e.g. Li et al., Reference Li, Duanmu, Wan, Cheng, Zhang and Dai2019). As the regression line did not pass through the origin, pre-adsorption of reactants might have taken place before the electrolytic process. To further investigate the influence of diffusion on EOR, the relationship between the logarithm of the current densities and the logarithm of the scanning rates was fitted (Fig. 7c). The slope of the fitting line is 0.15, indicating that the diffusion process had a moderate effect on the electrocatalytic EOR of the catalyst. A linear relationship holds between the E p and the logarithm of the scan rates (Fig. 7d) with a correlation coefficient of 0.975, indicating that the oxidation of ethanol on the surface of Pd-sepiolite was irreversible (Sun et al., Reference Sun, Zhang, Liang and Li2009).
(a) CV curves of the A3-modified GCEs under various scanning rates in aqueous 1.0 M C2H5OH + 1.0 M KOH solution. (b) The relationship between the peak current density and the square root of the sweep speed. (c) The relationship between the logarithm of current density and the logarithm of the scan rate. (d) The relationship between E p and the logarithm of the scan rate.
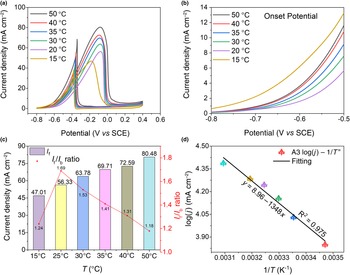
When the temperature increased from 15 to 50°C, both the forward and reverse scan peak current densities (I f and I b, respectively) increased significantly (Fig. 8a), indicating that high temperatures were beneficial for the oxidation of ethanol. With increasing temperature, the peak current density of the A3-modified GCEs increased from 47.0 to 80.5 mA cm–2 (at 15 and 50°C, respectively). Moreover, the onset potential decreased gradually with increasing temperature (Fig. 8b). However, the CV at 15°C showed the lowest starting potential, which may be ascribed to the pre-adsorption of ethanol molecules on the active sites. With increasing temperature, the oxidation of both ethanol and intermediates was increased, and the I f/I b ratio increased initially and then decreased (Fig. 8a,c), indicating that the catalyst had good anti-poisoning performance. At various temperatures, all of the catalysts could remove toxic intermediate products.
(a) CV curves of the A3-modified GCE in 1.0 M KOH + 1.0 M C2H5OH solution at various catalytic temperatures. (b) The corresponding onset potential, (c) the corresponding specific activities and the I f/I b ratio and (d) the Arrhenius plots.

The activation energy (E a) of the EOR calculated from the Arrhenius diagram (Fig. 8d) was 11.2 kJ mol–1 according to Equation 12 (Cohen et al., Reference Cohen, Volpe and Abruna2007; Nguyen et al., Reference Nguyen, Tan, Lee, Chan, Wang and Wang2011; Ruiz-Garcia et al., Reference Ruiz-Garcia, Heras, Angel Gilarranz, Aranda and Ruiz-Hitzky2018):

where i represents the current, R represents the universal gas constant, T represents the system temperature, Ea represents the activation energy of the reaction and A is a constant. The activation energies for EOR using carriers loaded with Pd, which were determined in previous works, are 25–32 kJ mol–1 for activated carbons (Shindler et al., Reference Shindler, Matatov-Meytal and Sheintuch2001), 47 kJ mol–1 for alumina (Díaz et al., Reference Díaz, Casas, Mohedano, Calvo and Rodríguez2008), 39 kJ mol–1 for fibrous clays (Molina et al., Reference Molina, Calvo, Gilarranz, Casas and Rodriguez2009) and 16 kJ mol–1 for specific silica/carbon nanocomposites (Jin et al., Reference Jin, Yu, Wang, Wan, Li and Lu2009). Thus, the activation energy of Pd loaded on sepiolite was lower than those of other common carriers, indicating a greater catalytic ability and potential for commercial application.
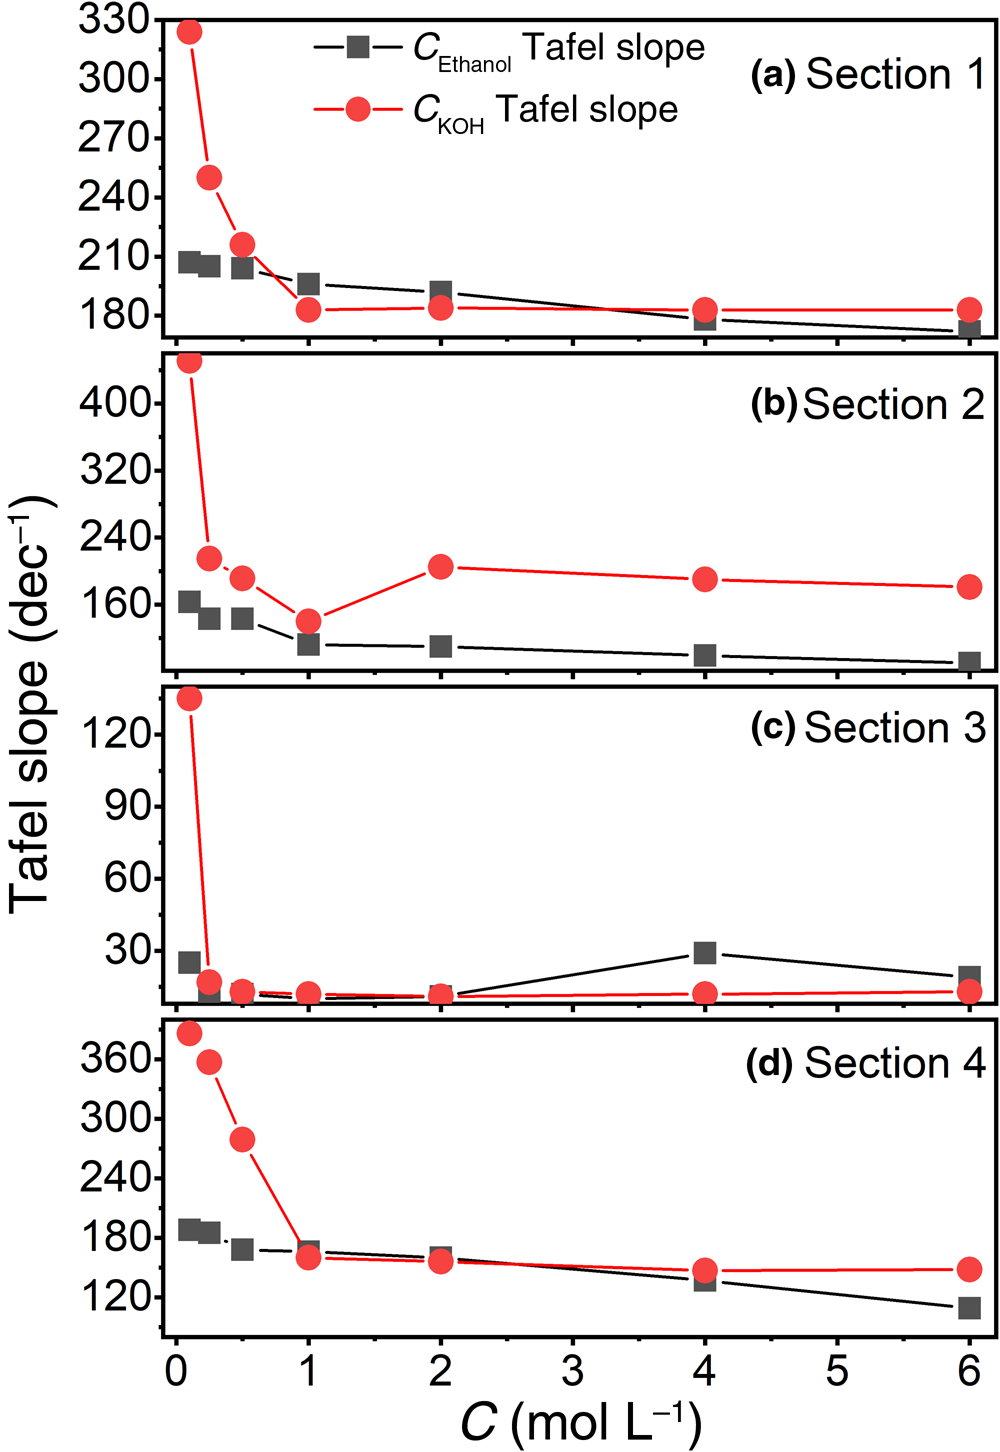
The Tafel slope is one of the key parameters for evaluating the electrochemical activity of electrocatalysts. Figure 9 shows the statistics of the Tafel slope of A3-modified GCEs at various stages of the EOR. The detailed Tafel slopes of each stage are plotted in Figs S7 & S8. As the concentration of KOH and ethanol increased from 0.1 to 6.0 mol L–1, the Tafel slope showed a general downward trend, indicating the acceleration of the EOR. The Tafel slopes of each stage of CV decreased as the concentration of C2H5OH/KOH increased. The catalysts with a lesser Tafel slope had a greater peak current density during previous CV tests. Generally, KOH affected the whole EOR process in terms of the oxygen pathway (oxidation pathway Pd → Pd-OHads → Pd-O; reduction pathway: Pd-O → Pd; Chen et al., Reference Chen, Yang, Pang, Gao and Guo2021), while C2H5OH influenced the EOR in terms of the carbon pathway (Pd-C2H5OHads → Pd-CH3COads → Pd-CH3COOHads; Nguyen et al., Reference Nguyen, Law, Nguyen, Kristian, Wang, Chan and Wang2009).
Tafel slope statistics of the A3-modified GCE in 1.0 M KOH solution with various ethanol concentrations ranging from 0.1 to 6.0 M and in 1.0 M ethanol solution with various KOH concentrations ranging from 0.1 to 6.0 M obtained from previous CV curves marked as (a) section 1, (b) section 2, (c) section 3 and (d) section 4.

Conclusions
The Pd-sepiolite synthesized using a simple impregnation method had greater catalytic activity and anti-toxicity than a metallic Pd disc electrode due to its unique morphological characteristics and electronic structure. Pd was located in the fibrous and porous structure of sepiolite, which might contribute to its great electrochemical activity regarding ethanol oxidation. Under the experimental conditions studied, increasing Pd loading improved the catalytic performance due to the increased number of active sites and the surface defects on the Pd-sepiolite. Temperature, scan rates and ethanol and KOH concentrations had positive relationships with the EOR. Considering the activity and stability of the electrode, the A3-modified GCE with a Pd:sepiolite ratio of 0.72 is recommended for long-term DEFCs.
Financial support
The authors acknowledge the financial support of the National Natural Science Foundation of China (Project No. 51208299) and the University of Shanghai for Science and Technology (Science and Technology Development Project No. 2018KJFZ101 and 2020KJFZ112).
Conflicts of interest
The authors claim that they have no known competitive financial interests or individual relationships that could have appeared to influence the work reported in this paper.
Author contributions
Junkai Zhao: investigation, data analysis, draft preparation. Liang Li: conceptualization, writing – review and editing, supervision. Liuqiang Li: data curation, methodology. Siru Zhang: investigation, data validation. Shiqi Chen: literature searching. Zheng Yuan: formal analysis. Ling Wang: validation, visualization.
Supplementary material
To view supplementary material for this article, please visit https://doi.org/10.1180/clm.2022.40.