1. Introduction
Integrated studies of enclaves and their host and associated rocks can provide pivotal information to better understand granite petrogenesis and evolution. Enclaves are dark, fine-grained inclusions commonly found in granitic rocks and have an important role in elucidating the source of the host granitic rocks, magmatic processes and crustal evolution (Didier, Reference Didier1973; Vernon, Reference Vernon1984; Bacon, Reference Bacon1986; Holden et al. Reference Holden, Halliday and Stephens1987; Waight et al. Reference Waight, Maas and Nicholls2001; Donaire et al. Reference Donaire, Pascual, Pin and Duthou2005; Shellnutt et al. Reference Shellnutt, Jahn and Dostal2010; Sun et al. Reference Sun, Yang, Wu, Li, Yang, Xie and Wilde2010; Wang et al. Reference Wang, Li, Jia, Wyman, Tang, Li, Ma, Yang, Jiang and Gou2012; Farner et al. Reference Farner, Lee and Putirka2014; Zhang et al. Reference Zhang, Wang, Castro, Zhang, Shi, Tong, Zhang, Guo, Yang and Iaccheri2016; Rong et al. Reference Rong, Zhang and Zheng2017). The models proposed to explain the formation of enclaves can be divided into open and closed (cognate) systems. The open system is characterized by the presence of foreign lithic/crystal fragments or mantle-derived magma incorporated during the emplacement of the host magma, including country rock (Barbarin, Reference Barbarin2005) or material from deeper levels of the crust (Domenick et al. Reference Domenick, Kistler, Dodge and Tatsumoto1983; Xu et al. Reference Xu, Gao, Wang, Wang and Liu2006) and remnants of mingled (Browne et al. Reference Browne, Eichelberger, Patino, Vogel, Dehn, Uto and Hoshizumi2006; Karsli et al. Reference Karsli, Chen, Aydin and Şen2007; Zhang et al. Reference Zhang, Wang, Castro, Zhang, Shi, Tong, Zhang, Guo, Yang and Iaccheri2016) or mixed (Holden et al. Reference Holden, Halliday and Stephens1987; Mass et al. Reference Mass, Nicholls and Legg1997; Yang et al. Reference Yang, Wu, Wilde, Xie, Yang and Liu2007 b; Chen et al. Reference Chen, Chen and Jahn2009; Sun et al. Reference Sun, Yang, Wu, Li, Yang, Xie and Wilde2010) magmas with or without a gabbroic composition. Enclaves of the closed system may be represented by restites (Chappell et al. Reference Chappell, White and Wyborn1987; Chappell, Reference Chappell1996; Chappell & Wyborn, Reference Chappell and Wyborn2012) and/or unmelted portions of the source region (White et al. Reference White, Chappell and Wyborn1999; Carvalho et al. Reference Carvalho, Sawyer and Janasi2017), autoliths from the early formed portions of the granitic magma with a high degree of crystal accumulation (Langmuir, Reference Langmuir1989; Bea, Reference Bea2010; Shellnutt et al. Reference Shellnutt, Jahn and Dostal2010; Niu et al. Reference Niu, Zhao, Zhu and Mo2013) and aggregates from the back-reaction of peritectic mafic minerals with the host granitic melt (Rong et al. Reference Rong, Zhang and Zheng2017).
Among these, the most popular interpretation has always emphasized the contribution of mantle-derived magma as a material and heat source (Niu et al. Reference Niu, Zhao, Zhu and Mo2013) to explain the various isotopic features in enclaves–host rocks and certain minerals (Yang et al. Reference Yang, Wu, Wilde, Xie, Yang and Liu2007 b; Sun et al. Reference Sun, Yang, Wu, Li, Yang, Xie and Wilde2010). However, there are large granitic provinces in which the igneous rocks are predominantly felsic and the mafic ones, if present, are usually minor (Sheth, Reference Sheth2007; Alves et al. Reference Alves, Janasi, Simonetti and Heaman2009; Huang et al. Reference Huang, Li, Li and Li2015). In such cases, their origin is not related to mantle input but rather to different processes. For instance, chemical and isotopic variations may also be influenced by source nature and melting conditions (Hogan & Sinha, Reference Hogan and Sinha1991; Hammouda et al. Reference Hammouda, Pichavant and Chaussidon1996; Knesel & Davidson, Reference Knesel and Davidson1996; Ayres & Harris, Reference Ayres and Harris1997; Davies & Tommasini, Reference Davies and Tommasini2000; Zeng et al. Reference Zeng, Asimow and Saleeby2005 a,b; Tang et al. Reference Tang, Wang, Shu, Wang, Yang and Gopon2014; Huang et al. Reference Huang, Li, Li and Li2015; Hammerli et al. Reference Hammerli, Kemp, Shimura, Vervoort and Dunkley2018). Therefore, it is necessary to re-evaluate the petrogenesis of enclaves and their host granitic rocks in some large granitic provinces.
Magma chambers are active systems where many evolutionary processes could occur including fractional crystallization, assimilation and magma mixing (Hawkesworth et al. Reference Hawkesworth, Blake, Evans, Hughes, Macdonald, Thomas, Turner and Zellmer2000, Reference Hawkesworth, George, Turner and Zellmer2004). Even if crystal fractionation of less-evolved magmas is an important mechanism to generate evolved magmas in closed magmatic systems, there are also various degrees of magma evolution (e.g. Miller, Reference Miller1985). Granitic rocks are extensively exposed in the South China Block (SCB), and these rocks are often composed of a series of rock units (e.g. granodiorite, biotite granite and leucogranite) (Wang et al. Reference Wang, Ma, Zhang, Zhang and Marks2014; Huang et al. Reference Huang, Li, Li and Li2015). In such igneous complexes, the evolved rock types generally show clear late intrusive contacts towards the other rock units (e.g. Wang et al. Reference Wang, Ma, Zhang, Zhang and Marks2014). Therefore, it is important to clarify whether or not fractional crystallization is the dominant cause of the silicic magma evolution.
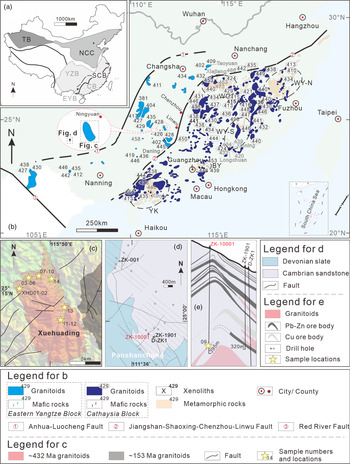
This study investigates the origin of enclaves and their host granitic rocks in the middle Palaeozoic Xuehuading (XHD) and Panshanchong (PSC) granitic plutons, exposed or drilled in the SCB (Fig. 1b). We present field and petrographic observations, U–Pb zircon dating, mineral composition (major and trace elements) and Nd–Hf isotopic data to reveal the ages, sources and crystallization conditions of the enclaves and host rocks, and their implications for the crustal evolution of the SCB during intracontinental orogenic processes (e.g. Ou et al. Reference Ou, Lai, Carvalho, Zi, Kong, Li and Jiang2019). The results show that the variable isotopic signatures of the enclaves, host rocks and certain minerals were not only controlled by their heterogeneous source but also influenced by the disequilibrium melting process.
(a) Simplified map showing the main tectonic units of China. Abbreviation: SCB – South China Block; YZB – Yangtze Block; CB – Cathaysia Block; NCC – North China Block; TB – Tarim Block. (b) Schematic map showing the distribution of the middle Palaeozoic magmatic rocks in the South China Block. Abbreviation: YK – Yunkai dome; BY – Baiyun dome; WY-S – southern Wuyishan dome; WY-N – northern Wuyishan dome; WG – Wugongshan dome. The number near the magmatic rocks represents the U–Pb zircon ages from previous works based on Ou et al. (Reference Ou, Lai, Carvalho, Zi, Kong, Li and Jiang2019). (c) Geological map of the Xuehuading (XHD) granitic pluton. (d) Geological map and (e) cross-section of prospecting line of the Panshanchong (PSC) area.

2. Geological setting
2.a. Regional geology
The SCB is composed of the Yangtze Block in the west and the Cathaysia Block in the east (Fig. 1a), which were separated by the Jiangshan–Shaoxing Fault (JSF), verified by Neoproterozoic ophiolites, arc-type granite and high-pressure/low-temperature blueschists (Li et al. Reference Li, Li, Li and Liu2008, Reference Li, Li, Li, Lo, Wang, Ye and Yang2009; Yao et al. Reference Yao, Shu, Santosh and Zhao2014). However, the southward extension of the JSF is uncertain owing to poor exposure and younger tectonic modifications (Li et al. Reference Li, Li, Wartho, Clark, Li, Zhang and Bao2010; Wang et al. Reference Wang, Fan, Zhang and Zhang2013 a). More and more geochemical and geophysical evidence supports the Chenzhou–Linwu Fault (CLF) as being the southwestern boundary between the two blocks (Fig. 1b; Zhang & Wang, Reference Zhang and Wang2007; Zhang et al. Reference Zhang, Wang, Zhang, Fan, Zhang and Zi2012; Wang et al. Reference Wang, Fan, Zhang and Zhang2013 a). Previous studies have confirmed that the Yangtze and Cathaysia blocks have been a single block since their collision in Neoproterozoic time (Wang et al. Reference Wang, Xu, Jian, Bao, Zhao, Li, Xiong and Ma2006; Li et al. Reference Li, Li, Li and Liu2008).
The basement of the Yangtze Block is predominantly composed of Proterozoic metamorphic rocks (Chen & Jahn, Reference Chen and Jahn1998) and a small amount of Archaean rocks known as the Kongling Complex (Gao et al. Reference Gao, Ling, Qiu, Lian, Hartmann and Simon1999; Qiu et al. Reference Qiu, Gao, McNaughton, Groves and Ling2000). In the Cathaysia Block, no Archaean basement has been reported; there are some Palaeoproterozoic granites and metasedimentary and volcanic rocks exposed in the northeastern Wuyi dome area (Fig. 1b; Yu et al. Reference Yu, Wang, Griffin, O’Reilly, Zhang, Li and Shu2009, Reference Yu, O’Reilly, Wang, Griffin, Zhou, Zhang and Shu2010). The middle Palaeozoic faults and related folds are exposed in the southeastern SCB, i.e. east of the Anhua–Luocheng Fault (Fig. 1b). The Eastern Yangtze Block only underwent greenschist metamorphism and thin-skinned thrust tectonics (Charvet et al. Reference Charvet, Shu, Faure, Choulet, Wang, Lu and Breton2010); however, the Cathaysia Block is characterized by both thin- and thick-skinned structures and greenschist- to granulite-facies metamorphism (Faure et al. Reference Faure, Shu, Wang, Charvet, Choulet and Monie2009; Charvet et al. Reference Charvet, Shu, Faure, Choulet, Wang, Lu and Breton2010). Middle Palaeozoic igneous rocks are important products of the Phanerozoic magmatism to the east of the Anhua–Luocheng Fault in the eastern SCB (Fig. 1b).
An evident geological feature of the SCB is the extensive occurrence of Phanerozoic igneous rocks dominated by granites (Fig. 1b), which are regarded as one of the biggest granitic provinces worldwide (Zhang et al. Reference Zhang, Wang, Zhang, Fan, Zhang and Zi2012; Wang et al. Reference Wang, Fan, Zhang and Zhang2013 a; Huang et al. Reference Huang, Li, Li and Li2015). These granites mainly occur to the east of the Anhua–Luocheng Fault (including the Eastern Yangtze Block and Cathaysia Block; Fig. 1b) and were formed in response to three major events, namely the Kwangsian (middle Palaeozoic), Indosinian (Triassic) and Yanshanian (Jurassic–Cretaceous) tectonothermal events (Wang et al. Reference Wang, Fan, Zhang and Zhang2013 a). Middle Palaeozoic igneous rocks in the SCB are dominated by calc-alkaline granites (Wang et al. Reference Wang, Fan, Zhang and Zhang2013 a; Ou et al. Reference Ou, Lai, Carvalho, Zi, Kong, Li and Jiang2019) with minor contemporaneous basaltic rocks (Yao et al. Reference Yao, Li, Li, Wang, Li and Yang2012; Wang et al. Reference Wang, Zhang, Fan, Zhang and Zhang2013 b; Zhong et al. Reference Zhong, Ma, Zhang, Wang, She, Liu and Xu2013, Reference Zhong, Ma, Liu, Zhao, Zheng, Nong and Zhang2014; Jia et al. Reference Jia, Wang and Yang2017). Recent studies have shown a strong petrological contrast between the Eastern Yangtze Block and Cathaysia Block (Wang et al. Reference Wang, Fan, Zhang and Zhang2013 a; Ou et al. Reference Ou, Lai, Carvalho, Zi, Kong, Li and Jiang2019). For instance, after the magmatic age peak, a remarkable juvenile component is well observed in the Cathaysia Block granitic rocks but not in the Eastern Yangtze Block (c. 424 Ma for the Eastern Yangtze Block and c. 438 Ma for the Cathaysia Block; Ou et al. Reference Ou, Lai, Carvalho, Zi, Kong, Li and Jiang2019). Only minor mafic magmatic rocks (including mafic microgranular enclaves) occur in the Eastern Yangtze Block (including Daning lamprophyres (c. 432 Ma) (Jia et al. Reference Jia, Wang and Yang2017) and Taoyuan hornblende gabbros (c. 409 Ma) (Zhong et al. Reference Zhong, Ma, Zhang, Wang, She, Liu and Xu2013); Fig. 1b), exposed near the JSF–CLF, which penetrated the Moho (Zhang & Wang, Reference Zhang and Wang2007).
2.b. Granitic rocks and enclaves from Xuehuading (XHD) and Panshanchong (PSC)
The study area is situated in southwestern Hunan Province, Eastern Yangtze Block, which is located west of the CLF (Fig. 1b). Most of the faults in the study area show a northeastern strike (Fig. 1c, d). The XHD granitic pluton is located southwest of Ningyuan county and has an exposed area of ~109 km2 (Fig. 1c). The pluton intruded early Palaeozoic metamorphic rocks (Fu et al. Reference Fu, Ma, Xie, Zhang and Peng2004; Cheng et al. Reference Cheng, Fu, Xu, Ma, Pang and Cao2009) and has its long axis trending NNW. Moreover, it is intruded by Late Jurassic (c. 153 Ma) granites to the east (Liu et al. Reference Liu, Lai, Xiao, Jeffrey, Du, Li, Liu, Wen and Yu2019) (Fig. 1c).
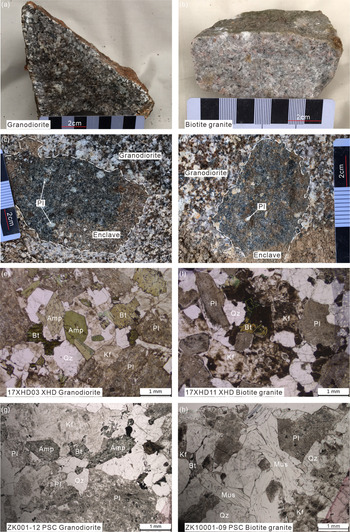
The XHD granitic rocks consist of dark grey granodiorite (Fig. 2a), grey biotite granite (Fig. 2b) and dark grey microgranular enclaves with sizes ranging from 5 to 10 cm (Fig. 2c, d). Granodiorites occur together with biotite granites (samples 11 and 12) in the same outcrop (Fig. 1c); however, there is no clear contact between the two rock types. The enclaves are all hosted in granodiorite. Most rocks in XHD are granodiorites dominated by plagioclase (30–40 % in modal proportion), K-feldspar (15–20 %), quartz (20–30 %), amphibole (1–5 %) and biotite (5–15 %) (Fig. 2e). The biotite granite samples in XHD are hornblende free, and dominated by plagioclase (20–30 %), K-feldspar (20–25 %), quartz (30–40 %) and biotite (5–15 %) (Fig. 2f). Enclaves are dioritic to granodioritic in composition, with main mineral assemblages of plagioclase (34–65 %), biotite (12–15 %) and amphibole (2–6 %); a few samples also have K-feldspar (2–21 %) and quartz (8–22 %) (Cheng et al. Reference Cheng, Fu, Xu, Ma, Pang and Cao2009). In XHD, all the enclaves within the granodiorites commonly occur as lobate shapes and do not show evidence of reaction with the host magma (Fig. 2c, d). Nevertheless, there are some feldspar crystals that appear to cross the boundaries into the enclaves (Fig. 2c, d).
Representative photographs and photomicrographs of host granitic rocks and enclaves investigated in this study. Hand-specimens of (a) medium-grained black grey granodiorite, (b) grey biotite granite and (c, d) fine-grained dark grey enclaves. (e) Granodiorite with light green-euhedral amphibole in XHD (sample 17XHD03). (f) Biotite granite in XHD (sample 17XHD11). (g) Granodiorite with euhedral to subhedral amphibole in PSC (sample ZK001-12). (h) Biotite granite with elongated muscovite in PSC (sample ZK10001-09). Abbreviations: Amp – amphibole; Bt – biotite; Kf – K-feldspar; Mus – muscovite; Pl – plagioclase; Qz – quartz.

The PSC pluton is a concealed body only exposed by drilling during prospecting works, and it is 40 km away from XHD (Fig. 1d). Its size is not entirely known, but it has been interpreted to be related to the XHD pluton because of their similar rock associations and ages (see Section 4 below). Both plutons intrude the Cambrian sandstone or sandy slate (Cheng et al. Reference Cheng, Fu, Xu, Ma, Pang and Cao2009) (Fig. 1c, d).
In PSC, there are also two types of granitic rocks: granodiorite and biotite granite samples from the granitic pluton and dyke, respectively. Biotite granites occur towards the upper part, and granodiorites are the dominant rock type towards the lower part based on the drilling data in the PSC area (Fig. 1e). There are no enclaves found in the PSC samples. As a whole, the studied PSC samples show similar mineral assemblages to those from XHD (Fig. 2g, h). However, the biotite granite samples from PSC also contain muscovite and relatively lower modal proportions of biotite compared to the biotite granites from XHD (Fig. 2h). Some biotite grains show transitional optical characteristic between biotite and muscovite (left part of Fig. 2h).
3. Samples and analytical methods
3.a. Samples
We selected 17 representative samples (including two duplicates) for analysis: 13 granodiorites and 2 biotite granites from XHD, and one sample of each granodiorite and biotite granite from PSC. Even if we found an outcrop of microgranular enclaves hosted in the granodiorites during the fieldwork (Fig. 2c, d), we were unable to collect samples fresh enough. In order to remediate this problem, we used data from a previous study (Cheng et al. Reference Cheng, Fu, Xu, Ma, Pang and Cao2009), which investigated enclaves exposed in the same outcrop from which we collected our samples (online Supplementary Material Fig. S1 and site XHD14 in Fig. 1c).
3.b. Whole-rock major- and trace-element contents and Nd isotopes
After petrographic examinations, the least-altered whole-rock samples were selected for geochemical and Nd isotopic analyses. The rocks were sawn into small chips, ultrasonically cleaned in distilled water, and subsequently dried and handpicked to remove any visible contamination (e.g. weathered surfaces). Then the rocks were crushed and ground in an agate mortar and subjected to 1 minute of milling each time, three times (total milling time around 3 minutes), and the resulting powders were used for analyses of major and trace elements and Nd isotopes at the Guangxi Key Laboratory of Hidden Metallic Ore Deposits Exploration, Guilin University of Technology (GKLaHMODE GLUT), Guilin and Nanjing FocuMS Technology Co. Ltd (FocuMS), respectively. Major-element oxides were analysed using a Rigaku RIX 2000 X-ray fluorescence spectrometer at GLUT on fused glass beads. Calibration lines used in quantifications were produced by bivariate regression of data from 36 reference materials encompassing a wide range of silicate compositions. The analytical results for the USGS reference standards (GSR-1, GSR-2 and GSR-3) indicate that the analytical uncertainties were generally less than 2 %. Trace elements (including rare earth elements (REEs)) were analysed using a Perkin-Elmer Sciex ELAN 6000 inductively coupled plasma mass spectrometer (ICP-MS). Analytical procedures are identical to those described in Li et al. (Reference Li, Li, Wingate, Chung, Liu, Lin and Li2006). USGS reference standards (BHVO-2, AVG-2, GSR-1, GSR-2, GSR-3, W-2, SY-4, GSD-9 and SARM-4) were chosen as external calibration standards for calculating the elemental concentrations in the measured samples. The total procedure blank was treated in the same way as the samples, and was corrected in all of the samples and reference standards. Analytical precision and accuracy are better than 3 %.
Whole-rock Nd isotopic compositions of selected samples were determined using a Nu Plasma II multi-collector (MC)-ICP-MS at FocuMS. Analytical procedures are identical to those described in Li et al. (Reference Li, Liu, Sun, Li, Liang and Liu2004) and Wei et al. (Reference Wei, Liang, Li and Liu2002). Sample powders were first dissolved in distilled acetic acid (10 %) for 24 h at 60 °C, and then the residues were dissolved in Teflon beakers with HF + HNO3, and separated by conventional cation-exchange techniques. Neodymium isotopes were all purified from the same digestion solution by two-step column chemistry. The first exchange column combined with Bio-Rad AG 50W-X8 and Sr Spec resin was used to separate Sr, REEs and Pb from the sample matrix. Neodymium was separated from the other REEs on the second column with Ln Spec-coated Teflon powder. All the measured 143Nd/144Nd ratios were normalized to 146Nd/144Nd = 0.7219.
3.c. Zircon U–Pb ages and Hf isotope analyses
Zircons were separated using conventional heavy liquid and magnetic separation techniques, purified by hand-picking under a binocular microscope, mounted in an epoxy resin disc and then polished. Their internal morphology was carefully examined and target sites were selected using cathodoluminescence (CL) images obtained at FocuMS with a JSM-6510 scanning electron microscope attached to a Gatan CL detector prior to U–Pb and Lu–Hf isotope analyses.
Laser-ablation (LA)-ICP-MS U–Pb ages and trace-element concentrations in zircon were analysed simultaneously using an Agilent 7700x ICP-MS connected to an attached Analyte Excite laser-ablation system with a spot diameter of 35 μm at 8 Hz repetition rate for 40 s (equating to 320 pulses) at FocuMS. Zircon 91500 (Liu et al. Reference Liu, Hu, Zong, Gao, Gao, Xu and Chen2010) was used as the standard, and standard silicate glass NIST 610 (Liu et al. Reference Liu, Hu, Zong, Gao, Gao, Xu and Chen2010) was used to optimize the machine. Analyses were acquired with a beam diameter of 35 μm. Raw count rates for 29Si, 204Pb, 206Pb, 207Pb, 208Pb, 232Th and 238U were collected and U, Th and Pb concentrations were calibrated using 29Si as the internal calibrant and NIST 610 as the reference material. Details of the analytical techniques are described by Wu et al. (Reference Wu, Yang, Xie, Yang and Xu2006). Common Pb was corrected by ComPbCorr#3 151 (Andersen, Reference Andersen2002) for those samples with common 206Pb >1 %. The U–Pb ages were calculated using the ICPMSDataCal (version 8.0) recommended by Liu et al. (Reference Liu, Hu, Zong, Gao, Gao, Xu and Chen2010) and Isoplot/Ex 3 software (Ludwig, Reference Ludwig2003). During the analyses in this study, GJ-1 and Plešovice analysed as unknown samples yielded weighted 206Pb–238U ages of 600 ± 4 Ma (2σ, MSWD = 0.017, n = 12) and 336.2 ± 4 Ma (2σ, MSWD = 0.2, n = 5), respectively, which is in good agreement with their recommended ages (600 ± 5 Ma, GJ-1, Jackson et al. Reference Jackson, Pearson, Griffin and Belousova2004; and 337.1 ± 0.4 Ma, Plešovice, Sláma et al. Reference Sláma, Košler, Condon, Crowley, Gerdes, Hanchar, Horstwood, Morris, Nasdala, Norberg, Schaltegger, Schoene, Tubrett and Whitehouse2008). The standard zircon 91500 yielded a weighted 206Pb–238U age of 1062 ± 5 Ma (2σ, MSWD = 0.002, n = 20), which is in good agreement with the recommended age (206Pb–238U = 1062.4 ± 0.4 Ma, 207Pb–206Pb = 1065.4 ± 0.3 Ma) within errors (Wiedenbeck et al. Reference Wiedenbeck, Alle, Corfu, Griffin, Meier, Oberli, Quadt, Roddick and Spiegel1995).
In situ zircon Hf isotope measurements were subsequently done using a Neptune Plus MC-ICP-MS with a beam size of 44 μm and laser pulse frequency of 8 Hz with age determinations at the GKLaHMODE GLUT. The detailed analytical technique and data correction procedure are described by Wu et al. (Reference Wu, Yang, Xie, Yang and Xu2006). The isobaric interference of 176Lu on 176Hf is negligible owing to the extremely low 176Lu/177Hf in zircon (normally < 0.002). The standard zircon GJ-1 was used for external corrections. During the analyses, the 176Hf/177Hf ratio of the standard zircon GJ-1 was 0.282028 ± 0.000004 (2SD, MSWD = 1.5, n = 17), consistent with the recommended values (0.282000 ± 0.000005) within analytical errors (Morel et al. Reference Morel, Nebel, Nebel-Jacobsen, Miller and Vroon2008; Geng et al. Reference Geng, Li, Zhang, Zhou and Li2011).
3.d. Mineral compositions
All mineral analyses were carried out at the State Key Laboratory of Isotope Geochemistry, Guangzhou Institute of Geochemistry, Chinese Academy of Sciences with a JEOL JXA-8100 Superprobe. Operating conditions were as follows: 15 kV accelerating voltage, 20 nA beam current, 1–2 μm beam diameter, 10 second counting time and ZAF correction procedure for data reduction. The analytical procedures were described in detail by Huang et al. (Reference Huang, Xu, Lo, Wang and Lin2007).
4. Results
4.a. Zircon U–Pb ages
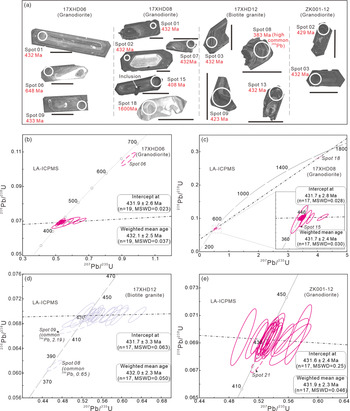
The studied granitic samples were selected for zircon dating (Fig. 3; online Supplementary Material Table S1), including three granodiorites (17XHD06 and 17XHD08 from XHD; ZK001-12 from PSC) and one biotite granite (17XHD12 from XHD). Most of the analysed zircons are prismatic (80–400 μm in length and 80–100 μm in width) with well-developed pyramidal faces (Fig. 3a). Most of the CL images show micro-scale oscillatory zoning (Fig. 3a) and exhibit Th/U ratios mostly between 0.1–1 (0.25–0.68, 0.25–0.60, 0.29–1.46 and 0.22–0.87 for samples 17XHD06, 17XHD08, 17XHD12 and ZK001-12, respectively) (online Supplementary Material Table S1) suggesting a magmatic origin for the zircons (Belousova et al. Reference Belousova, Griffin, O’Reilly and Fisher2002). There are also some grains with weak zoning in sample 17XHD08; furthermore, some of them display cores with high U contents, as shown by their very bright CL images (Fig. 3a). The results of the LA-ICP-MS U–Pb zircon analyses for the studied samples are listed in online Supplementary Material Table S1 and illustrated on a concordia plot in Figure 3b–e.
(a) Representative cathodoluminescence images and (b–e) U–Pb concordia diagrams of zircons from the studied granitic rocks. The solid black circles on zircon CL images indicate the locations of U–Pb age sites. Scale bars and circles are 100 and 35 µm, respectively.

Nineteen analyses of zircons from sample 17XHD06 yield a 206Pb–238U single age population of between 430 and 436 Ma, with a weighted mean age of 432.1 ± 2.5 Ma (mean square weighted deviation, MSWD = 0.037) and concordant age of 431.9 ± 2.6 Ma (MSWD = 0.023) (Fig. 3b). Spot 06 (in sample 17XHD06) gives a 206Pb–238U age of 648 Ma, which suggests that some zircons were likely inherited or entrained from the wall rocks during granitic magma emplacement (Fig. 3b; online Supplementary Material Table S1). For zircons from sample 17XHD08, 17 analyses resulted in a weighted mean age and concordant age of 431.7 ± 2.4 Ma (MSWD = 0.03) and 431.7 ± 2.8 Ma (MSWD = 0.028), respectively (Fig. 3c). There are two inherited zircons (spots 06 and 18 in sample 17XHD08) with 206Pb–238U ages of 514 ± 7 Ma and 1600 ± 15 Ma, respectively (online Supplementary Material Table S1). These ages also occur in the core of some grains with a core–rim texture (Fig. 3a). Spot 15 (in sample 17XHD08) yielded a younger 206Pb–238U age of 408 ± 4 Ma, probably caused by its mineral inclusions (Fig. 3a; online Supplementary Material Table S1). Seventeen analyses of zircons from sample 17XHD12 yield a weighted mean 206Pb–238U age of 432.0 ± 2.3 Ma (MSWD = 0.05) and a concordant age of 431.7 ± 3.3 Ma (MSWD = 0.063) (Fig. 3d; online Supplementary Material Table S1). In sample 17XHD12, spots 08 and 09 produced younger 206Pb–238U ages of 383 ± 4 Ma and 423 ± 6 Ma, respectively. These younger ages were probably caused by the high common lead contents of those grains (f206 = 0.65 % for spot 08 and 2.19 % for spot 09) (online Supplementary Material Table S1). Seventeen analyses of zircons from sample ZK001-12 resulted in a weighted mean 206Pb–238U age of 431.9 ± 2.3 Ma (MSWD = 0.046) and concordant age of 431.6 ± 2.4 Ma (MSWD = 0.25) (Fig. 3e; online Supplementary Material Table S1). The age data for two spots (spot 09 and 16) in sample ZK001-12 were deleted owing to their unusual test errors (online Supplementary Material Table S1). Spot 21 (in sample ZK001-12) produced a younger 206Pb–238U age of 424 ± 4 Ma, probably caused by Pb loss (Fig. 3e; online Supplementary Material Table S1). Thus, the consistent U–Pb zircon age data for three samples suggest the XHD and PSC granitic rocks were formed in late early Silurian time (c. 432 Ma).
4.b. Mineral chemistry
Representative electron microprobe analyses of biotite, amphibole, plagioclase, K-feldspar and Fe–Ti oxides from the granodiorites and biotite granites are given in online Supplementary Material Table S2. The in situ trace-element data for the magmatic zircons are presented in online Supplementary Material Table S3.
4.b.1. Biotite
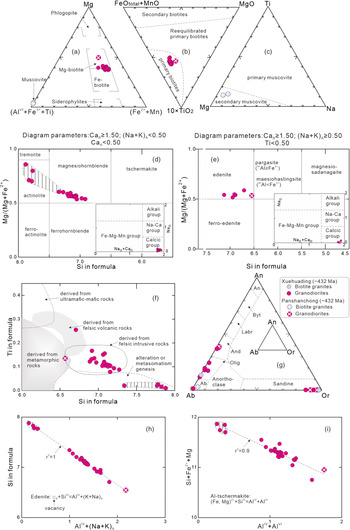
The composition of biotite crystals from the XHD and PSC granodiorites lie within the Mg-biotite to Fe-biotite field based on the classification of Foster (Reference Foster1960) (Fig. 4a), characterized by relatively moderate MgO (9.10–12.07 wt %) and FeOT (17.85–24.07 wt %) contents, with Mg/(Mg + Fe2+) (in atoms per formula unit (apfu)) ranging from 0.44 to 0.60. The 10 × TiO2– (FeO + MnO)–MgO ternary diagram of Nachit et al. (Reference Nachit, Ibhi, Abia and Ohoud2005) was used to discriminate magmatic or primary biotite from secondary or re-equilibrated biotite (Fig. 4b). On this diagram, all of the biotite crystals plot in the field of primary biotite, consistent with their euhedral to subhedral shapes (Fig. 2e–h). In contrast, muscovite crystals in the biotite granite from PSC contain low TiO2 (0.24–0.25 wt %) and high MgO (0.76–0.92 wt %) contents, and plot in the field of secondary muscovite on the diagram of Miller et al. (Reference Miller, Stoddard, Bradfish and Dollase1981) (Fig. 4c).
Compositional data for biotite from the studied granitic rocks on (a) Mg–(Fe2+ + Mn)–(AlVI + Fe3+ + Ti) (apfu) diagram after Foster (Reference Foster1960), and (b) 10 × TiO2–(FeOtotal + MnO)–MgO (wt %) diagram after Nachit et al. (Reference Nachit, Ibhi, Abia and Ohoud2005). (c) Composition of muscovite on the Mg–Ti–Na (apfu) diagram, with the boundary line between secondary and primary micas according to Miller et al. (Reference Miller, Stoddard, Bradfish and Dollase1981). (d, e) NaB + CaB versus NaB diagram (Leake et al. Reference Leake, Woolley, Arps, Birch, Gilbert, Grice, Hawthorn, Kato, Kisch and Krivovichev1997); amphibole compositions are plotted in the calcic group. Mg/(Mg + Fe2+) versus Si (apfu) diagram according to Leake et al. (Reference Leake, Woolley, Arps, Birch, Gilbert, Grice, Hawthorn, Kato, Kisch and Krivovichev1997). (f) Diagram of Ti–Si (apfu) for amphibole classification (after Ma et al. Reference Ma, Yang, Tang and Li1994). (g) Or–Ab–An diagram of feldspar classification (Ab – albite; Or – orthoclase; An – anorthite; Olig – oligoclase; And – andesine; Labr – labradorite; Byt – bytownite). Edenitic and Al–tschermakitic exchange, respectively, on (h) AlIV + (Na + K)A (apfu) versus Si (apfu) and (i) Si + Fe2+ + Mg (apfu) versus AlIV + AlVI (apfu) diagrams (Al’meev et al. Reference Al’meev, Ariskin, Ozerov and Kononkova2002).

4.b.2. Amphibole
The classification of amphiboles is according to the International Mineralogical Association’s classification scheme (Leake et al. Reference Leake, Woolley, Arps, Birch, Gilbert, Grice, Hawthorn, Kato, Kisch and Krivovichev1997). All of the amphiboles in the studied granodiorites belong to the calcic group (CaB (1.70–1.89) > 1.50 apfu) (Fig. 4d, e inset). In the granodiorites from XHD, the amphiboles belong to the magnesiohornblende–actinolite series (with (Na + K)A and Mg/(Mg + Fe2+) (in apfu) ranging from 0.03 to 0.49 and 0.54 to 0.86 apfu, respectively; Fig. 4d) and edenite (with (Na + K)A and Mg/(Mg + Fe2+) ranging from 0.52 to 0.60 and 0.52 to 0.59 apfu; Fig. 4e). The amphibole of the granodiorites from PSC is edenite with (Na + K)A and Mg/(Mg + Fe2+) of around 0.72 and 0.54, respectively (Fig. 4e). Almost all amphibole grains plot in the felsic-magma derived fields, except for a few grains (mostly actinolite, Fig. 4d) that underwent later alteration (Fig. 4f).
4.b.3. Feldspars
The plagioclase grains exhibit euhedral to subhedral shapes and are characterized below in terms of mole fraction of anorthite (AnX). Significant compositional zoning of single crystals has not been observed; however, they show a wide compositional range, including andesine (An36–38), oligoclase (An12–24) and albite (An0–4) (Fig. 4g), related to different stages of crystallization of the host magma. On the whole, the plagioclase grains from the granodiorites show a wide compositional range, while the ones from the biotite granites display lower AnX values (Fig. 4g). All of the K-feldspar grains plot in the field of sanidine, with a composition of Or88–98 (mole fraction of orthoclase, OrX) (Fig. 4g).
4.b.4. Fe–Ti oxides
Representative analyses of Fe–Ti oxides are given in online Supplementary Material Table S2. All of the Fe–Ti oxides show low TiO2 contents (0.25–0.27 wt %) and are mostly magnetite (TiO2 ≤ 5 wt %).
4.b.5. Zircon
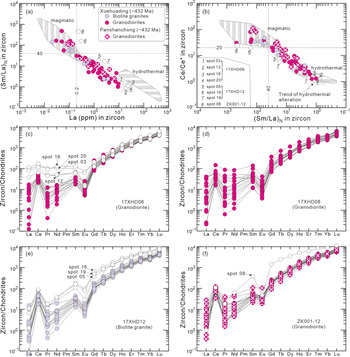
All magmatic zircon crystals exhibit wide variations in composition, ranging from 0.02 to 26.18 (ppm) La contents, 0.9 to 476 (Sm/La)N and 1.2 to 113 Ce/Ce* (online Supplementary Material Table S3). In the discriminant plots for magmatic and hydrothermal zircons from Hoskin (Reference Hoskin2005), all of the studied zircons show a well-marked trend from magmatic to hydrothermal zircon (Fig. 5a, b). Most of the studied zircons exhibit enrichment of heavy REEs (HREEs) relative to light REEs (LREEs), strong positive Ce anomalies and relatively small negative Eu anomalies (Fig. 5c–f). Moreover, the REE patterns of some zircon grains show higher abundances of the REEs, flatter LREE patterns and smaller Ce anomalies of various degrees (Fig. 5c–f). These unusual zircon REE patterns in granitic rocks have been ascribed to the influence of zircon-saturated aqueous fluid (Fig. 5c, e, f; Hoskin, Reference Hoskin2005).
(a, b) Discrimination diagrams for magmatic and hydrothermal zircon, and (c–f) chondrite-normalized REE patterns for magmatic zircon from the studied granitic rocks. (a) (Sm/La)N versus La (ppm). (b) Zircon Ce anomaly (Ce/Ce*) versus (Sm/La)N, (Ce/Ce* = CeN/((LaN × PrN)0.5)). The subscript ‘N’ indicates chondrite-normalized (Sun & McDonough, Reference Sun, McDonough, Saunders and Norry1989). There are some zircon grains (numbered white circles) that deviate from the main evolutionary trend. Moreover, these zircon grains show high abundances of REEs, flatter LREE patterns and smaller Ce anomalies of various degrees, which have been ascribed to the influence of zircon-saturated aqueous fluid (Hoskin, Reference Hoskin2005). (c) Sample 17XHD06. (d) Sample 17XHD08. (e) Sample 17XHD12. (f) Sample ZK001-12.

4.c. Whole-rock major and trace elements
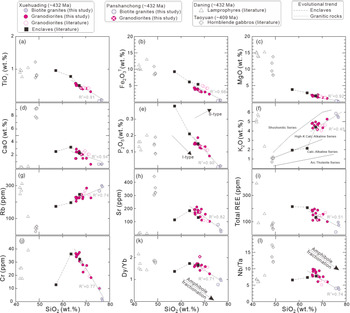
Whole-rock major- and trace-element data of the granitic rocks are provided in online Supplementary Material Table S4, including 11 granodiorites, 2 biotite granites and 3 enclaves (Cheng et al. Reference Cheng, Fu, Xu, Ma, Pang and Cao2009) from XHD, and one granodiorite and one biotite granitic dyke from PSC. All of the major-element contents were normalized to an anhydrous basis. Granitic rocks from XHD and PSC show relatively higher SiO2 and K2O, but lower TiO2, Al2O3, Fe2O3 T, MgO, CaO, P2O5 and MnO than the enclaves (except for one sample) from XHD (Fig. 6). Overall, the studied samples combined with the enclaves show a general trend of decreasing TiO2, Fe2O3 T, MgO and P2O5 with increasing SiO2 (Fig. 6). All of them plot in the field of high-K calc-alkaline rocks (Fig. 6f) on the K2O–SiO2 classification diagram from Peccerillo & Taylor (Reference Peccerillo and Taylor1976).
Whole-rock Harker diagrams of (a–f) major and (g–l) trace elements for the studied granitic rocks. Data sources: Daning lamprophyres (c. 432 Ma) (Jia et al. Reference Jia, Wang and Yang2017); Taoyuan hornblende gabbros (c. 409 Ma) (Zhong et al. Reference Zhong, Ma, Zhang, Wang, She, Liu and Xu2013); previous data for granodiorites and enclaves (Fu et al. Reference Fu, Ma, Xie, Zhang and Peng2004; Cheng et al. Reference Cheng, Fu, Xu, Ma, Pang and Cao2009).

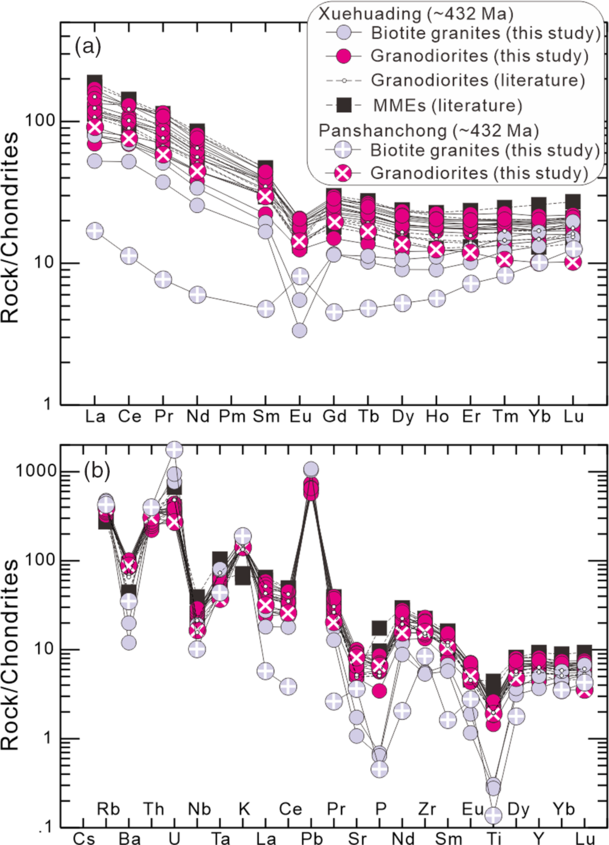
All of the studied granitic samples show fractionated chondrite-normalized (Sun & McDonough, Reference Sun, McDonough, Saunders and Norry1989) REE patterns ((La/Yb)N = 2.86–8.16) with strong negative Eu anomalies (Eu/Eu* = 0.24–0.71) (Fig. 7a), except the biotite granite sample from PSC (~1.50 and 1.76 (La/Yb)N and Eu/Eu*, respectively). The enclaves show similar chondrite-normalized REE patterns to the granodiorites (Fig. 7a). Overall, the granodiorites have relatively flat HREE patterns ((Dy/Yb)N = 0.93–1.50), but there is a concave-upward trend between the medium REEs and HREEs in the biotite granites of XHD ((Dy/Yb)N = 0.70–0.75) and PSC ((Dy/Yb)N ~0.57). Moreover, the biotite granite from PSC shows much lower LREE contents than the other rocks (Fig. 7a). On a primitive mantle-normalized (Sun & McDonough, Reference Sun, McDonough, Saunders and Norry1989) multi-element variation diagram, all studied samples show pronounced negative Nb–Ta, Ti and Sr anomalies and a positive Pb anomaly (Fig. 7b).
(a) Chondrite-normalized (Sun & McDonough, Reference Sun, McDonough, Saunders and Norry1989) rare earth element patterns and (b) primitive mantle-normalized (Sun & McDonough, Reference Sun, McDonough, Saunders and Norry1989) spidergrams for the studied granitic rocks (this study and literature). MMEs – mafic microgranular enclaves. Data sources are as in Figure 6.

4.d. Whole-rock Nd isotopes
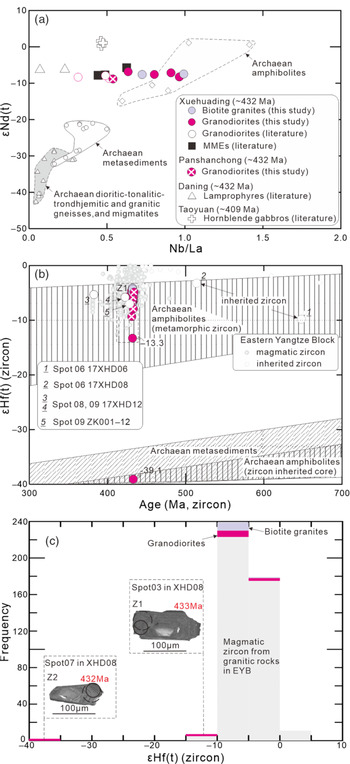
The whole-rock Nd isotope data for the XHD and PSC granitic rocks are reported in online Supplementary Material Table S4. All of the studied granitic rocks have negative ϵNd(t) values (–8.86 to –6.85) similar to their enclaves (–7.85 to –7.73) except for one sample (–5.75); moreover, the values are relatively lower than the contemporary (c. 432 Ma) Daning lamprophyres (–6.32 to –6.26) (Jia et al. Reference Jia, Wang and Yang2017) from the Eastern Yangtze Block (Fig. 8a; online Supplementary Material Table S4). Furthermore, the Nd isotopic ratios of the studied samples are consistent with the Archaean amphibolites (Gao et al. Reference Gao, Ling, Qiu, Lian, Hartmann and Simon1999; Zhang et al. Reference Zhang, Zheng, Wu, Zhao, Gao and Wu2006) from the Yangtze Block (Fig. 8a). However, they are lower than those of Early Devonian (c. 409 Ma) Taoyuan hornblende gabbros (Zhong et al. Reference Zhong, Ma, Zhang, Wang, She, Liu and Xu2013) in the Eastern Yangtze Block (Fig. 8a).
Whole-rock initial Nd and zircon Hf isotope compositions for the studied granitic rocks. (a) ϵNd(t) values versus Nb/La ratios diagram. The data for Archaean amphibolites, metasediments and dioritic–tonalitic–trondhjemitic and granitic gneisses, and migmatites are from Gao et al. (Reference Gao, Ling, Qiu, Lian, Hartmann and Simon1999) and Zhang et al. (Reference Zhang, Zheng, Wu, Zhao, Gao and Wu2006). MMEs – mafic microgranular enclaves. (b) Zircon ϵHf(t) versus U–Pb age (Ma) diagram. (c) Magmatic zircon ϵHf(t) frequency distribution from middle Palaeozoic granitic rocks in the Eastern Yangtze Block. The data for the magmatic zircon ϵHf(t) are from Ou et al. (Reference Ou, Lai, Carvalho, Zi, Kong, Li and Jiang2019). The solid and dashed black circles on the zircon CL images indicate the locations of the U–Pb age and Hf isotope sites, respectively. The zircon Hf isotopic evolution field of the Kongling Archaean amphibolites (metamorphic and inherited core zircon) and the Archaean metasediments are from Zhang et al. (Reference Zhang, Zheng, Wu, Zhao, Gao and Wu2006). Other data sources are as in Figure 6.

4.e. Hf isotopes in zircon
The results of the in situ Hf isotope analyses of the zircons from the studied granitic rocks are provided in online Supplementary Material Table S5, and shown in the diagram of ϵHf(t) values versus U–Pb ages (Fig. 8b). Most of the magmatic (c. 432 Ma) zircon grains have ϵHf(t) values ranging from –13.30 to –4.11 (weighted average –6.10 ± 0.08), except for a grain with a strongly evolved ϵHf(t) value from one granodiorite (–39.08 from spot 07 in sample 17XHD08; Fig. 8b). Two inherited or xenocrystic zircon grains have ϵHf(t) values (–9.83 to –3.25) similar to those of related magmatic zircons, although they show much older U–Pb ages (514–648 Ma; Fig. 8b). Moreover, the zircon grains with relatively younger ages are similar to the magmatic grains, ranging from –6.99 to –5.29 (Fig. 8b). All of the magmatic zircon grains were projected into the evolution field of the Kongling Archaean amphibolites (metamorphic or inherited zircon) (Fig. 8b).
5. Discussion
5.a. Effects of alteration
The presence of abundant secondary minerals such as kaolinite and sericite replacing primary igneous phases (e.g. plagioclase) indicates that the studied granitic rocks experienced alteration, and the abundance of some mobile elements could have been modified (online Supplementary Material File 1), consistent with their variable loss on ignition (LOI) values (0.20–2.86 wt %) (online Supplementary Material Table S4). Thus, the potential effects of these processes have been assessed, and details are shown in online Supplementary Material File 1 and Figure S2. The late alteration is considered to have an insignificant effect on REEs and high-field-strength elements and the Nd isotopic ratios of the studied rocks. Conversely, the alkali metals (such as Na) were likely to have been modified by late alteration. Therefore, these mobile elements are avoided in the discussion below.
5.b. Crystallization conditions of the magma
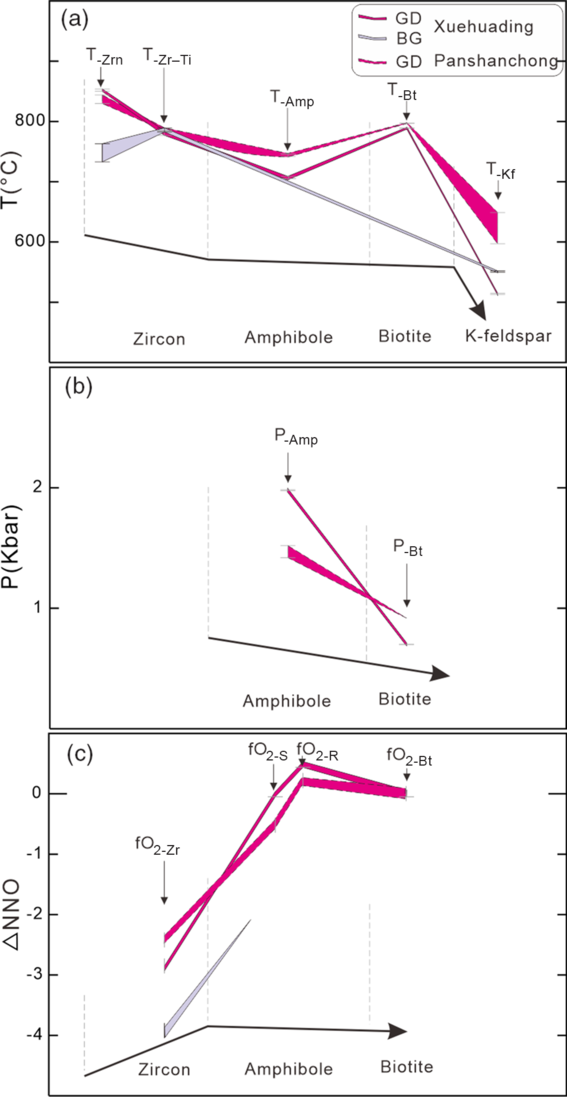
All of the mineral-related physical–chemical results record the conditions of the magma at the time when the corresponding minerals crystallized, and they are listed in online Supplementary Material Tables S3, S4 and S6. The detailed information about how the magma crystallization conditions (T, P, oxygen fugacity and water content) were estimated is listed in online Supplementary Material File 2. All the estimated results indicate that the magma related to the studied granitic rocks experienced a normal evolutionary trend with a crystallization sequence starting with plagioclase, zircon, amphibole and biotite, to K-feldspar (Fig. 9a–c). Moreover, the occurrence of low H2O values in the granodiorite samples (calculated using magmatic amphibole; see H2Omelt in online Supplementary Material Table S6), show that the magma was initially water-undersaturated (Winter, Reference Winter2009, p. 396), and as crystallization proceeded the H2O contents increased (e.g. decreasing P and increasing H2Omelt), finally culminating with the crystallization of amphibole.
Results of mineral crystallization conditions: (a) temperature, (b) pressure and (c) oxygen fugacity.

5.c. Petrogenesis
5.c.1. Origin of the granodiorites and biotite granites
Processes involving the addition of foreign materials, such as mixing between mantle- and crust-derived magmas (Karsli et al. Reference Karsli, Chen, Aydin and Şen2007; Yang et al. Reference Yang, Wu, Wilde and Liu2007 a,b), or crustal assimilation plus fractional crystallization (AFC processes; Preston et al. Reference Preston, Bell and Rogers1998; Clarke & Carruzzo, Reference Clarke and Carruzzo2007; Peate et al. Reference Peate, Barker, Riishuus and Andreasen2008), are unlikely to explain the genesis of the studied granitic rocks. The reasons are listed below. (1) The magmatic zircons in both the granodiorites and biotite granites show similar (Sm/La)N and Ce/Ce* ratios, and evolutionary trend from magmatic to hydrothermal zircons (Fig. 5a, b), which is consistent with evolution in a closed system; the zircons in the different rock units would display various characteristics recording different degrees of mixing if magma mixing had occurred. (2) There is a lack of a good linear compositional trend between the contemporaneous (c. 432 Ma) mafic magmatic rocks and studied granitic rocks (Fig. 6). (3) The absence of relationships between the ϵNd(t) and Nb/La ratios (Fig. 8a) preclude the influence of crustal assimilation (Wang et al. Reference Wang, Li, Jia, Wyman, Tang, Li, Ma, Yang, Jiang and Gou2012).
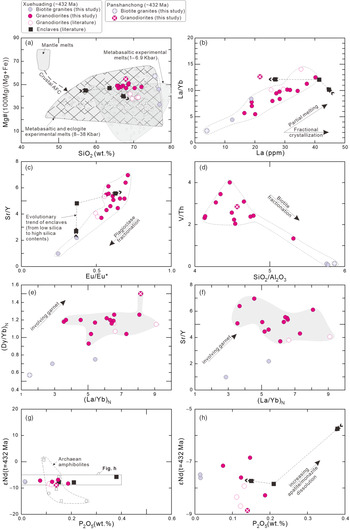
The granitic rocks show marked decreases on the P2O5 versus SiO2 diagram (Fig. 6e). This feature is a key criterion for distinguishing I-type granites from S-type granites owing to their different saturations of apatite (Chappell & White, Reference Chappell and White1992; Li et al. Reference Li, Li, Li, Liu, Yuan, Wei and Qi2007). The I-type granites are mainly derived from igneous sources (e.g. Chappell & Stephens, Reference Chappell and Stephens1988; Li et al. Reference Li, Li, Li, Liu, Yuan, Wei and Qi2007). Moreover, the studied granitic rocks show similar compositions to the melts produced by partial melting of metamafic rocks (e.g. amphibolite or eclogite) at the middle to lower crustal level (Fig. 10a). In addition, all of the studied granitic rocks show single and coherent partial melting trends on the La/Yb versus La diagram (Fig. 10b). Therefore, the granitic rocks (granodiorites and biotite granites) in this study were derived from the same mafic source in the middle to lower crust. This is consistent with their similar REEs patterns, and whole-rock Nd and zircon Hf isotopic data (Figs 7, 8). Moreover, the magmatic zircons in both the granodiorites and biotite granites show similar (Sm/La)N and Ce/Ce* ratios, and evolutionary trend from magmatic to hydrothermal zircons (Fig. 5a, b), which also indicate their similar source. However, if two rock types were derived from an identical source with different partial melting degrees, then the type with lower SiO2 contents would show lower La/Yb ratios, owing to the higher degree of partial melting (e.g. Wang et al. Reference Wang, Xu, Jian, Bao, Zhao, Li, Xiong and Ma2006). Such a scenario is inconsistent with the samples in this study, because granodiorites and biotite granites have the similar La/Yb ratios at the same La content (Fig. 10b). Another possible interpretation is that the biotite granites are the result of fractional crystallization from the granodiorite magma. This is consistent with their evolutionary trend in Harker diagrams (Fig. 6). Moreover, plagioclase has high contents of Eu and Sr yet very low REEs and Y (McKay et al. Reference McKay, Le, Wagstaff and Crozaz1994). Thus, negative Eu anomalies (Fig. 7a) and the positive correlations between Sr/Y ratios and Eu/Eu* (Fig. 10c) indicate plagioclase fractionation from granodiorites to biotite granites. Additionally, the separation of biotite (peraluminous mineral) would increase the SiO2/Al2O3 but lower the V/Th ratios (Kd(V)/Kd(Th) > 1 of biotite; Bea et al. Reference Bea, Pereira and Stroh1994) in residual melts. Hence, the negative correlation between V/Th and SiO2/Al2O3 ratios from the granodiorites to biotite granites (Fig. 10d) suggests biotite fractionation. Therefore, variable degrees of fractional crystallization (amphibole, plagioclase and biotite) can explain the overall geochemical evolution of the studied granodiorites to biotite granites.
(a) Diagram of Mg no. versus SiO2 (wt %). Fields of metabasaltic experimental melts (1–6.9 kbar) (Beard & Lofgren, Reference Beard and Lofgren1991) and metabasaltic and eclogite experimental melts (8–38 kbar) (Sen & Dunn, Reference Sen and Dunn1994; Rapp & Watson, Reference Rapp and Watson1995; Rapp et al. Reference Rapp, Xiao and Shimizu2002; Skjerlie & Douce, Reference Skjerlie and Douce2002) are shown. Model curves of AFC process and mantle melts are after Wang et al. (Reference Wang, Xu, Jian, Bao, Zhao, Li, Xiong and Ma2006). (b) La/Yb versus La (ppm) diagram, presenting a coherent partial melting trend for the studied granitic rocks. (c) Sr/Y versus Eu/Eu* and (d) V/Th versus SiO2/Al2O3 diagram, displaying, respectively, the fractionation trends of plagioclase and biotite. (e) (Dy/Yb)N and (f) Sr/Y versus (La/Yb)N showing role of garnet in fractionating REEs to produce the composition of the studied granitic rocks during partial melting. (g) ϵNd(t = 432 Ma) values versus P2O5 (wt %) and (h) enlarged section, showing the influence of apatite/monazite dissolution (Zeng et al. Reference Zeng, Saleeby and Asimow2005b). Other data sources are as Figure 6.

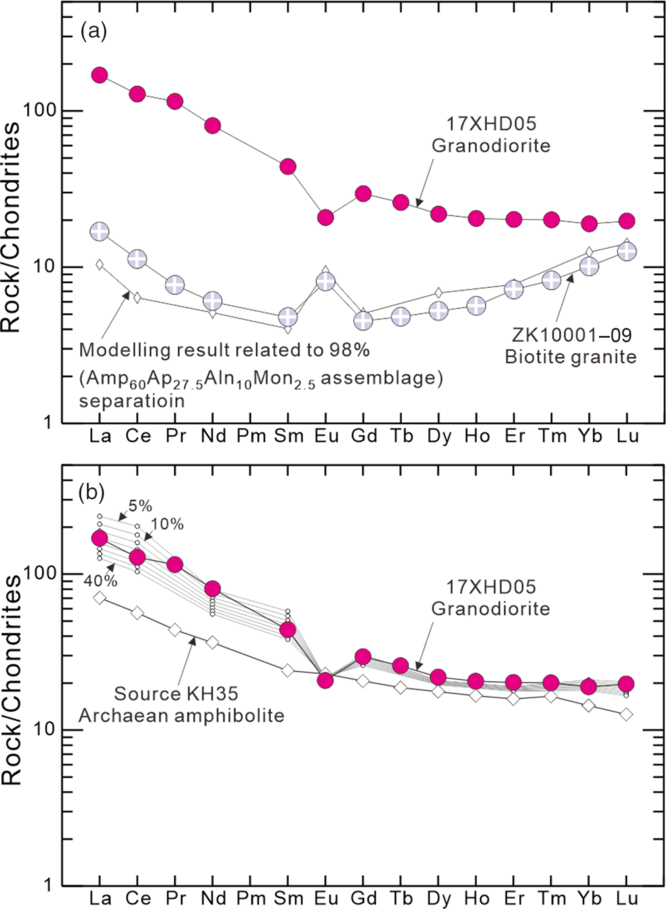
The scanty biotite granite in PSC shows low REE contents and a concave REE pattern (Fig. 7a). Such features are found in highly differentiated rocks affected by hydrothermal fluid–melt interaction (Maruéjol et al. Reference Maruéjol, Cuney and Turpin1990; Wu et al. Reference Wu, Sun, Jahn and Wilde2004; Liu & Zhang, Reference Liu and Zhang2005; Dostal et al. Reference Dostal, Kontak, Gerel, Shellnutt and Fayek2015). This is consistent with the occurrence of hydrothermal zircons in the studied rocks (Fig. 5a, b). Accessory minerals (e.g. apatite, allanite and monazite) control the budget of REEs (Wu et al. Reference Wu, Jahn, Wilde, Lo and Sun2003); therefore, such a trace-element pattern for the biotite granites could also be explained by strong fractionation of accessory minerals (Yang et al. Reference Yang, Wang, Zhang, Dan, Zhang, Qi, Xia and Zhao2018). Moreover, amphibole was not observed in the biotite granites. In order to quantify the role of accessory minerals, we used REE data to model this process. The results are presented in Figure 11a and online Supplementary Material Table S7. As shown in Figure 11a, the concave REE pattern of the biotite granite from PSC can be reproduced by 98 % separation of the mineral assemblage (Amp60Ap27.5Aln10Mon2.5).
REE modelling for the studied granitic rocks. (a) Modelling of formation of concave REE patterns through 98 % fractionation (Amp60Ap27.5Aln10Mon2.5) from primitive granodiorites. Amp – amphibole; Ap – apatite; Aln – allanite; Mon – monazite. (b) Model curves of batch melting of Archaean amphibolite (KH35; Zhang et al. Reference Zhang, Zheng, Wu, Zhao, Gao and Wu2006) and primitive granodiorites (represented by 17XHD05). Symbols and data sources are as in Figure 6.

As discussed above, the primitive magma related to the studied granodiorites was most probably generated by partial melting of metamafic rocks (e.g. amphibolite or eclogite) in the middle to lower crust. At a deeper crustal level, garnet controls partitioning of HREEs and Y between the melt and solid phase during partial melting (Huang & He, Reference Huang and He2010), and can substantially fractionate both the (La/Yb)N and (Dy/Yb)N of magmas (Blundy & Wood, Reference Blundy and Wood1994; Klein et al. Reference Klein, Stosch, Seck and Shimizu2000; Pertermann et al. Reference Pertermann, Hirschmann, Hametner, Günther and Schmidt2004). However, the trace-element signature of the granodiorites does not suggest the presence of garnet in their crustal source (Fig. 10e, f). Moreover, the studied granitic rocks show similar whole-rock Nd and magmatic zircon Hf isotopic data to the Archaean amphiboles from the Kongling Complex, which represents the basement of the Yangtze Block (Gao et al. Reference Gao, Ling, Qiu, Lian, Hartmann and Simon1999; Zhang et al. Reference Zhang, Zheng, Wu, Zhao, Gao and Wu2006). Therefore, the studied granitic rocks were most probably generated by partial melting of amphibolites.
Figure 11b shows the results of the melting model, using REE data to account for primitive granodiorites by partial melting of amphibolites. The results of the modelling show that the primitive granodiorites could be reproduced by 20 % batch melting (Fig. 11b; online Supplementary Material Table S8).
5.c.2. Genesis of the enclaves
Enclaves hosted by the granodiorites in XHD have fine-grained igneous textures (Fig. 2c, d), and a compositional gap with the contemporary mafic rocks in the Eastern Yangtze Block (Fig. 6), thus precluding the possibility of an origin from foreign xenoliths (e.g. country rocks) (e.g. Bacon, Reference Bacon1986; Mass et al. Reference Mass, Nicholls and Legg1997; Xu et al. Reference Xu, Gao, Wang, Wang and Liu2006) and fractional crystallization. The opposite evolutionary trend in some elements or their ratios (e.g. CaO, Dy/Yb and Nb/Ta ratios versus SiO2) (Fig. 6d) between the enclaves and their host granitic rocks cannot be explained by a mixing model (Karsli et al. Reference Karsli, Chen, Aydin and Şen2007; Yang et al. Reference Yang, Wu, Wilde and Liu2007 a,b).
None of models discussed above are applicable to the enclaves in this study. Instead, field observations and petrographic and geochemical data suggest that these enclaves were formed in a dominantly closed system; possible scenarios are discussed below.
The studied enclaves show trace-element compositions similar to their host rocks (Figs 6, 7), and therefore are unlikely to represent restites, which have a complementary composition to their host rocks (e.g. Chappell et al. Reference Chappell, White and Wyborn1987; Chappell & Wyborn, Reference Chappell and Wyborn2012). Crystal settling at the bottom of the magma chamber has been proposed to account for the formation of cognate cumulate enclaves that have mineral assemblages and geochemical and isotopic compositions similar to their host granites (Barbarin & Didier, Reference Barbarin and Didier1992). Mafic minerals in enclaves are considered to be formed at an earlier stage of the same magma system and be similar to their host granitic rocks. However, the enclaves investigated in this study have small and less automorphic mineral grain sizes (Cheng et al. Reference Cheng, Fu, Xu, Ma, Pang and Cao2009) than the cumulate texture with a framework of touching subhedral to euhedral crystals described by Irvine (Reference Irvine1982).
Previous work of Langmuir (Reference Langmuir1989) suggested that magma chamber margins are probable sites of solidification, where heat is lost and thermal and mechanical boundary layers may occur. The term ‘in situ crystallization’ was given in order to distinguish it from the concept of bottom crystallization (Campbell, Reference Campbell1978; Mcbirney & Noyes, Reference Mcbirney and Noyes1979) or the autolith model (Tindle & Pearce, Reference Tindle and Pearce1983; Barbarin & Didier, Reference Barbarin and Didier1992; Schönenberger et al. Reference Schönenberger, Marks, Wagner and Markl2006; Shellnutt et al. Reference Shellnutt, Jahn and Dostal2010). However, enclaves formed from this in situ model always show high mafic mineral concentrations, and some may be up to 50 modal per cent, owing to the continuous heat loss and crystallization (Langmuir, Reference Langmuir1989). Considering this inconsistency, Donaire et al. (Reference Donaire, Pascual, Pin and Duthou2005) suggested that the enclaves most probably form from their host granitic magma by kinetically induced accelerated crystallization of ferromagnesian (mafic) minerals related to rapid cooling when the magma is ascending in the feeding conduits. This interpretation would differ from in situ crystallization because there is no strict constraint on the number of mafic minerals that can be formed in the solidification zone, apart from the availability of elemental contents (Donaire et al. Reference Donaire, Pascual, Pin and Duthou2005). This rapid cooling model has a physicochemical basis in the theory of nucleation (Kirkpatrick, Reference Kirkpatrick1983) and the experiments of Naney & Swanson (Reference Naney and Swanson1980), which suggested that mafic minerals (ino- and phyllosilicates) should nucleate more quickly than the framework silicates (e.g. feldspars and quartz) during the earliest crystallization of a silicate melt.
Accordingly, the enclaves in this study likely formed at the borders of ascending conduits during the granitic magma emplacement, where the mafic mineral crystallization was enhanced by rapid cooling (Naney & Swanson, Reference Naney and Swanson1980; Kirkpatrick, Reference Kirkpatrick1983). In this way, it is easy to explain the two different evolutionary trends of the enclaves and their host granitic rocks on the Harker diagrams (Fig. 6). For instance, the Dy/Yb, Nb/Ta ratios versus SiO2 variations are the direct consequence of the amphibole concentration, owing to a partition coefficient of Kd(Dy)/Kd(Yb) > 1 (Tiepolo et al. Reference Tiepolo, Bottazzi, Foley, Oberti, Vannucci and Zanetti2001) and Kd(Nb)/Kd(Ta) > 1 (Sisson, Reference Sisson1994) in low-Mg amphibole. Similarly, the Cr–SiO2 variations, deviating from the normal differentiation trend, would be caused by the rapid nucleation of amphibole (Kd(Cr) > 1 of amphibole in granitic magma; Sisson, Reference Sisson1994). Moreover, the different variation trends between the enclaves and their host granitic rocks in CaO and Sr versus SiO2 diagrams suggest a compatible behaviour related to plagioclase precipitation, because both Kd(Ca) (Dudas et al. Reference Dudas, Schmitt and Harward1971; Nagasawa & Schnetzler, Reference Nagasawa and Schnetzler1971) and Kd(Sr) (Philpotts & Schnetzler, Reference Philpotts and Schnetzler1970; Dudas et al. Reference Dudas, Schmitt and Harward1971; Nagasawa & Schnetzler, Reference Nagasawa and Schnetzler1971; Ewart et al. Reference Ewart, Bryan and Gill1973; Ewart & Griffin, Reference Ewart and Griffin1994) of plagioclase in granitic magma are greater than one. It should be noted that the framework silicates (e.g. feldspars) also crystallized along with the mafic minerals (amphibole ± biotite) in the rapid cooling zones proposed in this model (Donaire et al. Reference Donaire, Pascual, Pin and Duthou2005); however, crystallization of mafic minerals was enhanced.
5.c.3. The Nd–Hf isotopic heterogeneity
A common interpretation of isotopic variations in granitic plutons or batholiths is mantle-derived magma input (e.g. Yang et al. Reference Yang, Wu, Wilde and Liu2007 a; Shaw & Flood, Reference Shaw and Flood2009; Tang et al. Reference Tang, Wang, Wyman, Li, Zhao and Yang2012). The premise of this interpretation is a homogeneous crustal source under the equilibrium melting process. However, a number of studies have advocated that much of the isotopic variation within the granitic rocks may be a near-source feature, primarily controlled by the source nature and melting conditions (Ayres & Harris, Reference Ayres and Harris1997; Davies & Tommasini, Reference Davies and Tommasini2000; Zeng et al. Reference Zeng, Asimow and Saleeby2005 a,b; Tang et al. Reference Tang, Wang, Shu, Wang, Yang and Gopon2014; Huang et al. Reference Huang, Li, Li and Li2015; Hammerli et al. Reference Hammerli, Kemp, Shimura, Vervoort and Dunkley2018). As discussed above, the studied rocks were produced in a dominantly closed system, and their crustal source is similar to the Archaean amphibolites of the basement of the Yangtze Block. Therefore, the whole-rock Nd and zircon Hf isotopic heterogeneities in the studied rocks are probably inherited from their heterogeneous source or the result of disequilibrium melting processes.
The whole-rock Nd isotope signature of the studied rocks ranges from ϵNd(t) –8.86 to –5.75 (Fig. 8a; online Supplementary Material Table S4). Such variations (exceeding 3 epsilon units) in granitic plutons are commonly attributed to heterogeneities of their crustal sources (e.g. Huang et al. Reference Huang, Li, Li and Li2015). However, the coupling of anatectic reactions and dissolution of accessory phases plays a critical role in regulating the behaviour of the Sm–Nd isotope systems, and consequently generating Nd isotope disequilibrium (e.g. Zeng et al. Reference Zeng, Asimow and Saleeby2005 a,b). Apatite and monazite control the budget of Sm, Nd and P of these rocks (Ayres & Harris, Reference Ayres and Harris1997; Zeng et al. Reference Zeng, Saleeby and Asimow2005 b). In the ϵNd(t) versus P2O5 diagram (Fig. 10g, h), two groups can be observed: one is similar to Archaean amphibolites (assumed source rocks), and the other shows obviously higher ϵNd(t) and P2O5 values than the former. Therefore, enhanced dissolution of apatite or monazite into the melts is likely to have resulted in higher ϵNd(t) and P2O5 values during the disequilibrium melting processes (Zeng et al. Reference Zeng, Saleeby and Asimow2005 b).
The magmatic zircon ϵHf(t) values of the studied rocks range from –13.30 to –4.11 with a unimodal distribution (Z1), except for one outlier (Z2) of c. –39.08 (Fig. 8c). Zircons from the source (Archaean amphibolites) of the studied rocks have rim and core hafnium isotope ratios (ϵHf(t = 432 Ma)) similar to the values of Z1 and Z2, respectively (Fig. 8b). Zircon is a ubiquitous Hf-enriched mineral in the continental crust (Tang et al. Reference Tang, Wang, Shu, Wang, Yang and Gopon2014). Therefore, in crustal sources, dissolution of zircons strongly controls the release of Hf into the melt. If Hf diffusivity of zircon in the crustal source is not rapid enough to reach equilibrium, the Hf isotope composition of the melt will be highly sensitive to the zircon dissolution rate during crustal anatexis (Flowerdew et al. Reference Flowerdew, Millar, Vaughan, Horstwood and Fanning2006; Farina et al. Reference Farina, Stevens, Gerdes and Frei2014; Tang et al. Reference Tang, Wang, Shu, Wang, Yang and Gopon2014). Thus, the variation in 176Hf/177Hf ratios within the studied magmatic zircons from grain to grain indicates a variable zircon dissolution rate in the same magma source.
As discussed above, the Nd–Hf isotopic heterogeneity of the studied samples was not only controlled by their heterogeneous source but was also influenced by the disequilibrium melting process.
5.d. Implications
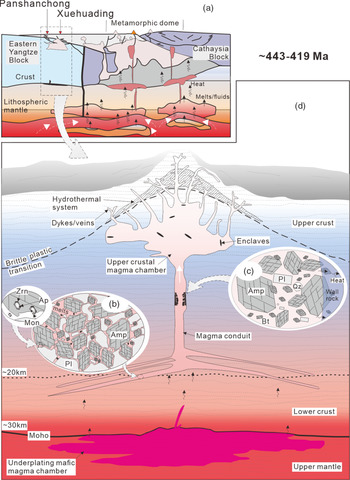
Our data suggest that the studied granitic rocks were mostly generated by partial melting of a metamafic source in the middle to lower crust and fractional crystallization without mantle-derived magma input (i.e. closed system). The related enclaves were formed at the margins of ascending conduits during the granitic magma emplacement. The detailed process is outlined in Figure 12 based on previous studies (e.g. Ou et al. Reference Ou, Lai, Carvalho, Zi, Kong, Li and Jiang2019). In response to shortening and thickening of the crust in middle Palaeozoic time (pre-443 Ma) (Wan et al. Reference Wan, Liu, Wilde, Cao, Chen, Dong, Song and Du2010; Wang et al. Reference Wang, Zhang, Fan, Zhao, Zhang, Zhang, Zhang and Li2011), a thickened lithospheric root was formed in the eastern SCB (Wang et al. Reference Wang, Zhang, Fan, Zhang and Zhang2013 b; Peng et al. Reference Peng, Fan, Zhao, Peng, Xia and Mao2015). The subsequent tectonic collapse of the lithospheric mantle at the magmatic age peak (c. 443–419 Ma; Wang et al. Reference Wang, Zhang, Fan, Zhang and Zhang2013 b; Ou et al. Reference Ou, Lai, Carvalho, Zi, Kong, Li and Jiang2019) would have caused the upwelling of the asthenosphere and raised the overall thermal budget of the lithosphere. Our previous study has shown that the thickened lithospheric root was delaminated into the asthenospheric mantle as many independent parts below the metamorphic domes in the Cathaysia Block (Ou et al. Reference Ou, Lai, Carvalho, Zi, Kong, Li and Jiang2019). This process is in agreement with a gravitational convective instability model with a slow foundering rate and piecemeal removal of the lithospheric root (Houseman & Molnar, Reference Houseman and Molnar1997; Drew et al. Reference Drew, Ducea and Schoenbohm2009), instead of a rapid removal (Bird, Reference Bird1979). During the repeated loss of the lithospheric root, continuous upwelling of the asthenosphere and emplacement of mafic magma at the base of the crust provided enough heat to the surrounding metamorphic domes (Fig. 12a). As a consequence, the Archaean amphibolites in the basement of the Yangtze Block underwent partial melting. The repeated thermal upwelling likely produced different batches of melts and resulted in the disequilibrium melting (Fig. 12b). Owing to such thermal disturbance, the simultaneous rate of mineral dissolution and isotopic equilibrium between the melt and residue was unable to be reached. In the relatively early stage, the enclaves formed at the borders of ascending conduits by rapid cooling in these zones (Fig. 12c), and were incorporated later into the granodioritic magma as partially solidified bodies during magma emplacement (e.g. Donaire et al. Reference Donaire, Pascual, Pin and Duthou2005) (Fig. 12d). In this process, there is no thermal contrast between the enclaves–host rock, which is consistent with the lack of fine-grained chilled margins (Fig. 2c, d) in the studied enclaves. Moreover, there are some feldspar crystals that cross the boundaries into the enclaves (Fig. 2c, d), showing evidence of local, second-order mingling processes between the enclaves and host rocks (Fig. 12d). Accompanying the formation of the enclaves and the granodiorites, the biotite granites were generated through fractional crystallization from the granodiorite magma. One example of a biotite granite with a concave REE pattern probably resulted from a greater separation of accessory minerals and/or influence of hydrothermal fluid–melt interaction (Fig. 12d).
Schematic depiction of the crustal source disequilibrium melting and rapid cooling model related to the studied granitic rocks after Donaire et al. (Reference Donaire, Pascual, Pin and Duthou2005). (a) At 443–419 Ma, the repeated loss of the thickened lithospheric root and subsequent thermal upwelling in the SCB after Ou et al. (Reference Ou, Lai, Carvalho, Zi, Kong, Li and Jiang2019). (b) Early stages of melt generation from the disequilibrium melting of heterogeneous amphibolites in the middle–lower crust with variable rates of mineral dissolution/growth. (c) The incipient enclaves as totally or partially solidified bodies have formed at the borders of ascending conduits at a relatively early stage owing to the rapid cooling in these zones, and (d) later become incorporated into the primitive granodioritic magma during the magma emplacement (Donaire et al. Reference Donaire, Pascual, Pin and Duthou2005). (d) Deeper magma bodies emplaced in low-porosity crust may lose heat mainly by conduction, whereas at shallower levels hydrothermal fluid–melt interaction may be more significant (Spera & Bohrson, Reference Spera and Bohrson2004).

The recognition of rapid cooling in the formation of enclaves has a great significance in understanding the formation of the massive felsic batholith in the granitic province of the SCB, where mafic rocks represent only a minor component. This process has been verified by a series of experiments (Naney & Swanson, Reference Naney and Swanson1980; Kirkpatrick, Reference Kirkpatrick1983) and the exposure of magma conduits with the aggregation of fine-grained mafic minerals (Donaire et al. Reference Donaire, Pascual, Pin and Duthou2005). Some previous studies continuously tried to emphasize the role of mafic magma in the petrogenesis of enclaves and their host rocks through magma-mixing processes (e.g. Karsli et al. Reference Karsli, Chen, Aydin and Şen2007; Yang et al. Reference Yang, Wu, Wilde, Xie, Yang and Liu2007 b; Zhang et al. Reference Zhang, Wang, Castro, Zhang, Shi, Tong, Zhang, Guo, Yang and Iaccheri2016). However, the low ratio of mafic and granitic rocks in the exposed area and the lack of disequilibrium features of the minerals (e.g. core–rim textures) in the studied rocks are inconsistent with the magma-mixing process. In addition, the magma related to the studied granitic rocks experienced a normal evolutionary trend without abnormal perturbation of physicochemical conditions, thereby ruling out the magma-mixing process. The combination of Nd–Hf isotopic data with the mineral composition, whole-rock major and trace elements, and the different evolutionary trends between the enclaves and their host rocks provides robust evidence to identify the rapid cooling process and to determine their sources were without any direct mantle material contribution in the Eastern Yangtze Block. Moreover, the rapid cooling model could be applied to other massive felsic batholiths with similar microgranular enclaves/host rock relationships, especially where distinctive evidence (isotopic, mineralogical and textural aspects) for magma mixing is absent.
6. Conclusions
-
(1) LA-ICP-MS zircon U–Pb dating shows that the host rocks (granodiorites and biotite granites) in the Xuehuading–Panshanchong area of the Eastern Yangtze Block were generated during middle Palaeozoic time (c. 432 Ma).
-
(2) Enclaves (previous data and our investigation) and host rocks in the studied area have similar mineral assemblages, trace elements and isotopic compositions.
-
(3) The granodiorites were most likely generated by disequilibrium partial melting of the Archaean heterogeneous amphibolites of the basement of Yangtze Block in the middle to lower crust. The biotite granites were the product of granodioritic magma through fractional crystallization.
-
(4) The enclaves would have formed at the borders of ascending conduits during the granitic magma emplacement, where the mafic mineral crystallization was enhanced by rapid cooling compared to normal crystallization.
-
(5) The piecemeal removal of the lithospheric root in middle Palaeozoic time provided repeated thermal disturbance to the crustal source of the Eastern Yangtze Block, west of the metamorphic domes in the Cathaysia Block, without direct mantle magma contribution to the granites.
Acknowledgements
We would like to thank Executive Editor Kathryn Goodenough and three anonymous reviewers for their constructive and helpful reviews. Presented data are available by request from the corresponding authors. Wen-Zhou Xiao, Ri-Jun Du, Ye Liu, Shuang-Lian Li, Chao-Yun Liu, Jun-Wei Xu, Meng-Zhao Li, Chang-Ming Xing, Hong-Xia Yu, Lan-Fang Xie, Yong-Hai Yuan, Jia-Cai Li and Liang Li are thanked for their assistance with field and laboratory work. Qi-Wei Li and Zong-Yong Yang are thanked for their many discussions about the basement of the Yangtze Block, concave REE patterns and so on. Financial support for this research was provided by the National Key R & D Programme of China (No. 2017YFC0602402), the National Natural Science Foundation of China (No. 41802057), the Provincial Natural Science Foundation of Hunan (No. 2019JJ50831), the China Postdoctoral Science Foundation (No. 2017M622597), the Funded by Open Research Fund Programme of the Key Laboratory of Metallogenic Prediction of Nonferrous Metals and Geological Environment Monitoring (Central South University), Ministry of Education (No. 2018YSJS07), the research grant from the State Key Laboratory of Isotope Geochemistry, Guangzhou Institute of Geochemistry, Chinese Academy of Sciences (SKLabIG–KF–18–05), and the National Science and Technology Major Project “Study of Proterozoic tectonic-lithofacies palaeogeography in Sichuan Basin” (No. 2017ZX05008005009). B.B.C. is thankful to Cariparo and MIUR (Ministero dell’ Istruzione, dell’Università e della Ricerca) for the award of postdoctoral grants (Makearth and PNRA18_00103).
Supplementary material
To view supplementary material for this article, please visit https://doi.org/10.1017/S0016756820001144.