Introduction
The consideration of parasites as important components of their ecosystems has seen a progressive increase during the past decade (Hatcher et al., Reference Hatcher, Dick and Dunn2012; Kéfi et al., Reference Kéfi, Berlow, Wieters, Navarrete, Petchey, Wood, Boit, Joppa, Lafferty, Williams, Martinez, Menge, Blachette, Iles and Brose2012). Parasites, as consumers, modify food-web structures by increasing food-chain length and the number of links, which influence the structure and stability of food webs (Kuris et al., Reference Kuris, Hechinger, Shaw, Whitney, Aguirre-Macedo, Boch, Dobson, Dunham, Fredensborg, Huspeni, Lorda, Mababa, Mancini, Mora, Pickering, Talhouk, Torchin and Lafferty2008; Lafferty et al., Reference Lafferty, Allesina, Arim, Briggs, de Leo, Dobson, Dunne, Johnson, Kuris, Marcogliese, Martinez, Memmott, Marquet, McLaughlin, Mordecai, Pascual, Poulin and Thieltges2008). One of the major limitations of including parasites in models of food webs is the scarcity of accurate information on their feeding habits, mainly due to the difficulty of applying conventional methodologies such as the analysis of the digestive tract. This aspect is especially limiting for tapeworms, as they are organisms without digestive tracts and feed by absorbing the nutrients directly from the host. For tapeworms, the use of intrinsic markers such as the stable isotopes of nitrogen (15N/14N, denoted as δ15N) and carbon (13C/12C, denoted as δ13C) is an alternative and useful methodology to determine trophic position, trophic habits and host–parasite relationships (Doucett et al., Reference Doucett, Giberson and Power1999; Butterworth et al., Reference Butterworth, Li and McKinley2004).
Stable isotope analysis, which is especially advantageous when investigating the feeding ecology of parasites, provides information on assimilated food (not just ingested food), as well as time-integrated information (Layman et al., Reference Layman, Araújo, Boucek, Hammerschlag-Peyer, Harrison, Jud, Matich, Rosenblatt, Vaudo, Yeager, Post and Bearhop2012). This approach is based on δ15N and δ13C values being transformed from dietary sources to consumers in a predictable manner (Layman et al., Reference Layman, Araújo, Boucek, Hammerschlag-Peyer, Harrison, Jud, Matich, Rosenblatt, Vaudo, Yeager, Post and Bearhop2012). δ15N values are indicators of trophic positions as consumers are predictably enriched in δ15N relative to their food (Post, Reference Post2002). δ13C values show little change with trophic transfers, but are useful indicators of the dietary source of carbon (De Niro & Epstein, Reference de Niro and Epstein1981).
However, the use of stable isotope analysis to accurately investigate trophic relationships is limited by the correct knowledge and application of the isotopic discrimination values (ID) specific for the studied consumer–prey relationships. ID is the amount of change in isotope ratios as isotopes are incorporated from prey into the consumers' tissue, usually 3–4‰ and 0–1‰ for δ15N and δ13C, respectively. The importance of using a correct ID is crucial to avoid a biased interpretation of the isotopic results (Wolf et al., Reference Wolf, Carleton and Martínez2009).
Although much work has been done to determine ID values of different groups of organisms over the past decade, and to study the factors that could influence their variation within and among species (Caut et al., Reference Caut, Angulo and Courchamp2009), information on ID in parasite–host systems is still very scarce (Dubois et al., Reference Dubois, Savoye, Sauriau, Billy, Martinez and de Montaudouin2009). General findings suggest that, in comparison to the conventional positive enrichment in consumers (Caut et al., Reference Caut, Angulo and Courchamp2009), endoparasites apparently have depleted N and C isotopic values in comparison to those of their hosts, resulting in negative ID values for this group of parasites (Pinnegar et al., Reference Pinnegar, Campbell and Polunin2001; Persson et al., Reference Persson, Larsson and Stenroth2007; Dubois et al., Reference Dubois, Savoye, Sauriau, Billy, Martinez and de Montaudouin2009; but see Doucett et al., Reference Doucett, Giberson and Power1999).
The Gyrocotylidea is one of the most basal groups of tapeworms, with a unique monozoic body. The group is poorly studied and is specific to holocephalan chimaeroid fish, with high prevalence of infection being recorded (Bandoni & Brooks, Reference Bandoni and Brooks1987; Williams et al., 1987; Bristow, Reference Bristow1992). As in other tapeworms, gyrocotylids lack an intestine and feed directly on nutrients of the host by using their surfaces, which are covered by microtiches (Poddubnaya et al., Reference Poddubnaya, Bruňanská, Kuchta and Scholz2006). Hence, the determination of intestinal contents is not possible using conventional methodology. Therefore this host–parasite system is a most suitable model for using stable isotopes to study feeding ecology. To our knowledge, no data are available on values of stable isotopes in this gyrocotylean tapeworm, nor on the ID between the species Gyrocotyle urna and its fish host.
In the present study we provide the first estimation of ID values between a gyrocotylidean tapeworm (G. urna) and its main host, the holocephalan Chimaera monstrosa. ID values may be influenced by aspects directly related to the quality of the resources consumed by the consumer (i.e. Pearson et al., Reference Pearson, Levey, Greenberg and Martínez del Rio2003; Robbins et al., 2005; Dubois et al., 2009) which, in this case, is directly determined by the nutritional state of the host. For this reason, we also tested the effect of three important parameters directly related to the nutritional state of the host (host size, host sex and parasite intensity) on ID values, and we illustrate how the trophic relationships of C. monstrosa and G. urna could vary by applying different ID values.
Materials and methods
Sampling procedures and isotopic analysis
In July 2011, 15 specimens of C. monstrosa were collected at depths ranging from 511 to 571 m by Spanish bottom trawlers fishing in the Gulf of Lions, NW Mediterranean (42°36′N, 3°39′E). Following capture, each C. monstrosa was immediately frozen and stored at − 20°C.
In the laboratory, the body weight (kg), length (cm) and sex of each fish was recorded. Following dissection of the stomach and spiral valve, the number of tapeworms was recorded to determine the prevalence and intensity of infection. From each host, a single tapeworm and a small portion of host muscle were collected for the determination of stable isotope values. All tapeworms collected were identified as G. urna (Williams et al., Reference Williams, Colin and Halvorsen1987).
All samples (G. urna and muscle from C. monstrosa) were freeze-dried, powdered and 0.9–1.0 mg of each sample was packed into tin capsules. Stable isotope analyses were performed at the Laboratory of Stable Isotopes at the Estación Biológica de Doñana (www.ebd.csic.es/lie/index.html). All samples were combusted at 1020°C using a continuous-flow isotope-ratio mass spectrometry system (Thermo Electron, Thermo Fisher Scientific, Bremen, Germany), Flasj HT elemental analyser (Thermo Fisher Scientific) and Delta V Advantage mass spectrometer (Thermo Fisher Scientific). All isotope abundances are expressed in δ-notation as parts per thousand (‰) deviation from the International Atomic Energy Agency (IAEA) standards air (AIR; δ15N) and Vienna pee dee belemnite standard (VPDB; δ13C). Based on laboratory standards, the measurement error was ± 0.2 and ± 0.1 for δ15N and δ13C, respectively. IDs (Δδ15N and Δδ13C) were calculated as the difference between δ15N and δ13C values of each individual parasite and its host.
Data analysis
We used non-independent Student's t-tests to examine if the values of δ15N and δ13C differed between C. monstrosa and G. urna. The effects of host body weight and length on ID values were analysed using Pearson correlation tests. The potential effects of the host sex and parasite intensity on the ID were also tested using Student's t-tests. All analyses were conducted in SPSS 18.0 software (SPSS, Inc., Chicago, Illinois, USA) and results were expressed as means ± standard deviation and significant levels of differences set at P≤ 0.05.
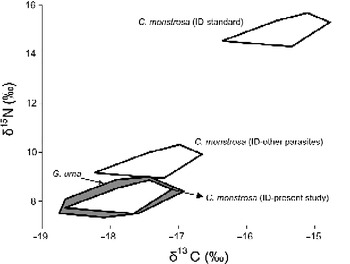
To ensure the accuracy of ID values we estimated and represented the isotopic space of the parasite (G. urna) and the host (C. monstrosa) at different potential ID values: ID-standard (Δδ15N = 3.5‰ and Δδ13C = 1‰), ID from previous parasite studies (Δδ15N = − 1.9‰ and Δδ13C = − 0.9‰; Pinnegar et al., Reference Pinnegar, Campbell and Polunin2001) and the ID estimated in the present study (see table 1). The isotopic space of the host was represented by a convex-hull polygon for all C. monstrosa individuals. A convex-hull polygon is the total area encompassed by the smallest convex polygon containing these individuals in δ15N and δ13C niche dimensions (Layman et al., Reference Layman, Arrington, Montaña and Post2007). The convex-hull areas were calculated using the Animal Movement Extension in ArcView GIS 3.3 (ESRI, Redlands, California, USA). Additional information on the application of convex hulls in ecological studies is given by Cornwell et al. (Reference Cornwell, Schwilk and Ackerly2006) and Layman et al. (Reference Layman, Arrington, Montaña and Post2007).
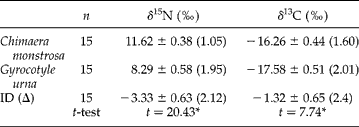
Mean ± SD (and range) of δ15N and δ13C and isotopic discrimination (ID) values of the host Chimaera monstrosa and the tapeworm Gyrocotyle urna.

* Significant values at P< 0.0001.
Results and discussion
The tapeworm G. urna was recorded in the spiral valve of all 15 C. monstrosa individuals examined, with intensities of 2.0 and 1.0 individual in 81.25 and 18.75% of fish, respectively. These values are the first data of intensity and prevalence of G. urna reported for the Mediterranean Sea, and show values similar to those reported previously in other marine systems of the North Sea coast of Norway (Dienske, Reference Dienske1968; Halvorsen & Williams, Reference Halvorsen and Williams1968; Williams et al., Reference Williams, Colin and Halvorsen1987; Bristow, Reference Bristow1992). The gyrocotylideans tend to occur in pairs, are protoandric, and are believed to act as a reproductive unit. The prevalence of infection tends to increase rapidly to 100% in fish with body lengths in the range of 35–50 cm, but then decreasing to 70% in larger-sized fishes (Dienske, Reference Dienske1968; Halvorsen & Williams, Reference Halvorsen and Williams1968).
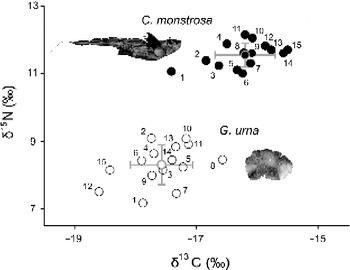
Gyrocotyle urna showed significantly lower δ15N and δ13C values than C. monstrosa, presenting a negative ID (mean and standard deviation) of − 3.33 ± 0.63‰ for δ15N and − 1.32 ± 0.65‰ for δ13C (fig. 1, table 1). Furthermore, neither fish body size, sex nor parasite prevalence had a significant effect on the ID values. Both male and female C. monstrosa showed similar IDs for δ15N (males: n= 8, Δδ15N = − 3.29 ± 0.63‰; females: n= 7, Δδ15N = − 3.37 ± 0.67‰; t= 0.21, P= 0.83) and δ13C (males: n= 8, Δδ13C = − 1.17 ± 0.43‰; females: n= 7, Δδ13C = − 1.47 ± 0.85‰; t= 0.86, P= 0.41). Similarly, host parasite intensity did not affect the IDs for δ15N (C. monstrosa with parasite intensity = 1; n= 3, Δδ15N = − 3.22 ± 0.83‰; C. monstrosa with parasite intensity = 2: n= 12, Δδ15N = − 3.35 ± 0.61‰; t= 0.29, P= 0.75) and δ13C (C. monstrosa with parasite intensity = 1; n= 3, Δδ13C = − 0.92 ± 0.46‰; C. monstrosa with parasite intensity = 2: n= 12, Δδ13C = − 1.41 ± 0.67‰; t= 1.17, P= 0.26). Neither body length (mean = 22.67 ± 2.31 cm, n= 15) nor body weight (mean = 0.85 ± 0.25 kg, n= 15) of C. monstrosa influenced the ID values of δ15N (body length: r= 0.42, P= 0.12; body weight: r= 0.32, P= 0.24) or of δ13C (body length: r= 0.35, P= 0.19; body weight: r= 0.07, P= 0.81).
Individual and mean ± SD δ15N and δ13C values of the parasite G. urna and its host C. monstrosa. The numbers indicate each parasite and its host at the individual level.

Negative values of ID of δ15N and δ13C are in agreement with values previously reported for other parasites of fish, including trematodes (Iken et al., Reference Iken, Brey, Wand, Voigt and Junghans2001), nematodes (Iken et al., Reference Iken, Brey, Wand, Voigt and Junghans2001) and cestodes (Pinnegar et al., Reference Pinnegar, Campbell and Polunin2001; Power & Klein, Reference Power and Klein2004), but in contrast to the common positive ID values reported between predators and prey (Caut et al., Reference Caut, Angulo and Courchamp2009). Different explanations related to parasite physiology have been proposed to explain the depletion in the isotopic values between endoparasites and their hosts. For example, one potential explanation of depleted N is the ability of some endoparasites to use ammonia excreted from host tissues (which contains a higher proportion of the light isotope 14N) for amino acid synthesis, via a reversal of the glutamate dehydrogenase reaction (Barrett, Reference Barrett1981; Pinnegar et al., Reference Pinnegar, Campbell and Polunin2001). Alternative explanations include a differential selection of isotopic-depleted amino acids from the host (Hare et al., Reference Hare, Fogel, Stafford, Mitchell and Hoering1991). Large excesses of substrates and products sometimes result in the formation of complexes, which inhibit transamination (Boyer et al., Reference Boyer, Lardy and Myraback1962), the process responsible for δ15N trophic enrichment (Macko et al., Reference Macko, Estep, Engel and Hare1986). The negative ID of δ13C between G. urna and C. monstrosa could be related to the lipid content of G. urna (Berland et al., Reference Berland, Bristow and Grahl-Nielsen1990) since lipid-rich tissues are known to be 13C depleted (Focken & Becker, Reference Focken and Becker1998), and thereby show lower values of δ13C compared to the less lipid-rich muscle of C. monstrosa.
The need to use adequate ID in food-web studies is pivotal to a correct interpretation of food-web results (Wolf et al., Reference Wolf, Carleton and Martínez2009). This was apparent when we compared the specific ID values versus different surrogates of ID in our parasite–host system (fig. 2). By using the ID values estimated in the present study, the isotopic space of C. monstrosa clearly overlapped with that occupied by G. urna, indicating that the parasite mainly consumes the host tissue (fig. 2). However, when standard ID of predator–prey systems (Δδ15N = 3.5‰ and Δδ13C = 1‰) were used, and ID values for other parasite–host systems (Pinnegar et al., Reference Pinnegar, Campbell and Polunin2001), results indicated that the isotopic space covered by C. monstrosa did not match that of G. urna, suggesting that the parasite is not feeding on its host. Therefore the correct estimation of ID values for specific host–parasite systems is essential in correctly interpreting food-web dynamics that involve parasites.
Isotopic space (convex-hull polygon) of the parasite G. urna (grey area) and host C. monstrosa (white area) with different ID values (ID-standard: Δδ15N = 3.5‰ and Δδ13C = 1‰; ID-other parasites: Δδ15N = − 1.9‰ and Δδ13C = − 0.9‰; ID-present study: Δδ15N = − 3.33‰ and Δδ13C = − 1.32‰).

In conclusion, we report the first data on ID values of δ15N and δ13C between a gyrocotylid tapeworm (G. urna) and its specific host C. monstrosa. As in other studies, the ID was negative for both isotopic values of N and C. Moreover, by comparing the specific ID obtained here with ID from other studies we have clearly demonstrated the importance of using specific ID in host–parasite systems to avoid potential errors in the interpretation of the results when surrogate values from similar systems or parasites are used.
Acknowledgements
We thank Isabel Palomera for encouraging this study. Ricardo Álvarez helped in the stable isotope analysis. Claudio Barria provided the Chimaera picture of fig. 2. J.N. and M.C. were supported by research contracts of the Juan de la Cierva program and Ramon y Cajal (Spanish Ministry of Economy and Competitiveness), respectively.