Background
The survey of estuarine archaeological sites poses particular technical challenges, but offers the reward of well-preserved evidence that can improve our understanding of how estuaries were used and managed in the past. Terrestrial laser scanning (TLS) has been used to record artefacts ranging from waterlogged wooden stakes to boats and archaeological structures (English Heritage 2011; Lobb et al. Reference Lobb, Krawiec, Howard, Gearey and Chapman2010; Tanner Reference Tanner, Breen and Forsythe2013). The use of TLS has not yet, however, achieved its full potential, as it can provide highly accurate 3D models to record excavations, and can be used to address questions of site function through environmental modelling. Here, we show how TLS offers a step-change in the recording and understanding of fixed fishing and associated structures through in situ recording, landscape analysis and modelling. The inter-tidal environment is particularly challenging for the employment of conventional methods of survey and excavation, but also represents the most threatened archaeological zone worldwide (Pontee & Parsons Reference Pontee and Parsons2010). Furthermore, structures and artefacts typically found in the coastal zone, such as fixed fishing structures (e.g. fish weirs and basket racks) and tide mills, have long histories, about which we have very limited knowledge (Jecock Reference Jecock2011). Coastal erosion often exposes these structures, necessitating recording (e.g. Rapid Coastal Zone Surveys in the UK), but rarely resulting in excavation.
Fixed fishing structures (or mass fish-capture devices) and tide mills are particularly valuable, as they provide information on past wood technologies, fish processing and storage, environmental awareness, cultural beliefs, delayed-return economics and social organisation. Their presence is also connected to environmental factors, including relative sea level, river discharges, storminess and fish populations. These structures should not, therefore, be considered in isolation; they require setting within their environmental or sea/landscape context. Several recent coastal surveys have targeted fixed fishing structures along the Shannon Estuary in Ireland (O'Sullivan Reference O'Sullivan2005a), and in Wales, England, Brittany and Normandy (O'Sullivan Reference O'Sullivan2005a; Langouët & Daire Reference Langouët and Daire2009; Moore-Scott Reference Moore-Scott2009; Brown et al. Reference Brown, Turner and Pearson2010; Royall Reference Royall2013; Billard & Bernard Reference Billard and Bernard2016; Cooper et al. Reference Cooper, Caira, Opdebeeck, Papadopoulou and Tsiairis2017). The aim of each of these surveys was to assess how fixed fishing structures worked and to test the hypothesis that they could have been used collectively as an integrated system of estuarine exploitation. The aim of the following study was to apply a similar approach to the landscape of the Léguer Estuary in Brittany through the use of terrestrial laser scanning.
The sites in the lower Léguer Estuary
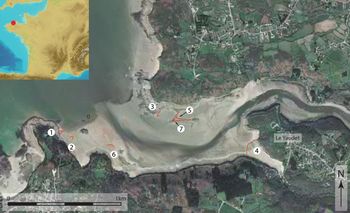
The sites are all located within the estuary of the Léguer River, 5km west of Lannion, Brittany (Figure 1). The Léguer is 61km long, 9km of which is tidal. The river discharges to the west into the Bay of Lannion, which is sheltered from the stronger currents of the Channel to the north. Downstream of the Le Yaudet promontory, the estuary widens significantly, and it is here that the majority of inter-tidal structures are located. Enclosing the Baie de la Vierge is a large curved wall. Known as ‘Le Mur du Pêcherie’ (‘the Wall of the Fishery’), it has also been interpreted as a tide mill (Cunliffe & Galliou Reference Cunliffe and Galliou2004). Most of the tide mills in France are located in the Brittany region. In 2016, a new inventory was completed, identifying a total of 140 tide mills from archaeological and historical records (accessible at: http://patrimoine.bzh/gertrude-diffusion/dossier/les-moulins-a-maree-de-bretagne/19934f6b-e5d4-42a0-ba6d-ec8b00638295). A large line of rectangular stones is located to the west of the Baie de la Vierge, located at the higher end of the tidal range. Farther to the west, the short, curved line of stones at Poull Mad Dogan has been tentatively identified as a fishing weir (Langouët pers. comm.; Figure 1.6), as have two further V-shaped ‘weirs’ to the west at Dourven (Figure 1.1–2). The large V-shaped structures at ‘Le Petit Taureau’, along the right (north) bank of the river, were excavated in 2012 and 2013 by Daire and Langouët.
Intertidal structures in the Léguer Estuary: 1) Dourven-A; 2) Dourven-B; 3) Corps de Garde; 4) Baie de la Vierge and the ‘Mur de Pêcherie’; 5) Petit Taureau-D); 6) Poull Mad Dogan; 7) Petit Taureau-A.

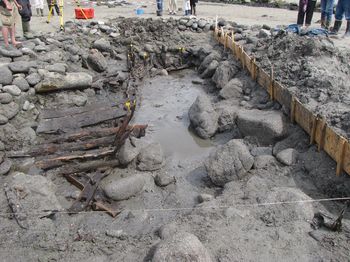
Petit Taureau fish weir under excavation (photograph by M. Lobb).

The excavations revealed four distinct phases built in stone (7), with an earlier timber phase (5). Another smaller V-shaped structure, Corps de Garde, is evident farther downstream (Figure 1.3). The Léguer Estuary is a Site du Réseau Natura 2000, a designation applied to maintain fish stocks. Today, the estuary has migratory species of sea trout (Salmo trutta), Atlantic salmon (Salmo salar) and European eel (Anguilla anguilla) and was probably home to the same species when the structures were originally in use. Historical sources also document the catching of a large shoal of herring (Sardina pilchardus) behind Le Mur du Pêcherie (Cassard Reference Cassard2003)—an event recorded for being unusual, rather than representing the intended purpose of the structure. In 2006, the Association Manche Atlantique pour le Recherche Archaéologique dans les ĺles launched the ‘Maritime Fish-traps of Brittany’ project, to quantify and characterise fishing structures around the Breton coastline (Langouët & Daire Reference Langouët and Daire2009), resulting in a database of over 550 structures. Assessing the position of these ‘productive’ structures within the tidal frame (height range encompassing all statistically defined tidal states) can inform us about their use and potential. This is, however, a challenging task, and is addressed in this article through the use of a TLS methodology, taking the Léguer Estuary as a case study.
Methodological considerations
The TLS survey used a Leica ScanStation C10 with scans registered together using high definition survey targets, with a mean registration error of 4mm. A global navigation satellite system (GNSS) was used to survey the target locations, creating a final registered accuracy of approximately 15mm. The registered scans from each survey were incorporated into a single database. Challenges encountered when TLS is used on dryland areas are exacerbated in the inter-tidal environment, where reflectivity is reduced due to the presence of moisture or water, resulting in inaccurate or negative data. ‘Shadows’ or voids in the data are caused not just by the multi-sided nature of the targeted features, but also by the null or negative responses from where the laser hits standing water. The stability of the equipment, and therefore its accuracy, is problematic, as the inter-tidal substrate becomes unstable with the incoming tide, as the water table rises in advance of salt water incursion. Logistical considerations are also exacerbated within the coastal zone as the tidal range creates a limited time frame within which to record archaeological remains. In many cases, this also necessitated cleaning or re-excavating sites that have been inundated by sediment with each tidal cycle. In addition, wind and rain can be particularly challenging for equipment in these coastal environments. Nonetheless, TLS offers a potential solution to the logistical difficulties associated with recording inter-tidal structures due to its relative speed, portability and high spatial resolution and accuracy. The traditional method would be a total station survey, but this could never achieve the TLS point resolution, cannot deal with overhangs easily and would have taken many days.
Results
Structures within an inter-tidal landscape
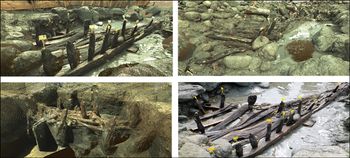
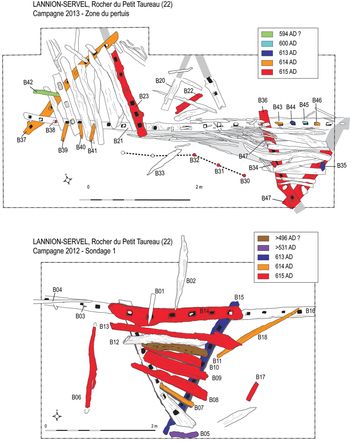
One key site identified for further investigation was the large V-shaped structure in the Léguer Estuary at Le Petit Taureau (Figure 1.7). This feature had at least four phases of use, presenting an unusual opportunity to investigate the development of such structures. Excavations in 2012 uncovered a much earlier timber-built, V-shaped fishing structure directly underlying one phase of the stone alignments. These earlier remains comprised a line of wattle-and-post construction, supported by a finely crafted mortise-and-tenon sill-plate with triangular posts. Similar to the ‘hurls’ known from Irish weirs (Went Reference Went1946), these would have been filled with stones to stabilise the structure's walls and prevent their destruction by strong tides or storms. Dated by dendrochronology to AD 615 (Bernard & Langouët Reference Bernard and Langouët2014), the structure represents a substantial level of skill and investment. The TLS survey of the timber-built fishing structure was carried out during excavations in June 2013. The excavated sections of the late sixth- to early seventh-century V-shaped structure were recorded, along with the extant historically recorded sixteenth- to eighteenth-century stone-built structures (Figures 2–4). A stone-paved trackway leading down to the beach (Figure 5), contemporaneous with the later structures, was also surveyed, as was the smaller V-shaped fishing structure at Corps de Garde (Figure 1.3) to the west of the site. In November 2014, we returned to the estuary to scan the structure in the Baie de la Vierge to the west of the Le Yaudet promontory, and to survey other features in the estuary using TLS.
Terrestrial laser scans (TLS) and photograph (bottom right) of Petit Taureau under excavation (images by M. Lobb).

Plans of the Petit Taureau fish trap with dendrochronological dates (images by V. Bernard).

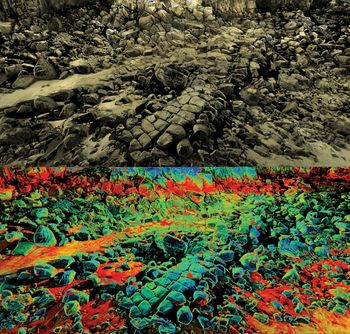
The stone-paved trackway leading to Petit Taureau (Figure 1.5): top) a terrestrial laser scanning DEM, with a photograph draped over it; and bottom) with the intensity of return draped over it. The intensity of return drape shows the sand (in yellow and red) burying the lower part of the trackway where it enters the tidal frame and is eroding out (image by M. Lobb).

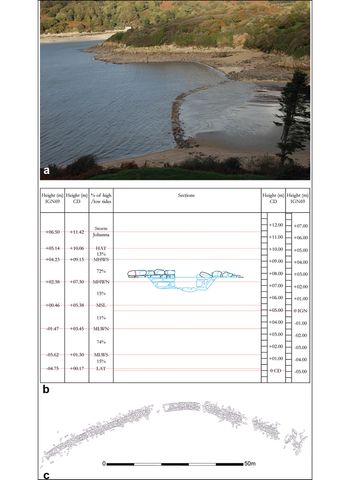
The georeferenced TLS survey was imported into AutoCAD to generate 2D sections of each structure. These sections were then plotted against each other with reference to the local mapping frame (IGN69) and zéro hydrographique (ZH)—the French equivalent of chart datum (Figure 6). The cross-sections enable a direct visual comparison of the vertical placement of structures across the estuary within the tidal frame, and allow some immediate conclusions to be drawn. The most obvious is that the relative heights of the structures at Le Yaudet and Le Petit Taureau suggest that the structures exploited different ends of the tidal frame, and therefore fulfilled different functions.
Terrestrial laser scanning heights of structures within the Léguer Estuary, as related to the tidal frame (delimited by the broken red-lined frame) as modelled by the authors. The blue lines indicate the various heights of the tidal state (shown left). The top profiles show cross-sections of the structure at Le Yaudet, while the bottom two profiles show a section across the excavated seventh-century timber structure (left) and extant stone sixteenth- to seventeenth-century weir (right). HAT = highest astronomical tide; MSL = mean sea level; MLWN = mean low water neaps; MLWS = mean low water spring; LAT = lowest astronomical tide; MHWN = mean high water neap.

The relative heights of the two phases at Le Petit Taureau initially suggested that the later structure sat higher in the tidal frame, potentially indicating a shift in the relative sea level at this point. The cross-section of the earlier weir, however, indicates that the timber sill-beam had curved over a large underlying rock, implying that the structure has been pushed downward by the weight of the overlying stone-built phase. This suggests that the seventh-century AD structure originally sat at a higher position within the tidal frame—by as much as 0.5m. The earlier phases of the structure at Le Petit Taureau were first exposed by industrial sand extraction in the late twentieth century, causing channel migration and displacement of sediments throughout the estuary. This relationship between the structures and the sediment is important, as it suggests that the various phases of rebuilding, and the increased height at which subsequent phases were built, could therefore be attributed to the gradual increase of the level of the foreshore due to sedimentation caused naturally and/or by sediment being trapped and accumulating around the structures themselves. Such a sequence has also been demonstrated in the Fergus Estuary (Sands et al. Reference Sands, O'Sullivan, Daly and Dillon2016). The scan of the post-medieval trackway (Figure 5) also shows ongoing erosion of the cobbled surface, with the intensity of the return image clearly differentiating between sand burying the lower part of the structure and the stone.
Modelling the Le Mur de Pêcherie in the Baie de la Vierge
The first archaeological investigations of ‘Le Mur du Pêcherie’ (Figure 7a) were carried out in the 1970s and included an excavation across a putative, undated sluice (Pinot Reference Pinot1991; Figure 7b). The structure was then comprehensively surveyed as part of the investigations into the wider landscape of Le Yaudet by Cunliffe and Galliou (Reference Cunliffe and Galliou2004), and a stone-by-stone plan produced (Figure 7c). The earlier excavation had uncovered the base of the presumed sluice, providing valuable information about the positioning of a diagnostic feature in relation to the tidal frame. Our alignment of the Pinot (Reference Pinot1991) drawing with an elevation generated from the laser-scanning data allows the accurate placement of this significant feature within the tidal frame (Figure 7b). These results compare well with the seventh century AD tide mill at Nendrum in Northern Ireland, where the base of the millrace pond sat approximately 0.5m below the mean high water neap (MHWN) (Browne Reference Browne, McErlean and Crothers2007). This supports the hypothesis that the structure at Le Yaudet is most likely the reservoir wall for a tide mill. A comparison of the sections also reveals slight morphological differences between the structures at Le Mur de Pêcherie and those at Le Petit Taureau. The walls of the Le Mur de Pêcherie incline slightly at an angle of around 6° from the vertical. This differs in profile from the later stone structure of Le Petit Taureau, which has perpendicular construction in the extant blockwork. The plan of the Le Mur de Pêcherie structure also differs in that it resembles a gentle arc, rather than the V-shape that defines the other fishing structures within the estuary. The structure is also perforated by several openings that appear to have functioned as sluices; the structures at Le Petit Taureau have no such comparable features.
a) The stone intertidal structure at the foot of le Yaudet from the west at mid tide; b) Pinot (Reference Pinot1991) elevation (blue) rectified to point cloud elevation (black); the red lines indicate the heights of the different tidal states; c) plan of the structure at Le Yaudet produced by total station survey (Cunliffe & Galliou Reference Cunliffe and Galliou2004).

The placement of the structures within the tidal frame can also explain their differences in size and morphology. The large fixed fishing structures at ‘Le Petit Taureau’ are situated between the mean low water neap (MLWN) and the mean low water spring (MLWS) levels, where 74 per cent of low tides fall. It therefore follows that the principal investment in building fixed fishing structures would be within this area, as it would maximise returns by providing the greatest tidal exposure and, thus, the largest amount of fish. The smaller weirs at Dourven and Corps de Garde are located below the MLWS level, but, crucially, not below the level of the lowest astronomical tide (LAT). There is, therefore, no reason to assume that these weirs are not contemporaneous with the later stone-built structure at Le Petit Taureau, as they would still have been exposed, and therefore functional, during extremely low tides. As approximately 15 per cent of low tides fall between the MLWS and the LAT (calculated using the tidal gauge at Roscoff), it may be postulated that the relatively small size of the weirs and their position within the tidal frame are not due to their relative antiquity, as originally proposed by Langouët et al. (Reference Langouët, Daire and Bernard2012), but, rather, to reduced exposure time of this area of the foreshore.
As noted above, a comparison of the heights and morphology of the various estuarine structures supports Cunliffe and Galliou's (Reference Cunliffe and Galliou2004) hypothesis that the structure in the Baie de la Vierge at Le Yaudet is the reservoir for a tide mill. The Baie de la Vierge is an ideal location for a tide mill, being an unused inlet (with no river) that could easily be blocked off (Charlier et al. Reference Charlier, Ménanteau and Chaineux2004). The placement of the structure at the top end of the tidal frame with a short inundation period is consistent with the typical siting of tide mills, which required a tidal coefficient of 65–70 (Wailes & Gardner Reference Wailes and Gardner1938). In practice, this means that they were sited at a point in the tidal frame three hours above the low turning tide point (Charlier & Menanteau Reference Charlier and Menanteau1997). The Mur de Pêcherie is referred to in the Vita S. Euflam [Life of Saint Efflam], the earliest version of which is thought to have been written down in the twelfth century AD (de la Borderie Reference de la Borderie1892: 289–90; and cited in Cunliffe and Galliou Reference Cunliffe and Galliou2004: 165). Referred to as a device for trapping fish, there is no mention of any milling function, suggesting that the mill, and knowledge of it, had disappeared by the twelfth century (Cunliffe & Galliou Reference Cunliffe and Galliou2004).
The presence of seventh-century AD structures on the north side of the estuary, and the association of the Mur de Pêcherie with the Life of St Efflam, suggests that the latter structure is of an early medieval date—directly comparable to the seventh-century AD sites of Ebbsfleet (AD 691–692) in Kent, England, Nendrum (AD 619–621) in County Down, Northern Ireland and Little Island (AD 630) in County Cork, Ireland (Rynne Reference Rynne2000; McErlean & Crothers Reference McErlean and Crothers2007; Hardy et al. Reference Hardy, Watts, Goodburn, Andrews, Hardy and Brown2011). All of these examples are located on tidal-creeks on sheltered parts of the coast; those that also used a freshwater source were placed where a small stream enters an estuary, as is the case at Le Yaudet. There is also evidence at Le Yaudet for cultivation and corn-drying mills associated with an important early monastic settlement (Cunliffe & Galliou Reference Cunliffe and Galliou2004). The lack of evidence for a wheelhouse is not as problematic as it might seem, as most early mills, such as at Ebbsfleet, were built almost entirely of wood (Hardy et al. Reference Hardy, Watts, Goodburn, Andrews, Hardy and Brown2011). Horizontal mill wheels—a common component of tide mills in most periods—would have sat above the wall.
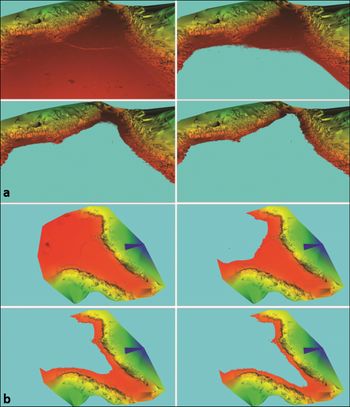
Work by Browne (Reference Browne, McErlean and Crothers2007) on the Nendrum mill provides a model by which volumetric data can be used to assess potential mill output. Data from the TLS survey enable modelling of surface topography behind the Mur de Pêcherie. Once modelled, the surface can be virtually flooded to simulate different tidal states: mean sea level (MSL), MHWN, mean high water spring (MHWS) and highest astronomical tide (HAT). Potential reservoir volumes can then be calculated from each simulation (Figure 8). This method allows the calculation of the potential water volume of the reservoir by calculating the volume between the virtual sea level and the topographic model. Tide mills were unusable on neap tides, or when the wind held up the waters and whenever the MHWN level fell below the level of the structure. A calculation of the volume of the reservoir during MHWS will therefore give the average volume of water on usable tides. This was calculated for the extant remains and then for a range of hypothetical heights that may represent the extent of the original structure. Pinot's (Reference Pinot1991) excavations showed that the functional part of the structure lay at least 1m below present ground level, and the lack of a binding course on top of the current structure suggests that it may have been at least one course higher than currently survives. Calculations were therefore made for the extant remains plus additional heights at 0.5m intervals (Table 1).
a) North-east view of the terrestrial laser scanning (TLS) survey of the structure at Le Yaudet with virtual water levels set to MSL (mean sea level; top left), MHWN (mean high water neap; top right), MHWS (mean high water spring; bottom left) and HAT (highest astronomical tide; bottom right); b) north-east view of the TLS survey of the structure at Le Yaudet with virtual water levels set to MSL (top left), MHWN (top right), MHWS (bottom left) and HAT (bottom right) (image by M. Lobb)

Estimated potential volumetric capacity (in cubic metres) of ‘Le Mur de Pêcherie’. MHWS = mean high water of spring tides; HAT = highest astronomical tide.

The potential annual output of the mill, based on the characteristics of the mill at Nendrum, was then calculated using Browne's (Reference Browne, McErlean and Crothers2007) formula. Although the morphological data from the Mur de Pêcherie is incomplete, known seventh-century AD tide mills show a great deal of consistency. The modern tidal range at Nendrum is approximately 3.4m, which is smaller than spring (7.6m) and neap (3.6m) tides at Le Yaudet. The Nendrum millpond has an area of 2000m2, which at MHWS created a water volume of approximately 1800m3. According to Browne (Reference Browne, McErlean and Crothers2007), this would have allowed the tide mill to generate an annual power equivalent to 50 tonnes of milled barley per year. Volumetric analysis at Le Yaudet suggests that it could have had a volume over 10 times greater than that of Nendrum, allowing as much as 800 tonnes of milled barley per year, and supporting a population of over 1000 (assuming 20 bushels per head per year). Although this may be an over-estimate of productivity, as Browne's (Reference Browne, McErlean and Crothers2007) calculations were based on modern examples, our own calculations using fundamental flow calculations (del Rosario et al. Reference del Rosario, Pérez, Serrano and Sánchez2006) from the tidal head and size of the reservoir suggest approximately 540 megawatts per tidal cycle. This scales approximately with the difference in the areas of the tidal reservoirs at Nendrum and Léguer. Another check on these estimations is a comparison of the size of the community that the mill served, which at Nendrum was an affluent episcopal centre with a sizable population (McErlean & Crothers Reference McErlean and Crothers2007).
The Léguer Estuary: a landscape of production
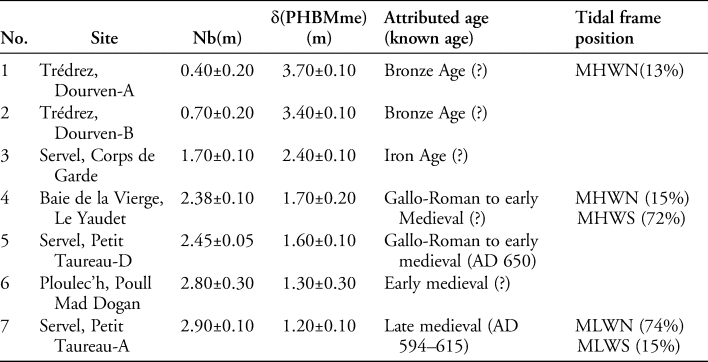
Le Yaudet headland, with its large Iron Age and Roman earthwork fortifications, continued in importance through the early medieval and medieval periods as a religious centre for pilgrimage linked with the prominent sixth-century Irish missionaries St Enora and St Efflam (Cassard Reference Cassard2003; Cunliffe & Galliou Reference Cunliffe and Galliou2004). The number, size and extended use of the fixed fishing structures, including the creation of the stone-paved trackway (Figure 5) and the tide mill, suggest the presence of a large and stable local community under monastic or seignorial control. The TLS survey also allowed us to examine the relationships between the structures within the tidal frame, as different structures require particular parts of the tidal frame to operate. Inter-tidal structures also have the potential to be used as benchmarks for sea level. Previous work in the Léguer Estuary by Langouët et al. (Reference Langouët, Daire and Bernard2012) has taken this approach, assuming that the dates of these structures within the estuary can be calculated by comparing their varying heights (Table 2). In this approach, the base of each inter-tidal structure is assumed to be at the level of the ‘plus haute basse mer de morts-eaux’ (PHBMme) or lowest neap tide. The difference between this level and the modern datum is then calculated (δ(PHBMme)) and used to provide a relative date. Here, however, we suggest that the structures operated contemporaneously within the tidal frame, assuming that the tidal frame has remained roughly the same since the structures were built. This is a difficult assumption to test, as a sufficiently accurate historical sea level curve does not exist for this location.
Surveyed heights of inter-tidal structures within the Léguer estuary, with ages estimated using the height estimation method and known ages in parentheses if known.

The tidal gauge at Roscoff has recorded tidal height data since 1973, during which time the monthly mean has risen from 6834 to 7037mm above the revised local reference datum. As this short period accounts for only two full metonic cycles (a period of 19 years in which the Sun, Moon and Earth return to the same relative positions), tidal heights cannot easily be projected backwards over several centuries. It is therefore difficult to model the relative sea level over the past 1500 years in the Léguer Estuary. None of the structures in the Léguer Estuary, however, lie outside the tidal frame; all are submerged for at least some of the tides, and none are below LAT. If there had been a significant shift of the relative sea level in either direction, one or more of the structures would probably lie outside the tidal frame. Additionally, all of the structures are in the appropriate location within the tidal frame to fulfil their original function; all of the presumed fixed fishing structures are situated between the MLWS and MLWN levels, while the Mur de Pêcherie is perfectly positioned to function as a tide mill. The difference in heights between the seventh-century timber weir and the later overlying structures appears to have been caused by sedimentation rather than a change in RSL. In contrast, examples of fishing structures from other locations in Brittany, as well as comparable sites in Wales and Essex have been found below LAT (O'Sullivan Reference O'Sullivan2003).
Discussion and conclusions
The application of TLS has contributed significantly to assessing the function and environmental context of the various sites within the Léguer Estuary. The TLS modelling of the Mur de Pêcherie, along with analysis of its morphology, tidal-frame position and volumetric potential and association with an early monastic settlement, all strongly support its usage as part of a tide mill. The TLS survey at a landscape level shows that both the fish-weir system at Le Petit Taureau (including all five of its phases) and the tide mill at Le Yaudet (Mur de Pêcherie) could have been operating concurrently, but for different purposes, within the tidal frame. Although difficult to confirm due to a lack of dating, the other seven structures situated in the tidal frame (including the lower part of the stone-paved trackway) could also have been operating within different parts of the tidal cycle and for different resources. This exploitation of different parts of the inter-tidal and coastal zone across this small estuary implies control of the landscape, most likely by the settlement and monastic community at Le Yaudet. This was a fortified early medieval settlement with a sheltered landing place, one large fish weir to exploit the majority of tides, one or more smaller weirs for the more extreme tides and a tide mill for flour production. This would certainly be in accordance with the concept of a self-sustaining early medieval monastic community with an emphasis on fish-eating (in keeping with the seventh-century Rule of St Benedict). The Rule also stated that monasteries should have mills (Wikander Reference Wikander2000). Indeed, in England, the Abbeys were major owners of fish weirs. Tidenham on the River Severn, for example, is mentioned in a tenth-century charter, which lists 104 fish weirs belonging to Bath Abbey (Bond Reference Bond and Aston1988). Several of these weirs were dated to the eighth to tenth centuries as part of the Rapid Coastal Zone Survey (Chadwick & Catchpole Reference Chadwick and Catchpole2013).
Many Irish estuaries, including the Shannon, Fergus, Deel, Corrib, Brandon, Nore, Liffey, Strangford Lough and Lough Swilly (Montgomery et al. Reference Montgomery, Forsyth and Breen2015) have concentrations of early medieval fish weirs, traps or hedges. In Strangford Lough, an association with ecclesiastical management by Nendrum Abbey has been postulated for the Nendrum Chapel Island fish traps. The Abbey is also credited with the construction of two tide mills in c. AD 619 and 787 (McErlean & O'Sullivan Reference McErlean, O'Sullivan, McErlean, McConkey and Forsythe2002; McErlean & Crothers Reference McErlean and Crothers2007). The earliest of these pre-dates the previously oldest excavated tide mill (AD 630) on Little Island in the Lee Estuary, County Cork (Rynne Reference Rynne1993), which may have been associated with Cork Monastery founded in the late sixth or early seventh century. Several pre-Norman religious houses in both Ireland and England are also associated with tide mills, including St Mary's Abbey Barking (Benedictine nunnery, established AD 666, with mill at Shellhaven (Essex Record Office: D/SF 23/41)), Canterbury Christ Church (Benedictine, established AD 598, with mill at Sandwich), St Mary's Abbey, Dublin (Benedictine, established AD 846), Dunbrody (County Wexford), Corcomroe (County Clare), Duisk (County Kilkenny), Quarr Abbey (Isle of Wight), Beaulieu Abbey (New Forest), Stratford Langthorpe (Essex) and Tintern Abbey (Monmouthshire) (Lynch Reference Lynch2010; Sier Reference Sier2016). In Strangford Lough, eleventh- to thirteenth-century wooden and stone V- and C-shaped fish traps were constructed in Grey Abbey Bay; some of these were also owned by the abbey (O'Sullivan Reference O'Sullivan and Duffey2005b).
A more recent survey using GNSS and TLS has documented at least 18 V-shaped fish weirs in the complex at Borelands Rock in the Fergus Estuary. These were also probably constructed and used by the Augustinian Abbey on Canon Island, in what can be characterised as a landscape “teeming with activity” (O'Sullivan et al. Reference O'Sullivan, Dillon, Sands, McDermott, Shaw and Devlin2010: 8). As O'Sullivan (Reference O'Sullivan2003) observes, this association between the abbeys and fish traps could have functioned in a number of ways from operation by tenants (manaig in the Irish context), by a social class that rendered food and services to monks (geburas in the English context), or by provendarii (sensu Zettler Reference Zettler2015) on the continent. The development of tide mills and investment in fish traps can be regarded as part of monastic investment for both profit and to secure their own food supplies without dependency on external sources (Lucas Reference Lucas and Walton2006). The direct association of Le Yaudet with sixth-century Irish monasticism, and the very similar tide mill sites at Nendrum and Little Island, County Cork, provides an interesting wider geographic context.
We show here how a combination of excavation, dendrochronology and TLS can greatly facilitate the retrieval of high-resolution data in the inter-tidal zone, and that TLS data are particularly valuable for the heuristic modelling of the operation of inter-tidal structures. While we report on a tide mill, there is potential for using TLS data for the integrated modelling of the operation and environmental effects of other structures—particularly fixed fishing structures—and to disentangle the relative effects of structure-induced erosion, sedimentation and subsidence from changes in RSL. This modelling is critical due to the overwhelming evidence for ongoing and future sea-level rise and the risk to our coastal heritage that this poses.
Acknowledgements
This paper is dedicated to Loïc Langouët (1941–2018) and Rick Turner (1952–2018) who both greatly assisted the project, and to Jo Nield for TLS assistance.