Implications
The present work demonstrates the potential of the AfiLab™ to assess on-line milk-clotting parameters and to divert the milk into two bulk milk tanks A and B through two parallel milk lines. Simulated segregation of milk according to clotting parameters revealed that the cow's milk was diverted according to varying quality parameters for cheese production on a daily basis, as well as during the milking session. The major factors responsible for low-quality milk for cheese making were post-udder infection by various bacteria and the combination of the cow's status of days in milk and level of milk production.
Introduction
In modern dairy farming operations, at any given time, the animals in the herd differ in the stage of lactation, physiological conditions, hormone levels, health status, etc. These differences have implications on the milk properties of each individual animal. Consequently, the bulk milk represents an average milk of all the individual milked animals. Differentiation between animals producing low- or high-quality milk is an economical goal for the cheese industry.
Present appraisal of individual cow's milk potential for cheese manufacturing can be predicted by using the AfiLab™ milk spectrometer (Afimilk, Afikim, Israel), which provides the coagulation properties of the milk – Afi-CF value of curd firmness on-line (Leitner et al., Reference Leitner, Lavi, Merin, Lemberskiy-Kuzin and Katz2011 and Reference Leitner, Merin, Lemberskiy-Kuzin, Bezman and Katz2012). Such a device, when installed in a milking parlor equipped with two parallel milk lines and two bulk milk tanks, has the potential of controlling the milk properties in two bulk milk tanks A and B, on the basis of its on-line properties for cheese making and for other milk products and fluid milk.
The cheese yield formula of van Slyke has long been used by the dairy industry and scientists alike for calculating predicted cheese yields (Fenelon and Guinee, Reference Fenelon and Guinee1999; Verdier-Metz et al., Reference Verdier-Metz, Coulon and Pradel2001; Brito et al., Reference Brito, Niklitschekl, Molina and Molina2002; Emmons and Modler, Reference Emmons and Modler2010). The equation takes into account that, during coagulation, fat loss is lower than CP loss, and that casein loss is a fixed value of 0.1 (Emmons et al., Reference Emmons, Ernstrom, Lacroix and Sauve1993 and Reference Emmons, Dube and Modler2003; Emmons and Modler, Reference Emmons and Modler2010). Although this equation is effective in calculating bulk milk cheese yield, applying the equation to an individual animal is not accurate, particularly regarding animals that are in the margin of their normal milking curve, that is, beginning and late lactation, suffering from udder infection (clinical and/or subclinical), etc. Van Slyke's equation relies on consistent incorporation of milk constituents in cheese per liter milk used. However, as milk fat and protein are not uniform for all animals during the entire lactation (Čandek-Potokar et al., Reference Čandek-Potokar, Prevolnik, Babnik and Perpar2006; Quist et al., Reference Quist, LeBlanc, Hand, Lazenby, Miglior and Kelton2008; Forsbäck et al., Reference Forsbäck, Lindmark-Månsson, Andrén, Åkerstedt and Svennersten-Sjaunja2009) and vary from day to day (Forsbäck et al., Reference Forsbäck, Lindmark-Månsson, Andrén, Åkerstedt, Andrée and Svennersten-Sjaunja2010), neither is component loss. Moreover, van Slyke's formula assumes that casein loss is fixed, when in reality this is not the case, and the coagulation process is much more complex than simply aggregating fixed proteins and fat molecules (Fleminger et al., Reference Fleminger, Ragones, Merin, Silanikove and Leitner2011).
The objectives of the present study were (i) to evaluate the performance of the AfiLab™ equipment installed in a milking parlor of commercial farms to provide real-time analysis of milk-clotting parameters – Afi-CF – for cheese manufacture and determine its repeatability in time for individual cows, and (ii) to assess the major causative factors of a cow producing milk, influencing the quality of the milk for cheese production.
Material and methods
Study layout
Three commercial dairy herds of 220 to 320 Israeli Holstein cows producing ∼11 500 l during 305 days were selected for the study. The cows were milked three times daily (0500, 1300 and 2000 h) and were fed a typical Israeli total mixed ration containing 65% concentrate and 35% forage (17% protein). Food was offered ad libitum in mangers located in the sheds. The milking parlor was a double-sided herringbone equipped with Afimilk on-line milking stations. Cow's data included: lactation (L), days in milk (DIM), days in pregnancy (DIP) and milk yield (kg/day). Fat, protein, lactose, somatic cell count (SCC) and history of health were taken from the Israeli Herd Book. Daily on-line data including milk yield, fat, protein, conductivity and Afi-CF were also taken from the Afimilk on-line data recording system (Leitner et al., Reference Leitner, Merin, Lemberskiy-Kuzin, Bezman and Katz2012).
In herd 1, three analyses were performed:
1. The on-line data were monitored during 100 days, and the weekly average was used to calculate the fluctuation of cow's Afi-CF (Leitner et al., Reference Leitner, Lavi, Merin, Lemberskiy-Kuzin and Katz2011 and Reference Leitner, Merin, Lemberskiy-Kuzin, Bezman and Katz2012). The data were also used to calculate cheese yield (for Cheddar cheese) using the empirical equation of van Slyke [(% fat × 0.93) +(% protein × 0.78 − 0.1)] × 1.09/[1 − (moisture in cheese)]. During this period, cows were inseminated and others were dried off, so that each cow was introduced into the analysis only after she had at least three measurements.
2. At one time point of each of the three daily milkings, the AfiLab™ was set to simulate segregation of the milk into each of the bulk milk tanks A and B by diverting pulses of 200 ml as ‘analyzed’ on-line. During milking and depending on the cow daily milk yield, 15 to 35 pulses of milk were recorded for each cow. The Afi-CF cutoff level was set according to the desired volume of milk required in each of the bulk tanks A and B, to the possible needs of the dairy on the processing day. The study was conducted using the following combinations: 90 : 10; 70 : 30; 50 : 50; 30 : 70 and 10 : 90 (percent milk diverted to tanks A : B).
3. Two independent measurements were taken (in June and August) to determine the effects influencing Afi-CF and its repeatability using the Israeli Herd Book data. The correlations of gross milk composition (fat, protein and lactose), SCC and Afi-CF and the main factors influencing these parameters were calculated using results of herd 1, with additions of the other two herds monitored for 1 week.
Bacteriology testing
Bacterial identification were based on pretrial quarter foremilk samples of 5 ml, taken aseptically two or three times at 2-week intervals during the morning milking, and tested at the laboratory within 1 h for bacteriology according to accepted microbiological procedures of the US National Mastitis Council (Oliver et al., Reference Oliver, Gonzalez, Hogan, Jayarao and Owens2004).
Statistical analyses
All statistical analyses were performed using JMP software (SAS Institute, 2000). Three analyses were performed: (1) Afi-CF repeatability, (2) milk segregation and (3) factors effecting Afi-CF and the empirical van Slyke equation.
1. Afi-CF repeatability: cows were measured 3 to 14 times for Afi-CF during 100 days. The differences between repeats were determined by a one-way ANOVA model in ‘blocks’ design using the repeat (3 to 14) as the main effect and the cows as ‘blocks’. The statistical model was
 $${\rm{Model}}\,{\rm{1:}}\,{{Y}_{ijk}}\: = \:\mu \: + \:{{B}_i}\: + \:{{\alpha }_j}\: + \:{{e}_{ij}}.$$
where μ = mean of all data, Bi = the variance between cows (blocks), αj = the difference between the mean of repeat i from the trial mean and eij = residual variance between measurements (random error). Multiple comparisons between repeated measurements were made by Student's t-test.
2. Milk segregation: correlations between all the continuous variables and the analyzed parameters were determined for all data and for each lactation separately (first or second or third and higher). The ANOVA model included the lactation (first or second or third and higher) as a fixed effect and the continuous variables as co-variance for each cutoff level separately. Interactions between the lactation and the continuous variables were also included in the model. Owing to the registration of DIP only at 45 days, the two similar models were used, one with DIP, therefore including only ∼60% of the cows, and the second without DIP, including all the cows. Only model 2 is presented, which included all the continuous variables, except DIP:
 $$\openup 3pt{ {\rm{Model}}\,{\rm{2:}}\,{{Y}_{ijlmnopqrs}}\: = & \:\mu \: + \:{{\alpha }_i}\: + \:{{\beta }_j}\: + \:{{\delta }_l}\: + \:{{{\epsilon}}_m}\: + \:{{\zeta }_n}\:\cr + \:{{\eta }_o}\: + \:{{\theta }_p}\: + \:{{\kappa }_q}\: + \:{{\lambda }_r}\: + \:{{\pi }_s}\: \cr+ \:\alpha {{\beta }_{ij}}\: + \:\alpha {{\delta }_{il}} \: + \:\alpha {{{\epsilon}}_{im}}\: + \:\alpha {{\zeta }_{in}}\:\cr & + \:\alpha {{\eta }_{io}}\: + \:\alpha {{\theta }_{ip}}\: + \:\alpha {{\kappa }_{iq}}\: + \:\alpha {{\lambda }_{ir}}\:\cr & + \:\alpha {{\pi }_{is}}\: + \: + \:{{e}_{ijlmnopqrs}}. $$
where μ is the grand mean; αi represents the fixed effect of lactation; βj represents the co-variance of DIM; δ l represents the co-variance of total milk; εm represents the co-variance of Afi fat; ζn represents the co-variance of Afi protein; ηo represents the co-variance of Afi lactose; θp represents the co-variance of milk yield (kg); κq represents the co-variance of cond.; λr represents the co-variance of Log SCC; πs represents the co-variance of urea; αβij represents the lactaion × DIM interaction; αδil represents the lactaion ×total milk interaction; αεim represents the lactation × Afi fat interaction; αζin represents the lactation ×Afi protein interaction; αηio represents the lactation × Afi lactose interaction; αθip represents the milk yield (kg) interaction; ακiq represents the lactation × conductivity interaction; αλir represents the lactation × Log SCC interaction; απis represents the lactation × urea interaction; and eijlmnopqrs represent the residual variance between measurements (random error).
3. Factors effecting Afi-CF and the empirical van Slyke equation: two independent measurements were taken (in June and August) to determine the repeatability of the results. In each study, one sample of milk was taken from the cows, and the milk yield (milk), Log SCC, percent fat (fat), percent protein (protein), percent lactose (lactose), Afi-CF and van Slyke were determined. On the milk sampling day, the cow's lactation, DIM and DIP were recorded. For each study separately, the continuous variables (DIM, DIP, milk, Log SCC, fat, protein and lactose) were included in an ANOVA model in a random design using the lactation (first, second or third and fourth or more) as fixed effects and the continuous variables as co-variance. No interactions were included in the model. The statistical model was
 $${{\rm{Model}}\,{\rm{3:}}\,{{Y}_{ijklmnop}}\: = \:\mu \: + \:{{\alpha }_i}\: + \:{{\chi }_j}\: + \:{{\gamma }_k}\: + \:{{\delta }_l}\: + \:{{{\epsilon}}_m}\:\cr \quad+ \:{{\zeta }_n}\: + \:{{\eta }_o}\: + \:{{\pi }_p}\: + \:{}{{e}_{ijklmnop}}{\rm{.}}$$
where μ is the grand mean; αi represents the fixed effect of the lactation; χj represents the co-variance of DIM; γk represents the co-variance of DIP; δl represents the co-variance of milk; εm represents the co-variance of Log SCC; ζn represents the co-variance of fat; ηo represents the co-variance of protein; πp represents the co-variance of lactose; and eijklmnop = residual variance between measurements (random error).
The combination of the data from the two studies were analyzed in an ANOVA model in a ‘blocks’ design, using the study as ‘blocks’ (random effect), the lactation (first, second or third and fourth or more) as fixed effect and the continuous variables (DIM, DIP, milk, Log SCC, % fat, % protein and % lactose) as co-variance. The statistical model was
 $${{\rm{Model }}\,{\rm{4:}}\,{{Y}_{ijklmnop}}\: = \:\mu \: + \:{{B}_q}\: + \:{{\alpha }_i}\: + \:{{\chi }_j}\: + \:{{\gamma }_k}\:\cr\quad + \:{{\delta }_l}\: + \:{{{\epsilon}}_m}\: + \:{{\zeta }_n}\: + \:{{\eta }_o}\: + \:{{\pi }_p}\:\cr\quad + \:{{e}_{ijklmnop}}.$$
where μ is the grand mean; Bq represented the variance between studies; αi represents the fixed effect of the lactation; χj represents the co-variance of DIM; γk represents the co-variance of DIP; δl represents the co-variance of milk; εm represents the co-variance of Log SCC; ζn represents the co-variance of % fat; ηo represents the co-variance of % protein; πp represents the co-variance of % lactose; and eijklmnop = residual variance between measurements (random error). The same models (3 and 4) were used to analyze the cows of each of the three farms, which produced the low 10% Afi-CF. In the model, instead of two independent studies, three farms were used, and in model (4) the combination of the three farms was the co-variance. In the ANOVA models, the multiple compressions between lactations were carried out by Tukey–HSD t-test. Correlation (R 2) between individual Afi-CF and fat, protein, lactose and SCC was also performed.
Results
Evaluation of the AfiLab™ on-line milk separation performance for cheese manufacturing and its repeatability in time for an individual cow
Afi-CF repeatability during time
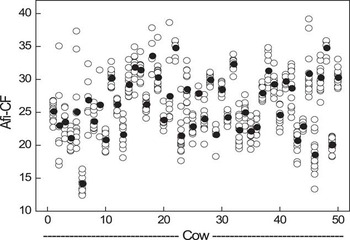
The one-way ANOVA model (1) using the cows as ‘blocks’ was found significant (P < 0.001) for cows. The model succeeded in explaining 83.5% (R 2 = 0.849) of the variance between Afi-CF and cow. No significant variance was found between the means of the weekly repeated recordings. Figure 1 illustrates the distribution of Afi-CF values measured within cows (average of 10 measurements of 50 representative cows) and its mean value.
Distribution of Afi-CF values measured among 50 representative cows (open circles – mean weekly measured values; solid circles – mean of the cow's measured values).

Milk segregation
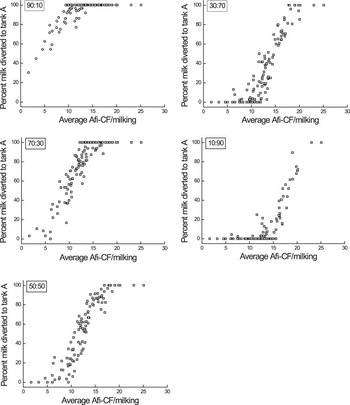
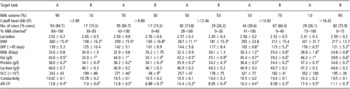
At every selected target segregation level, milk from most cows was diverted into both bulk milk tanks, A and B. The proportion of milk diverted from each cow to one of the tanks depended on the selected target level. The amount that flowed into bulk tank A (higher Afi-CF) as a percent of the whole milk volume was higher when Afi-CF cutoff level was lower. As a result, as Afi-CF cutoff level increased, lower proportions of milk from fewer cows was diverted into bulk tank A (Figure 2). Dichotomies means and standard error of milk flow for each Afi-CF cutoff level on the cow level are summarized in Table 1. The dichotomy decision of grouping was made arbitrarily, depending on the volume of milk diverted to each bulk tank A or B. Lactation, pregnancy, DIP and DIM had no significant effect on milk distribution, even though at some cutoff levels there were significant differences (P < 0.05) in DIM. Daily milk yield was also not a major factor, although at cutoff level >30 : 70, cows with low daily milk production contributed a significantly higher proportion of the milk to tank A. Of the milk components, lactose and SCC, as well as conductivity, did not affect the milk flow. Fat and protein were the major milk constituents that were significantly different with lower amounts in tank B (Table 1).
Distribution of cows according to the milk diverted into bulk milk tank A. Each figure represents a different Afi-CF cutoff level.

Means of lactation, DIM, DIP, daily milk yield and composition, SCC, conductivity and Afi-CF of milk in tank A or B for five cutoff levels (90 : 10, 70 : 30, 50 : 50, 30 : 70 and 10 : 90) during 1 day of three milkings. Each cutoff level was analyzed separately using statistical model (2).

DIM = days in milk; DIP = day in pregnancy; SCC = somatic cell count.
§% of cow's milk diverted to bulk tank A.
a,bParameters within row for each set of cutoff level with no common superscript differ significantly (P < 0.05).
In general, regardless of the Afi-CF cutoff level, most cows contributed milk to both tanks. At a cutoff level 90 : 10, the intention was to divert non-coagulating milk (Afi-CF ∼ 3) out of tank A; thus, part of the milk of only about 15% of the cows was diverted into tank B. Similar results of diverting milk to tank A were exhibited at a very high cutoff level (Afi-CF > 18).
Comparison among the three daily milkings, morning, noon and evening revealed that the proportion of milk flow to tank A was higher at the noon and evening milkings than at the morning milking (37.47 ± 3.29; 33.94 ± 3.46; 26.07 ± 2.43 l, respectively).
Factors effecting Afi-CF and the empirical van Slyke equation
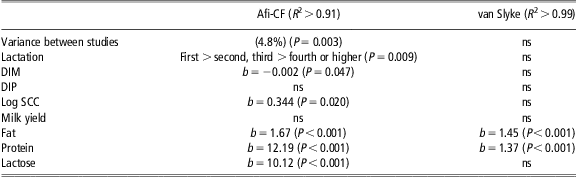
The effects of lactation, DIM, DIP, Log SCC, milk, fat, protein and lactose on Afi-CF and the empirical van Slyke equation determined by ANOVA for each study separately, and for the combination of the data from the two independent measurements (in June and August) in farm 1, are summarized in Table 2. For Afi-CF, the models succeeded in explaining most of the variance (R 2 > 0.91). There was a significant variance between the two studies (P = 0.003); however, this variance only explained 4.8% of the total variance in the trial (data not shown). Afi-CF was higher in the first lactation than in the second or third lactations, and the fourth lactation or higher had the lowest value. These differences were highly significant in Study A and in the combined data (studies A + B) but not in study B. DIM and Log SCC had no significant effect on Afi-CF values; however, in the combined data analysis, these effects were significant. For van Slyke, the models succeeded in explaining almost all of the variance between results (R 2 = 0.99). There was a difference of 2.4% between the studies, which was not significant. The most striking results are the effects of fat and protein on all three studies and lactose only on Afi-CF. However, the levels of the effects were significantly different. For fat, increase of 1% in fat increased 1.67 units of Afi-CF and 1.45 units of van Slyke. For protein, increase of 1% in protein increased 12.19 units of Afi-CF and 1.37 units of van Slyke. For lactose, decrease of 1% in lactose decreased 10.12 units of Afi-CF and was not significant for van Slyke.
The effects of lactation, DIM, DIP, Log SCC, milk yield and composition on Afi-CF and the empirical van Slyke equation determined by ANOVA (model (4)) from the two independent measurements (in June and August) in farm 1
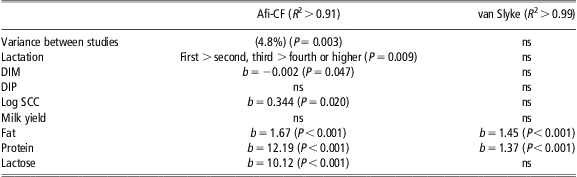
DIM = days in milk; DIP = day in pregnancy; SCC = somatic cell count; ns = not significant.
b = slope of regression line.
Comparison between Afi-CF and van Slyke equation
The correlations between Afi-CF and van Slyke calculated yield with fat, protein, lactose and SCC were analyzed for the three farms. In all farms, the correlation of Afi-CF for protein was higher, but not significant than that of van Slyke (Afi-CF – 0.77 to 0.82; van Slyke – 0.59 to 0.88). However, Afi-CF correlation for fat was significantly lower (0.57 to 0.61) than that of van Slyke (0.93 to 0.94; P > 0.05). For lactose, the correlation was negative (−0.01 to −0.14) but not significantly higher for van Slyke, and for SCC correlation was negative (−0.01 to −0.05).
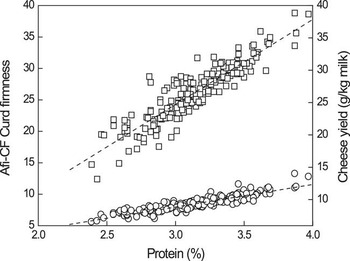
Figure 3 illustrates the individual data of protein v. the recorded Afi-CF or van Slyke calculated cheese yield and the mean slope of the two sets of values. The illustrations show the different weight of the relevant factor given by the method of evaluation of the milk to the calculated result (although not calculated in the same units). The slopes of the regression lines for protein are significantly different with greater than ×3 for Afi-CF. Moreover, it can be seen that the distribution of Afi-CF data points is larger than that of van Slyke.
Effect of percent milk protein on the recorded Afi-CF curd firmness (squares; a = 12.68; R 2 = 0.76) and van Slyke calculated cheese yield (circles; a = 3.10; R 2 = 0.75).

Assessment of the major causative factors of a cow producing milk of low quality for cheese production
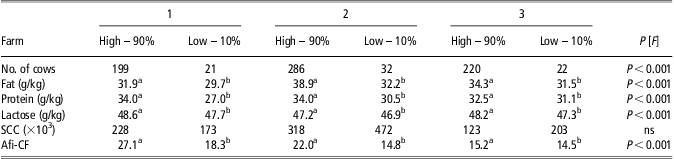
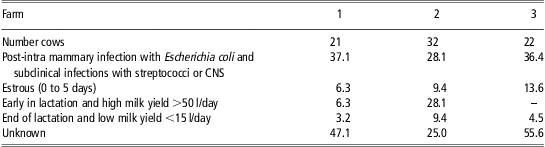
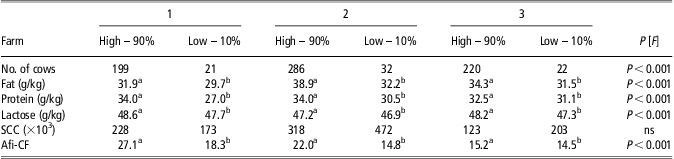
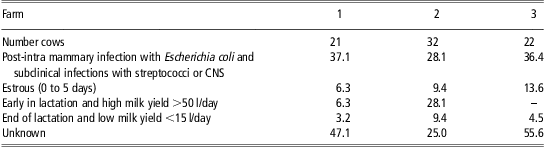
The cows in the three farms were divided into two categories: Low – 10% Afi-CF and the rest High – 90% Afi-CF (Table 3). For all three farms, fat, protein, lactose and Afi-CF were significantly lower in the 10% group. The level of SCC was not significantly different among groups. The cows in the 10% group were further analyzed for possible causes responsible for producing low-quality milk for cheese manufacturing. The largest numbers of cows in all three farms (∼30%) were found to be those with post-intramammary infection with Escherichia coli and subclinical infections with streptococci or coagulase-negative staphylococci (CNS; Table 4). Early time in lactation, together with high milk yield, >50 l/day, and late time in lactation together with low milk yield, <15 l/day and estrous (0 to 5 days) were additional factors influencing low-quality milk, probably temporary to the time of measurement. However, ∼50% of the tested variables did not explain any of the factors responsible for the cow producing milk in the low – 10% Afi-CF.
The mean major milk constituents, fat, protein, lactose, SCC and Afi-CF of milk of the cows that produced the low – 10% Afi-CF milk in each of the three farms and the significance of the effects among the farms. The remaining 90% of the cows are used as control.
SCC = somatic cell count; ns = not significant.
a,bParameters within row within farm with no common superscript differ significantly (P < 0.05).
Possible causes for cows to belong to the low – 10% Afi-CF (numbers are percent of the cows)
CNS = coagulase-negative staphylococci.
Discussion
In the previous studies (Leitner et al., Reference Leitner, Lavi, Merin, Lemberskiy-Kuzin and Katz2011 and Reference Leitner, Merin, Lemberskiy-Kuzin, Bezman and Katz2012), it was shown that the parameter Afi-CF determined by the AfiLab™ is suitable for assessing milk quality according to its clotting parameters, which cannot be assessed by merely measuring fat and protein content on either the gland or the cow level.
The dairy industry refers to the bulk milk as its ultimate raw material, as it has neither control nor information on the individual animal's milk flow into the bulk milk tank. Upon reception of milk for processing, it is graded according to the constituent's level and SCC. The milk is accepted for processing unless individual cows cause an increase of SCC, which results in total withdrawal of the milk or reduction of its price. Therefore, upon purchasing of the milk by a dairy, the maximal effective cheese yield of that milk is already determined by its origin. Under these conditions, van Slyke's formula could be suitable for predicting cheese yield, although the prediction is not always accurate. The reasons for such inaccuracies lie in the assumptions of constant values of incorporation of fat and protein in the curd, and the constant loss of casein (−0.1) included in the formula, while ignoring the complexity and availability of the protein for curdling. Owing to these limitations, many suggestions for modifying the van Slyke equation have been published (Banks et al., Reference Banks, Muir and Tamine1984; Emmons et al., Reference Emmons, Ernstrom, Lacroix and Sauve1993; Emmons and Modler, Reference Emmons and Modler2010), although they did not refer to the problem of the quality and origin of the raw milk, as fat and protein contents were always blamed for the inaccuracies (Fenelon and Guinee, Reference Fenelon and Guinee1999). Moreover, inferior milk clotting was blamed among many factors on some causatives such as bacterial udder infection (Barbano et al., Reference Barbano, Rasmussen and Lynch1991; Leitner et al., Reference Leitner, Krifucks, Merin, Lavi and Silanikove2006 and Reference Leitner, Lavi, Merin, Lemberskiy-Kuzin and Katz2011), stage of lactation (Lawrence, Reference Lawrence1991; Sapru et al., Reference Sapru, Barbano, Yun, Klei, Oltenacu and Bandler1997), nutrition (Lawrence, Reference Lawrence1991; Coulon et al., Reference Coulon, Hurtaud, Remond and Verité1998), genetic variability (Ikonen et al., Reference Ikonen, Morri, Tyrisevä, Ruottinen and Ojala2004; Malacarne et al., Reference Malacarne, Summer, Fossa, Formaggioni, Franceschi, Pecorari and Mariani2006; Vallas et al., Reference Vallas, Bovenhuis, Kaart, Pärna, Kiiman and Pärna2010) relative composition of caseins (Wedholm et al., Reference Wedholm, Larsen, Lindmark-Månsson, Karlsson and Andrén2006; Penasa et al., Reference Penasa, Cassandro, Pretto, De Marchi, Comin, Chessa, Dal Zotto and Bittante2010) and other unknown reasons (Ikonen et al., Reference Ikonen, Ahlfors, Kempe, Ojala and Routtinen1999 and Reference Ikonen, Morri, Tyrisevä, Ruottinen and Ojala2004).
As the above-mentioned factors, whether temporary and/or permanent, cannot be controlled at the level of the bulk milk tank, they need to be controlled at the milking parlor. Moreover, to control the milk flow into the bulk tank, it is crucial to understand the complexity of the incorporation of milk proteins and fat into the curd and to identify the milk involved/responsible for low cheese yield during manufacturing on the gland or animal level. The AfiLab™ was calibrated by comparing measured curd firmness by the Optigraph as a reference value and deliberating a dimensionless value of curd firmness – Afi-CF, by testing milk of hundreds of individual glands/cows (Leitner et al., Reference Leitner, Lavi, Merin, Lemberskiy-Kuzin and Katz2011). Although this calibration does not provide a better understanding of the complexity of curd formation, it showed a major deviation from van Slyke's equation that was expressed by the different values resulting from the statistical analysis assigned to fat and protein. As can be seen in Table 2 and Figure 3, Afi-CF infers lower weight to fat than to protein – the major factor in curd formation, as presented by the differences in the slopes for protein in the figure. This difference should be further investigated because in the dairy industry, fat is the factor that is constantly being changed according to the product, in contrast to protein in the bulk milk, which is at a fixed level, although it might vary between batches, which is also accompanied by a lower percent of casein.
The other important finding for the cheese-making industry lies in the varying values of Afi-CF for cows within a herd. Therefore, segregation of milk according to its mean Afi-CF is suitable for improving the milk quality for cheese making. However, it has various limitations owing to: (i) changes of milk properties of individual cows of similar features such as DIM, milk yield, milk composition, etc. during lactation, (ii) short-time changes in Afi-CF owing to udder infection, disease, estrus, stress, etc. and (iii) varying milk quality of each individual cow at any given time during the milking session. Thus, during every milking, different proportions of milk of most of the cows was diverted to each of the tanks A or B.
Post-intramammary infection with E. coli and subclinical infection with streptococci or CNS resulted in ∼30% lower Afi-CF values, which are long-term influences and are consistent with the findings of the present study (Leitner et al., Reference Leitner, Merin, Lemberskiy-Kuzin, Bezman and Katz2012). These results are of utmost importance for dairies that manufacture long-time ripening cheese, as defects related to these lingering effects will be noted at a late stage when the damage cannot be corrected.
The results also indicated that 10% to 15% of the low Afi-CF milk is temporarily due to estrus, new illness or infection, including intramammary infection. Thus, the daily information provided by the AfiLab™ can be used by the farmer to detect animal health status and may add to the identification of estrus. Moreover, if the milking parlor is equipped with two milk lines, on those days the on-line sensor can divert this milk to a ‘low Afi-CF’ tank. The repeatability analysis indicated that ∼50% of the low Afi-CF milk as well as the high Afi-CF milk (data not shown) had no explained relation to the cows or their behavioral or physiological conditions. Thus, in future, this value could be used as a factor to be implemented in the evaluation for protein productivity, although this point requires further studies.
Conclusion
The AfiLab™ instrument when installed on-line in a milking parlor, which is equipped with two milk lines and two bulk milk tanks, provides an opportunity to divert 200 ml resolution pulses of milk into tank A or B, according to its suitability for cheese production. In the present study, it was shown that milk suitability for cheese making according to predetermined values changes between days, between milking sessions and even during the milking session. Low-quality milk for cheese manufacturing was blamed on post-intramammary infection, DIM, stage of lactation, estrus and other unknown variables.
Acknowledgment
The authors wish to thank the staff of the three dairy herds for their help and collaboration.