INTRODUCTION
In future, water will become increasingly scarce particularly in semi-arid regions. There, global climate change may lead to higher potential evapotranspiration (ET), decreasing precipitation and increasing frequency of high intensity rains. At the same time, water demand is most likely to grow due to higher population density and expanding areas of irrigation (IPCC, 2001; Shiklomanov, Reference Shiklomanov, Shiklomanov and Rodda2001). Hence, there is an urgent need to use water more efficiently.
Water use efficiency (WUE) in intercropping (such as maize/cowpea, mustard/chickpea, maize/mungbean, sorghum/cowpea, pigeon pea/sorghum intercropping system etc.) was compared by contrasting data from intercropping against weighted means from ones of relevant crops in monoculture with proportions of soil area occupied by each component crop in intercropping system as weighted mean coefficients and indicated that WUE of intercropping system was greater than the WUE of monoculture by 4–99% and over 18% in many cases mainly affected by planting density and available soil water (Morris and Garrity, Reference Morris and Garrity1993). By contrast cowpea/pearl millet and cowpea/sorghum intercropping systems did not increase obviously WUE (Grema and Hess, Reference Grema and Hess1994; Shackel and Hall, Reference Shackel and Hall1984).
Maize–soybean relay strip intercropping is a major planting pattern in southwestern China (Yan et al., Reference Yan, Gong, Yang, Wan, Chen, Chen and Wang2010; Zhang et al., Reference Zhang, Yang and Dong2011). The maize in maize–soybean relay strip intercropping systems is usually sown according to the narrow double row planting pattern at the end of March or the beginning of April and harvested at the end of July or the beginning of August. Soybean is planted in the double wide row between maize at the beginning of June and harvested at the end of October (Yang et al., Reference Yang, Huang, Gao, Liu, Yong, Wang, Wu and Yang2014).
Appropriate planting patterns can improve the lighting of the soybean canopy and increase the total yield of maize–soybean relay strip intercropping have been studied previously (Yang et al., Reference Yang, Wang, Liao, Lu, Gao, Liu, Yong, Wu, Du, Liu and Yang2015). However, how these planting patterns affect WUE and water distribution have not been examined. Moreover, the full ground cover is usually hardly achieved in the relay strip intercropping systems results in a large amount of water loss through soil evaporation (Wang et al., Reference Wang, Wu, Zhao, Gao and Chen2015). However, few studies have analyzed the integrated effects of planting patterns on the WUE in relay strip intercropping systems.
The major objectives of this study therefore were (i) measure the water use status of maize and soybean in various planting patterns of relay strip intercropping (ii) explore the relationships of different planting patterns with soil volumetric water content, soil evaporation, leaf transpiration and WUE (iii) determine the optimum planting geometry for developing water management of maize–soybean relay strip intercropping system.
MATERIALS AND METHODS
Site description
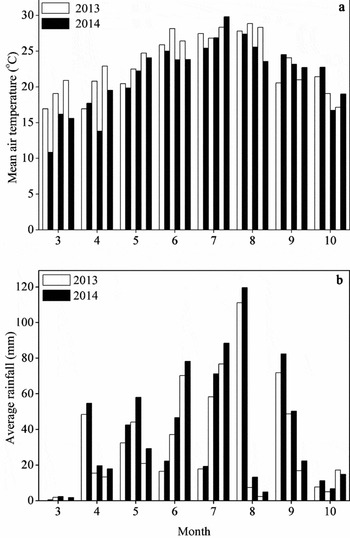
Field experiments for maize–soybean relay strip intercropping were conducted over two growing seasons (2013 and 2014) at the experimental station of Sichuan Agricultural University (30°4ʹ16ʹʹN, 104°12ʹ53ʹʹE) Renshou County, Sichuan Province, China. The average precipitation and mean air temperature during the intercropping growth seasons from 2013 to 2014 are shown in Figure 1. The climate of the site is subtropical, sub humid with mean monthly air temperature and rainfall of 18.6 °C and 172 mm during the growing seasons. The soil is classified as sandy loam with mean bulk density of 1.39 g cm−3.
Mean air temperature (a) and average rainfall (b) during the growing seasons of maize–soybean relay strip intercropping system. Each empty and solid black bar indicates mean data of every 10-days for 2013 and 2014, respectively.

Experimental design
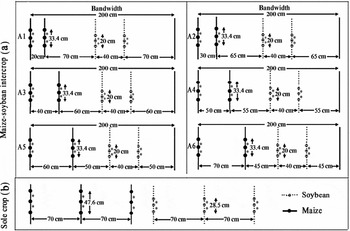
Experiments were designed and settled by single-factor random block method with three replications. The treatments were as follows: six maize narrow-row planting patterns alternated with wide soybean rows in relay strip intercropping, sole maize and sole soybean. Maize cultivar was ‘Chuandan418’, while the soybean cultivar was ‘Nandou12’. The row spacing in sole maize and sole soybean was 70 cm. All the intercropping patterns followed two-by-two staggered arrangement (two rows of maize alternated by two soybean row). The total width of one adjacent maize and soybean strip was 200 cm in the maize–soybean relay strip intercropping system. The following planting patterns were used: (A1) 20:180, 20 cm narrow maize row and 180 cm wide soybean row (A2) 170:30 cm, (A3) 40:160 cm, (A4) 50:150 cm, (A5) 60:140 cm and (A6) 70:130 cm. Soybean was planted in the wide rows between narrow maize rows at 40 cm row spacing (Figure 2). Each plot was 6 m long and 5 m wide with three strips. The planting densities of maize and soybean were 6 and 10 plants m−2, respectively. The plant spacing of maize and soybean was 16.7 and 10 cm for all intercropping treatments and 23.8 and 14.3 cm for sole crops, respectively. Maize was planted on 3rd April 2013 and 5th April 2014 and soybean was planted on 12th June of each year. Maize was harvested on 28th July 2013 and 2nd August 2014, while soybean was harvested on 29th October 2013 and 28th October 2014. Soil volumetric water content, leaf transpiration, soil evaporation, component and total yields, land equivalent ratio (LER), WUE and WER were used as important indices. Basal N at 135 kg ha−1 as urea, P at 40 kg ha−1 as calcium superphosphate and K at 10 kg ha−1 as potassium sulfate were applied into soil before maize sowing. Basal N at 75 kg ha−1, P at 40 kg ha−1 as calcium phosphate and K at 4 kg ha−1 as potassium sulfate were applied to the sole and intercropped soybean. At the sixth leaf stage (V6) of maize and beginning bloom stage (R1) of soybean, N at 135 and 75 kg ha−1 as urea were applied to the maize and soybean treatments.
Schematic representation of the maize–soybean intercrops (a) and sole crops (b). Intercropped and sole maize were planted at 6 plants m−2 . Intercropped and sole soybeans were planted at 10 plants m−2 . Maize was planted in narrow-row planting patterns and soybean was sown in wide rows between the maize rows. Each asterisk indicates the sampling points for soil volumetric water content. Within row spacings of maize and soybean were 16.7 and 10 cm in all treatments, respectively. Solid and dashed lines represent maize rows and soybean rows. Each solid black circle represents one maize plant, and each empty circle represents one soybean plant in the maize–soybean relay strip intercropping.

Field sampling and processing
Soil volumetric water content
Soil water at 0–30 cm was measured gravimetrically and a neutron probe was used to measure changes in the soil water at 30–100 cm of soil profile on a weekly basis during the co-growth period in the maize–soybean relay strip intercropping. Access tubes were installed between two adjacent maize and soybean plants within the MM, MS and SS row in the intercropping system. Measurements were taken weekly and the mean of three readings was used at each depth.
Soil evaporation
Soil evaporation was measured at the grain filling stage of maize and V3 soybean stage. For this purpose, micro-lysimeters made of PVC (polyvinylchloride) were used. They were situated within the MM, MS and SS row. Micro-lysmeters were consist of an inner and an outer tank. The inner tank was 15 cm long and 11 cm in diameter, whereas the outer tank was 14 cm long and 12 cm in diameter. The outer tank was fixed into the soil with its edge levelling the soil surface, while the inner tank was pushed into the soil with the top levelling the soil surface and then pulled out. The base of the inner tank was sealed with a plastic film to avoid the chance of water leakage. The inner tank with the undisturbed soil was weighted using LP-3102 portable electronic balance with a precision of 0.01g at 8.00 am each day. In order to keep the soil water in the micro-lysimeters similar to the surrounding soil, the soil in the microlysimeters was replaced once in every three days. Finally soil evaporation (mm day−1) was measured from the weight loss of the micro-lysimeters.
Leaf transpiration
Photosynthesis system can be used as a reliable and accurate instrument for the measurement of transpiration (Mahouachi et al., Reference Mahouachi, Socorro and Talon2006; Mengistu et al., Reference Mengistu, Sterck, Fetene, Tadesse and Bongers2011). In this study, maize and soybean leaf transpiration measurements were taken on sunny days from 10.00 am to 14.00 pm at the grain filling stage of maize and soybean V3 stage. Portable photosynthesis system (LI-6400-xt; LI-COR, Lincoln, NE, USA) equipped with the standard leaf chamber (encloses 6 cm2 of leaf area), and a CO2 injection system adjusted to a constant CO2 concentration of 400 μ mol CO2 mol air−1 was used. The light intensity of the photosynthesis system provided by a red-blue LED light source was set to 800 μ mol m−2 s−1 (model 6400–xt, Li-Cor Inc., Lincoln, NE, USA). For each maize and soybean plant three sunlit leaves located at the middle canopy layer were selected from the narrow maize row and wide soybean row and enclosed in the leaf chamber for 2–4 minutes for transpiration measurements. Five samples for each leaf were measured and the averaged value was taken as the representative transpiration of that leaf.
Runoff water calculation
The soil conservation service (SCS, 1972) rainfall-runoff model was used to estimate the runoff water. Due to its versatility, the SCS model has been widely used internationally for water resources management, urban storm water modeling and runoff estimation (He, Reference He2003; Mishra et al., Reference Mishra, Jain and Bhunya2005). It has also been introduced and applied by some scholars in China due to its consistency (Jin et al., Reference Jin, Xihuan and Yangbin2003; Liu et al., Reference Liu, Shaozhong and Delin2005). The theory underlying the SCS model is that runoff can be related to soil-cover complexes and rainfall through a curve number (CN). The SCS modal assumes that the ratio of actual soil retention is equal to the ratio of direct rainfall, provided runoff begins to potential maximum infiltration. The relationship can be expressed as (USDA, 1985)
 $$\begin{equation}
F/Q = S/Qm
\end{equation}$$
where F is cumulative infiltration, Q is runoff (mm), S is potential maximum retention or infiltration (mm) and Qm is the potential runoff of the precipitated rainfall (P). Runoff is generated due to pre-plant interception, initial infiltration and filling water storage basin which constitutes the difference between the precipitated rainfall (P) and initial abstraction (Ia) given by expression:
 $$\begin{equation}
\begin{array}{l} Qm = P - Ia\\ \end{array}
\end{equation}$$
The actual amount of rainfall infiltrated was given by an expression:
 $$\begin{equation}
F = P - Ia - Q
\end{equation}$$
By summation of equations (1), (2), (3), we can get an equation:
 $$\begin{equation}
P - Ia - Q/Q = S/P - Ia
\end{equation}$$
To derive equation
 $$\begin{equation}
Q = {(P - Ia)^2}/(S + P - Ia)
\end{equation}$$
the value of Ia was set as 0.2S. Therefore, the SCS-CN model can be expressed as follows:
 $$\begin{equation}
Q = {(P - 0.2S)^2}/(P + 0.8S)P \ge 0.2S
\end{equation}$$
 $$\begin{equation}
{\rm{where}}\;Q = 0,\quad P \le 0.2S
\end{equation}$$
In order to estimate the maximum soil possible infiltration (S), the SCS modal presents a dimensionless runoff CN which represents the runoff potential of the land cover-soil complex characteristics governed by soil antecedent moisture condition (AMC), soil type, land use and treatment (USDA SCS, 1985):
 $$\begin{equation}
S = (25400/{\rm{CN}}) - 254
\end{equation}$$
Three AMCs denoted as AMC I, AMC II and AMC III were defined. The CN value of AMC II (CN II) was provided by SCS-CN manual and the CN values of AMC I and AMC III was calculated using the equation (USDA SCS, 1985)
 $$\begin{equation}
{\rm{CN}}\,{\rm{I}} = 4.2{\rm{CN}}\,{\rm{I}} = 4.2{\rm{CN}}\,{\rm{II}}/(10 - 0.058{\rm{CN}}\,{\rm{II}})
\end{equation}$$
 $$\begin{equation}
{\rm{CN}}\,{\rm{III}} = 23{\rm{CN}}\,{\rm{II}}/(10 + 0.13{\rm{CN}}\,{\rm{II}})
\end{equation}$$
Grain yields
Maize and soybean grain and biomass were harvested at maturity from a net area of each treatment demarcated after leaving out two rows on each side of the plot and the first two and the last two maize–soybean plants in each row to minimize the edge effect. The entire plants on the plots were harvested by cutting at the ground level and weighted to represent the total fresh weight. Maize–soybean cobs/pods were manually separated from the stover, sun-dried and packed in sacks before threshing. The moisture content of the grains was determined after threshing using a moisture meter and the grain yields adjusted to 12 percent moisture content.
Land equivalent ratio
Intercropping advantage was assessed by calculating the LER (Zhang et al., Reference Zhang, Yang and Dong2011), which is an index of intercropping advantage and indicator of intercropping efficiency in using the environmental resources compared with those of sole crops (Mead and Willey, Reference Mead and Willey1980). LER was calculated as (Fetene, Reference Fetene2003; Li et al., Reference Li, Yang, Li, Zhang and Christie1999)
 $$\begin{equation}
{\rm{LER}} = {\rm{LE}}{{\rm{R}}_M} + {\rm{LER}}s = \frac{{{Y_{M,I}}}}{{{Y_{M,S}}}} + \frac{{{Y_{S,I}}}}{{{Y_{S,S}}}}
\end{equation}$$
LER M and LER S represent the relative yield of maize and soybean in a relay strip intercropping system. YM,S and YM,I are the sole and intercropped maize yield, whereas YS,S and YS,I are the sole and intercropped soybean yield, respectively. Intercropping favours the growth and yield of the species when LER is > 1. Intercropping is disadvantageous if LER is < 1. A LER of 1.0 indicates no advantage of intercropping system over sole cropping (Dabbagh et al., Reference Dabbagh, Amon and Kaul2011).
Water use efficiency
To estimate the WUE, firstly actual ET was computed in intercropping and sole cropping using the following water balance equation:
 $$\begin{equation}
{\rm{E}}{{\rm{T}}_c} = \Delta W + I + R - SI - Q
\end{equation}$$
As the crop was rainfed, so based on the observation of runoff the SCS runoff was used in 2013 and 2014 growing season, respectively, and the ET was calculated as given:
 $$\begin{equation}
{\rm{E}}{{\rm{T}}_c} = \Delta W + R - SI - Q
\end{equation}$$
where ΔW represents the change in water (mm), R shows rainfall (mm), SI is the deep percolation (mm) and Q shows the surface runoff (mm).
Finally, the WUE for maize and soybean was computed using the following equation (Zhang et al., Reference Zhang, Oweis, Garabet and Pala1998):
 $$\begin{equation}
{\rm{WUE}} = Y/{\rm{ET}}
\end{equation}$$
where Y represents yield (kg ha−1) and ET shows evapotranspiration.
And the group WUE was estimated as follows:
 $$\begin{equation}
{\rm{GWUE}} = {Y_M} + {Y_S}/{\rm{GET}}
\end{equation}$$
where YM, YS represent yield of maize and yield of soybean in intercropping, while GET represents group ET calculated according to the whole growth period rainfall and changes in soil water.
 $$\begin{equation}
{\rm{GET}} < {\rm{E}}{{\rm{T}}_M} + {\rm{E}}{{\rm{T}}_S}
\end{equation}$$
Water equivalent ratio
WER was calculated using the following formula (Guo et al., Reference Guo, Tang and Cai2002; Li et al., Reference Li, Sun, Zhang, Li, Yang and Rengel2001):
 $$\begin{equation}
{\rm{WER}} = {\rm{WE}}{{\rm{R}}_M} + {\rm{WE}}{{\rm{R}}_S} = \frac{{{\rm{WU}}{{\rm{E}}_{M,I}}}}{{{\rm{WU}}{{\rm{E}}_{M,S}}}} + \frac{{{\rm{WU}}{{\rm{E}}_{S,I}}}}{{{\rm{WU}}{{\rm{E}}_{S,S}}}}
\end{equation}$$
where WER M , WER S are the relative WUE in maize–soybean relay strip intercropping system; WUE M,I , WUE M,S , WUE S,I , WUE S,S , are the intercropped and sole water-use efficiency of maize and soybean in different planting patterns. When WER > 1, it illustrates that with respect to the sole cropping, intercropping improved the efficiency of water use. By contrast when WER < 1, intercropping reduced the WUE compared to that of sole cropping.
Assessment of data
Statistical analyses were performed using SAS 9.3 procedures. The relationships were established and the determination coefficient (R 2) values were estimated using OriginPro 8. Treatment means were compared using the least significant difference (LSD) approach. Differences were considered statistically significant when p ≤ 0.05.
RESULTS
Soil water dynamics in intercropping
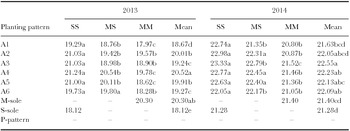
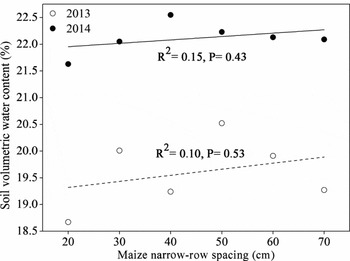
The changes in soil volumetric water content (%) over two years in the maize–soybean relay strip intercropping were measured (Table 1). In both years, the effects of planting pattern on soil volumetric water content were not mainly significant. Howerver, soil water content within the maize row was significantly lower than that in maize-to-soybean and soybean row as shown in the order: MM < MS < SS. Soil water content increased with increasing maize narrow-row spacing from 20–50 cm and decreased thereafter. Comparatively higher average soil water content was measured in the 40 and 50 cm maize narrow-row planting patterns than that of sole maize and sole soybean (p < 0.05). Soil water content was generally lower in 2013 compared with 2014. Soil volumetric water content was regressed over maize narrow-row spacing (R2 = 0.15, p > 0.05) and (R2 = 0.10, p > 0.05) for 2013 and 2014, respectively (Figure 3). In 2013, the maximum soil water content (20.5%) was measured in the 50 cm, whereas for 2014 the maximum average soil water content (22.5%) was recorded in the 40 cm maize narrow-row planting pattern (Table 1).
Soil volumetric water content (%) in maize/soybean relay strip intercropping for 2013 and 2014. MM, MS and SS are sampling points within the maize, maize-to-soybean and soybean rows, respectively. Maize-sole (M-sole) and soybean-sole (S-sole) are controls. Means followed by the same lower case letters (within a column or row) are not significantly different at (p < 0.05).

Soil volumetric water content (%) as a function of maize narrow-row spacing. Empty and solid black circles are the mean for 2013 and 2014, respectively. Dashed and smoothed lines are fitted regressions not significant at p < 0.05.

Soil evaporation in intercropping
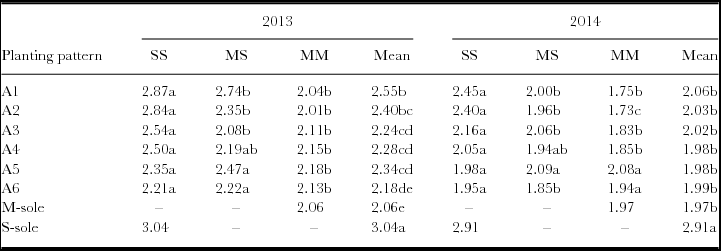
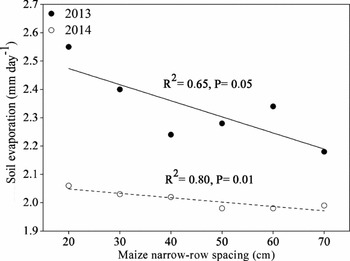
Table 2 shows the daily soil evaporation for different treatments for intercropping plots. The soil evaporation was measured within the MM, MS and SS row. Contrasting for sole crops, the soil evaporation was recorded in the center of each row. Daily soil evaporation showed a ‘Low-high-low’ trend in the intercropping over two growing seasons. On overall basis, planting patterns did not show significant effects for soil evaporation. However, the soil evaporation within the rows in intercropping was significantly different and decreased in the order: MM < MS < SS. In intercropping system, the maximum soil evaporation (2.55 and 2.06 mm day−1) measured in the 20 cm maize narrow-row planting pattern for both 2013 and 2014 seasons. Comparatively, lower average soil evaporation was measured in the maize–soybean intercropping than that of soybean sole crop (p < 0.05). The relationship between soil evaporation and maize narrow-row spacing was established (R2 = 0.65, p < 0.05) and (R2 = 0.80, p < 0.05) for 2013 and 2014 (Figure 4).
Soil evaporation (mm day−1) in maize/soybean relay strip intercropping for 2013 and 2014. MM, MS and SS are sampling points within the maize, maize-to-soybean and soybean rows, respectively. Maize-sole (M-sole) and soybean-sole (S-sole) are controls. Means followed by the same lower case letters (within a column or row) are not significantly different at (p < 0.05).

Soil evaporation (mm day−1) as a function of maize narrow-row spacing. Solid black and empty circles are the mean for 2013 and 2014, respectively. Smoothed and dashed line indicate regressions, all significant at p < 0.05.

Leaf transpiration in intercropping
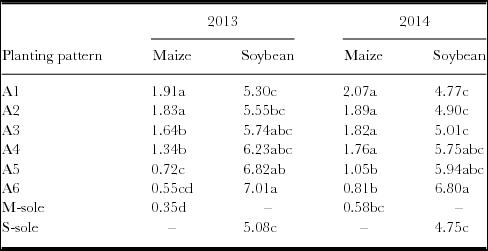
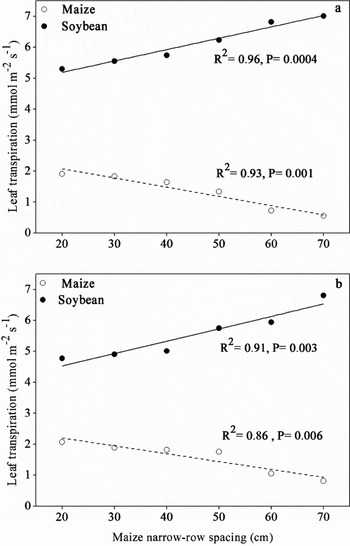
Variations of leaf transpiration for maize–soybean in intercropping and sole cropping are shown in Table 3. Leaf transpiration for the intercropped maize exhibited a continuous reduction in the 20–70 cm maize narrow-row planting patterns. On the contrary, intercropped soybean showed a stable increment throughout in leaf transpiration with increasing maize narrow-row spacing. In intercropping systems, maize showed significantly higher leaf transpiration compared with sole maize (p < 0.05). By contrast, leaf transpiration for the intercropped soybean in the 20–50 cm was not significantly different compared with sole soybean. However, this was significantly higher than that of the sole soybean thereafter. The highest leaf transpiration (1.91 and 2.07 mmol m−2 s−1) was measured for the intercropped maize in the 20 cm for both 2013 and 2014. By contrast, the highest soybean leaf transpiration (7.01 and 6.80 mmol m−2 s−1) was measured in the 70 cm maize narrow-row planting pattern. Maize narrow-row spacing and soybean leaf transpiration had significant higher coefficients of regression (R 2 = 0.96 and 0.91, p < 0.05 for 2013 and 2014 respectively), than maize leaf transpiration (R 2 = 0.93 and 0.86, p < 0.05 for 2013 and 2014 respectively) (Figure 5).
Leaf transpiration (mmol m−2 s−1) in maize/soybean relay strip intercropping for 2013 and 2014. Maize-sole (M-sole) and soybean-sole (S-sole) are controls. Means followed by the same lower case letters (within a column) are not significantly different at (p < 0.05).

Leaf transpiration (mmol m−2 s−1) as a function of maize narrow-row spacing for (a) 2013 and (b) 2014. Empty and solid black circles are the mean for intercropped maize and soybean leaf transpiration, respectively. Smoothed and dashed line indicate regressions, all significant at p < 0.05.

Yields and land equivalent ratios in intercropping
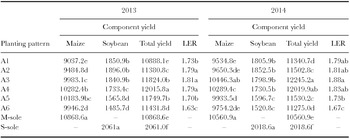
In general, farmers give top priority to yield performance when selecting a planting pattern. Yields and LERs in the maize–soybean relay strip intercropping are shown in Table 4. The component crop yields in the intercropping for both seasons were lower than their sole counterparts. But the total yield was significantly higher than that of maize and soybean sole crops (p < 0.05). The intercropped maize yield increased with increasing maize narrow-row spacing up to 50 cm for 2013 and 40 cm for 2014 and declined thereafter. In contrast, the soybean yield in intercropping slightly increased in the 30 cm maize narrow-row planting pattern for both growing seasons and declined thereafter. Maximum total yields (12015.8 and 12245.2 kg ha−1) were measured in the 50 cm and 40 cm narrow maize row planting pattern for 2013 and 2014, respectively.
Maize and soybean yields (kg ha−1) and LERs in relay strip intercropping for 2013 and 2014. Maize-sole (M-sole) and soybean-sole (S-sole) are controls. Means followed by the same lower case letters (within a column) are not significantly different at (p < 0.05).

Moreover, LER of ≥ 1.61 in the intercropping treatments revealed yield advantage over sole counterparts due to better land use (Table 4). LER followed a ‘high-low’ trend slowly increasing with increasing maize narrow-row spacing, reaching the maximum in the 40 cm and declining thereafter for both seasons. The maximum LER 1.81 and 1.88 was measured in the 40 cm maize narrow-row planting pattern for 2013 and 2014, respectively.
WUE and WERs in intercropping
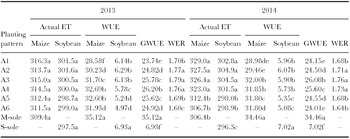
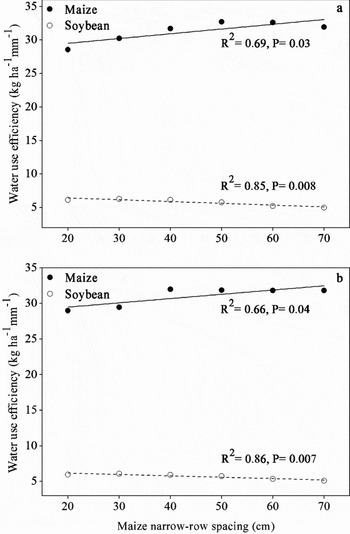
Crop water consumptions (ET) over the co-growth period of maize–soybean relay strip intercropping were determined by equation (13) and summarized in Table 5. Crop water consumptions in the intercropping were not significantly different than that of maize and soybean sole crops. The WUE of maize and soybean in the intercropping was significantly affected by maize narrow-row planting patterns (p < 0.05). The intercropped maize exhibited an increase in WUE with increasing maize narrow-row spacing from 20 to 50 cm, and slowly declined thereafter. On the other side, WUE of the intercropped soybean decreased with increasing maize narrow-row spacing. WUE of maize and soybean in the intercropping was lower that of the sole crops. However, the GWUE was significantly higher than that of the sole soybean (Table 5, p < 0.05). The maximum GWUE of (26.08 and 26.80 kg ha−1 mm−1) measured in the 40–50 cm maize narrow-row planting pattern was, respectively, 39.6% and 23% higher compared with that of sole crop counterparts (p < 0.05). The WUE of maize in intercropping was significantly positive related to the maize narrow-row spacing (R 2 = 0.69 and 0.66, p < 0.05 for 2013 and 2014 respectively). By contrast, the WUE of soybean showed a significant negative relationship with maize narrow-row spacing (R 2 = 0.85 and 0.86, p < 0.05 for 2013 and 2014 respectively) (Figure 6).
WUE (kg ha−1 mm−1) and WER in maize/soybean relay strip intercropping for 2013 and 2014. Maize-sole (M-sole) and soybean-sole (S-sole) are controls. Means followed by the same lower case letters (within a column) are not significantly different at (p < 0.05).

Notes: ET, evapotranspiration; GWUE, group water use efficiency; WER, water equivalent ratio.
WUE (kg ha−1 mm−1) as a function of maize narrow-row spacing for (a) 2013 and (b) 2014. Solid black and empty circles are the mean for intercropped maize and soybean WUE, respectively. Smoothed and dashed line indicate regressions, all significant at p < 0.05.

Additionally, WER was also determined as an index to assess the advantage of crop water use in intercropping over sole cropping (Table 5). WER followed a ‘high-low’ trend, it slightly increased with increasing maize narrow-row spacing, reached the maximum (1.79 and 1.76) in the 40 cm maize narrow-row planting pattern for both 2013 and 2014 and declined thereafter.
DISCUSSION
Soil volumetric water content in intercropping
Maize–soybean relay strip intercropping has been widely practiced in the southwest of China over the last decade (He et al., Reference He, Xia, Peng and Lumpkin2013). Component crops in the maize–soybean intercropping system have different spatial and temporal use of resources owing to their root length density and canopy structures (Ouda et al., Reference Ouda, Mesiry, Abdullah and Gaballah2007). Soil water is an important physical factor affected by a variety of soil, plant and atmosphere related factors (Wang and Wu, Reference Wang and Wu2009). In our experiments, relatively higher average soil water content was measured in the 40 and 50 cm maize narrow-row planting patterns of intercropping than that of the sole maize or sole soybean (Table 1, p < 0.05). The soil water distribution within the different rows of intercropping was not homogeneous and decreased in the order: MM < MS < SS row. The relationship observed between the soil water content and maize narrow-row spacing was not significant (Figure 3). This uneven but higher average water distribution in the 40–50 cm maize narrow-row spacing of maize–soybean relay strip intercropping than their sole counterparts could be due to the difference in maize and soybean root length density and canopy structures with increasing maize narrow-row spacing, as each component crop in intercropping preferentially absorbed the soil water in its strip first and utilized the soil water in the intermingled zone later (Gao et al., Reference Gao, Duan, Liu, Wang, Chen and Liu2009). Moreover, when soil water decrease, plants roots in the dry parts sense it and byway abscisic acid (ABA) reduce transpiration through regulation of stomatal conductance. When leaf conductance it suitably reduces, this may effectively reduce plant transpiration water consumption, and lead to improve WUE (Tang et al., Reference Tang, Zhang, Li and Zhou2005). This indicates that maize–soybean intercropping in the 40–50 cm narrow maize rows can improve crop water use over that of sole crops.
Soil evaporation in intercropping
Maize and soybean in relay strip intercropping did not significantly reduce soil evaporation compared with the sole maize (Table 2). A ‘Low-high-low’ trend of soil evaporation in the intercropping was observed. Soil evaporation in the soybean row was higher than that of maize and maize-to-soybean row. The highest soil evaporation was measured in the 20 cm maize narrow-row planting pattern. A significant negative relationship was found between the average soil evaporation and maize narrow-row spacing (Figure 4). This indicate that increment in the maize narrow-row spacing most likely lowered the shading of the soil surface and increased the air movement, which resulted in low air humidity and high soil evaporation (Ogindo and Walker, Reference Ogindo and Walker2005). Slightly higher soil evaporation in maize–soybean intercropping compared with sole maize could be due to the more uniform leaf distribution and effective covering of surface soil by the sole maize crop. On the contrary, intercropped soybean planted in the wide rows poorly covered the surface soil due to their small leaves and this might had resulted in partially higher or similar average soil evaporation than that of sole maize crop (Karlen and Camp, Reference Karlen and Camp1985).
Leaf transpiration in intercropping
The leaf transpiration of maize in intercropping over two years decreased with increasing maize narrow-row spacing. However, the intercropped soybean leaf transpiration showed a positive relationship with maize narrow-row spacing (Figure 5). The highest maize leaf transpiration was measured in the 20 cm and the highest soybean leaf transpiration was apppeared in the 70 cm maize narrow-row spacing (Table 3). The reason for this could be the uniform distribution of maize leaves with increasing maize narrow-row spacing. This resulted in more uniform light distribution, which ultimately decreased the leaf transpiration of maize and increased soybean leaf transpiration. These findings are not consistent with that from a published report where transpiration of maize–bean intercropping was 5–6% higher than the maize and bean sole cropping (Ogindo and Walker, Reference Ogindo and Walker2005).
Yields and LER in intercropping
The total yields of the maize–soybean intercrop were higher than that of sole maize or sole soybean in this study. However, maize–soybean component yields were less than those of the reference sole crops (Table 4). These results were similar to those from published reports (Aggarwal and Sidhu, Reference Aggarwal and Sidhu1988; Echarte et al., Reference Echarte, Maggiora, Cerrudo, Gonzalez, Abbate, Cerrudo, Sadras and Calvino2011). The lower component yields of maize in intercropping could be associated with the intense intraspecific competition between the maize plants with reduction of narrow-row spacing. This intraspecific competition decreased with increasing maize narrow-row spacing and the maize yields reached the maximum in the 40–50 cm. However declined thereafter, because increasing maize narrow-row spacing lowered the shading of the soil surface, which resulted in high air movement, low air humidity and high soil evaporation (Ogindo and Walker, Reference Ogindo and Walker2005). In contrast, the component yields for the soybean were significantly lower than that of the sole soybean most likely due to the shading effect of maize on soybean in relay strip intercropping (Wolff and Coltman, Reference Wolff and Coltman1989; Yang et al., Reference Yang, Wang, Liao, Lu, Gao, Liu, Yong, Wu, Du, Liu and Yang2015).
The LERs of all planting patterns in maize–soybean relay strip intercropping were above 1.6, suggesting substantially higher land use efficiency (Table 4). LER was higher in the 40 cm maize narrow-row planting pattern for both 2013 and 2014 growing seasons. This result is consistent with the reports where planting patterns directly affect LER (Mao et al., Reference Mao, Zhang, Li, Werf, Sun, Spiertz and Li2012; Zhang et al., Reference Zhang, Yang and Dong2011).
WUE and WERs in intercropping
Effects of planting patterns on actual evapotranspiration (ETc ) in the maize–soybean relay strip intercropping were not significant (Table 5). WUE of the maize–soybean in the relay strip intercropping was lower than that of sole maize or sole soybean due to their lower component yields (Morris and Garrity, Reference Morris and Garrity1993; Saren and Jana, Reference Saren and Jana1999). However, the GWUE was significantly higher than that of sole soybean. The maximum GWUE of (26.08 and 26.20 kg ha−1 mm−1) in the 40–50 cm maize narrow-row planting pattern was, respectively, 39.6% and 23% higher compared with that of sole crops.
Moreover, WER values ranged from 1.60–179, and indicate that crop water use in maize–soybean relay strip intercropping (2:2 maize: soybean row; 200 cm bandwidth) had an effective advantage over sole cropping.
CONCLUSIONS
The main reasons for farmers to practice maize–soybean intercropping are to increase total yields and obtain high LERs. The total yields and land use advantage (LERs) of maize–soybean intercrops were significantly higher relative to sole crops in the two seasons. Apart from total yields and LERs, this work mainly focuses on WUE, GWUE, WER, leaf transpiration and the proportion of soil evaporation in water use in maize–soybean relay strip intercropping, which were essential for improving water management in this system, but rarely studied. Slightly more water was consumed in the intercropping compared with sole crops. By appropriate planting patterns with 40 to 50 cm maize narrow-row spacing, the GWUE of maize–soybean intercropping reached its maximum (26.08 and 26.20 kg ha−1 mm−1) and, respectively, 39.6% and 23% higher compared with that of sole cropping. Results of this study are helpful to improve the WUE and water distribution and maintain high total yields for the maize–soybean relay strip intercropping systems.
Acknowledgements
This research was supported by National Natural Science Foundation of China (No. 31571615), Public Research Funds Projects of Agriculture (No. 201203096), Major Project of Education Department in Sichuan (No. 16ZA0041) and program on Industrial Technology System of National Soybean (No. CARS-04-PS19).