Introduction
Grain sorghum is an important crop grown in Kansas and across the world. In 2015, 1.38 million ha of total land area was planted to grain sorghum in Kansas (USDA-NASS, 2015). Soil application of herbicides for weed control is used in many crops and is very important in grain sorghum due to limited postemergence (POST) herbicide options. In addition, herbicide resistant weeds like Palmer amaranth (Amaranthus palmeri) and common waterhemp (Amaranthus rudis) have increased the importance of PRE herbicide applications to prevent yield loss. Many soil-applied herbicides present their own concerns from an environmental standpoint such as carryover in future crops (Van Acker, Reference Van Acker2005), loss of efficacy due to degradation (Shaner et al., Reference Shaner, Henry, Krutz and Hanson2007), or groundwater contamination due to leaching and runoff (Van Acker, Reference Van Acker2005). Producers must understand the importance of the soil interaction with these herbicides to minimize environmental impacts while sustaining weed control. The activity of soil-applied herbicide is affected by many soil factors, including SOM, pH, texture, and soil moisture (Blackshaw et al., Reference Blackshaw, Moyer and Kozub1994; Kerr et al., Reference Kerr, Stahlman and Dille2004; Nordmeyer, Reference Nordmeyer2015). Ultimately these soil properties affect the adsorption of herbicides to the soil which determines the bioavailability of the chemical in soil solution to be absorbed for control of weeds. Researchers have found that the adsorption of many different herbicides was correlated to SOM, pH, and clay content and that adsorption was spatially variable for a given field (Novak et al., Reference Novak, Moorman and Cambardella1997; Price et al., Reference Price, Oliver, Walker and Wood2009; Wood et al., Reference Wood, Scott, Marx and Lavy1987). In addition, many herbicide labels provide a specific rate based on soil properties. The variability of herbicide adsorption in a field has been studied for understanding soils correlation with leaching potential, but not for assessing variable weed control efficacy (Novak et al., Reference Novak, Moorman and Cambardella1997).
To model the variability of herbicide adsorption across a field requires an intensive sampling plan to effectively determine soil properties. A multi-sensor platform (Veris MSP3) has allowed producers and researchers to map EC and SOM to document soil variability within a field (Kweon, Reference Kweon2012). Currently, the main purpose of these maps is to determine management zones to assist in soil sampling to optimize nutrient applications and increase yields (Doerge et al., Reference Doerge, Kitchen and Lund1999). These sensors provide detailed soil maps that correlate well (R2>0.75) with lab-analyzed data at a low cost (Kweon, Reference Kweon2012). By having EC and SOM maps, the potential for herbicides to leach or be adsorbed can be estimated in fields with variability (Jaynes et al., 1995). Shaner et al. (Reference Shaner, Farahani and Buchleiter2008) found significant correlations between Kd (adsorption coefficient) of metribuzin and metolachlor with fraction of organic carbon (foc) that was significantly correlated with EC as determined by a Veris sensor. Spatially-dense EC and SOM maps potentially allow for development of effective prescription maps for soil-applied herbicide applications. Precision agriculture technology is available for VRA applications of soil-applied herbicides and algorithms need to be developed for optimizing herbicide placement to minimize cost and herbicide load.
Additionally, the use of imagery from small unmanned aircraft systems (sUAS) can generate vegetation indices to determine herbicide efficacy of preemergence herbicides and determine if POST application is needed (Torres-Sanchez et al., Reference Torres-Sánchez, López-Granados, De Castro and Peña-Barragán2013). sUAS allows evaluation of large areas of fields and predict the populations of weeds that need to be managed in future years (Gerhards et al., Reference Gerhards, Gutjahr, Weis, Keller, Sökefeld, Möhring and Piepho2012; Pena et al., Reference Peña, Torres-Sánchez, de Castro, Kelly and López-Granados2013;) The objective of this study is to 1.) Develop and evaluate a procedure for effective VRA of soil-applied herbicides based on Veris MSP3 soil data, and 2.) To determine the effectiveness of multi-spectral imagery on determining weed control efficacy between treatments.
Materials and methods
Experimental Design
In 2016, a field experiment was conducted at two locations in Kansas to develop a procedure for effective VRA. One location was at the South Central Kansas Experiment Field in Hutchinson and the second location was on a producer’s field near Salina. A randomized complete block design with six different herbicide treatments and one untreated check was used with nine replications. The plots were 4.6 m by 30.5 m with the center 3.0 m of the 4.6 m being treated with herbicide. Coordinates from the four corners of the entire study area were taken with a handheld GNSS Surveyor device to then create a georeferenced plot layout. Using the fishnet tool from the sampling data management toolbox in ArcMap 10.4.1, the plot layout was placed over the top of soil data and multispectral imagery to perform zonal calculations for each plot. Dense populations of Palmer amaranth in Hutchinson and both Palmer amaranth and common waterhemp in Salina were observed throughout the growing season. An application of paraquat was applied as a burndown to ensure the field was clean at time of planting. Grain sorghum was planted on June 9 and June 14 at Salina (38.1 cm rows) and Hutchinson (76.2 cm rows) with the PRE herbicide applied on the following day for both locations. Once the grain sorghum reached physiological maturity, grain was harvested from 2 m of row within the plot and yield was adjusted to 13% moisture.
Soil Data Collection
In April 2016, SOM, pH, and EC data were collected using a Veris MSP3 platform. This implement utilizes coulter electrodes to measure the current that the soil conducts and a spectrometer that emits red and near-infrared wavelengths from a window that is pressed against the soil surface to measure reflectance that is later converted to SOM. EC data were collected over a depth of 0 to 30 cm and the spectrometer was placed 5 cm deep in the soil. The Veris system was pulled through the field on 10 m swaths to collect fine spatial resolution data. Calibration samples of 7.62 cm in depth were taken across each site and processed in the Kansas State Soil Testing lab to verify accuracy of soil data. The loss on ignition test was used to calculate the percentage of SOM and the hydrometer test was used to determine soil texture. Soil data were georeferenced in ArcMap 10.4.1 and map was interpolated using the Kriging tool from the spatial analyst toolbox. Average SOM and EC were calculated for each plot using the zonal statistic tool in ArcMap 10.4.1.
Herbicide Treatments and Algorithms:
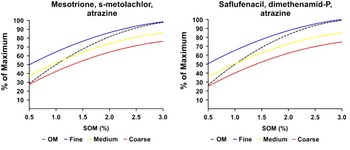
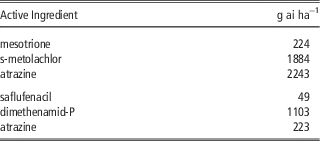
Treatments were applied with a 3.05 m boom attached to a JD 4052R tractor with a calibrated hydrostatic transmission. The speed of the tractor was manually changed to simulate VRA. Two separate tank mixes were evaluated: 1.) mesotrione, s-metolachlor, and atrazine and 2.) saflufenacil, dimethenamid-P, and atrazine. For each tank mix there were three treatments: rate based only on SOM, rate based on both SOM and texture, and a flat rate that was determined by the labeled rate of mesotrione and saflufenacil for the average soil properties of the entire research field. Treatments of predetermined flat rate were applied to compare traditional herbicide application with VRA. Flat rate treatments of mesotrione, s-metolachlor, and atrazine were 188 g ai ha−1, 1582 g ai ha−1, and 1884 g ai ha−1 respectively; and the maximum usage rate was used for all components of saflufenacil, dimethenamid-P, and atrazine. Herbicide algorithms were developed to determine the rate of both tank mixes to be applied in each plot using a second-order polynomial model with one quantitative predictor (Figure 1). Calculation of the rate for each plot was determined by the herbicide treatment which determines the equation to be used. The maximum usage rate for each component was based on maximum season usage rate from the label for grain sorghum (Table 1). VRA were based on the following equations:
The relationship between SOM and herbicide rate as a percentage of maximum usage rate for each tank mix active ingredient. Regression equations were developed using labels and predicted herbicide interactions with SOM and texture.

Maximum usage rate for each active ingredient to be used in equations to determine VRA rates

x=SOM
Y(m)=rate of mesotrione
Y(s)=rate of s−metolachlor
Y(a)=rate of atrazine
MUR(m)=maximum usage rate of mesotrione
MUR(s)=maximum usage rate of s− metolachlor
MUR(a)=maximum usage rate of atrazine
Y(sf)=rate of saflufenacil
Y(d)=rate of dimethenamid−P
Y(a2)=rate of atrazine
MUR(sf)=maximum usage rate of saflufenacil
MUR(d)=maximum usage rate of dimethenamid−p
Tank Mix: mesotrione, s-metolachlor, atrazine
Rate based on SOM:
 $$Y_{{(m,s,a)}} =\left( {{{(\!{\minus}7.56{\rm x}^{2} {\plus}54.18{\rm x}{\plus}3.34)} \over {98.55}}} \right)x\,MUR_{{(m,\,s,\,a)}} $$
Rate for fine textured soil:
 $$Y_{{(m,s,a)}} =\left( {{{(\!{\minus}4.79{\rm x}^{2} {\plus}36.24{\rm x}{\plus}32.92)} \over {98.55}}} \right)x\,MUR_{{(m,\,s,\,a)}} $$
Rate for medium textured soil:
 $$Y_{{(m,s,a)}} =\left( {{{(\!{\minus}4.79{\rm x}^{2} {\plus}36.24{\rm x}{\plus}20.37)} \over {98.55}}} \right)x\,MUR_{{(m,\,s,\,a)}} $$
Rate for coarse texture soil:
 $$ Y_{{(m,s,a)}} =\left( {{{(\!{\minus}4.79{\rm x}^{2} {\plus}36.24{\rm x}{\plus}10.79)} \over {98.55}}} \right)x\,MUR_{{(m,\,s,\,a)}} $$
Tank Mix: saflufenacil, dimethenamid-P, and atrazine
Rate based on SOM:
 $$Y_{{(sf,\,d,\,a2)}} =\left( {{{(\!{\minus}7.56{\rm x}^{2} {\plus}51.59{\rm x}{\minus}0.74)} \over {86.97}}} \right)x\,MUR_{{(sf,\,d,\,a)}} $$
Rate for fine textured soil:
 $$ Y_{{(sf,\,d,\,a2)}} =\left( {{{(\!{\minus}4.22{\rm x}^{2} {\plus}31.98{\rm x}{\plus}29.05)} \over {86.97}}} \right)x\,MUR_{{(sf,\,d,\,a)}} $$
Rate for medium textured soil:
 $$ Y_{{(sf,\,d,\,a2)}} =\left( {{{(\!{\minus}4.22{\rm x}^{2} {\plus}31.98{\rm x}{\plus}16.08)} \over {86.97}}} \right){\rm x}\,MUR_{{(sf,\,d,\,a)}} $$
Rate for coarse texture soil:
 $$Y_{{(sf,\,d,\,a)}} =\left( {{{(\!{\minus}4.22{\rm x}^{2} {\plus}31.98{\rm x}{\plus}7.07)} \over {86.97}}} \right)x\,MUR$$
Weed Control Assessment
Visual assessment of weed control (%) was taken two through eight weeks after herbicide application compared to 1.6 m untreated area next to each. In addition, aerial imagery was collected using a MicaSense RedEdge® multispectral camera attached to a DJI Matrice 100 quadcopter. The camera is a lightweight sensor (150 g) that consists of five wavelengths (blue, green, red, red edge, near infrared). The flight altitude was 40 m above ground level (AGL). Images of a white calibration panel were taken before and after each flight to normalize the imagery for data processing. All data was processed and stored using MicaSense ATLAS™ where it was later exported as multi-band Tif file. After drone imagery was processed, the TIF file was imported into ArcMap 10.4.1 where band combination was transposed from true color (Red, Green, Blue) to false-color (near-infrared, Red Edge, Red) to increase contrasts between the crops and weed within each plot. The land cover was then classified into weed, crop, soil, and shadow using the common supervised classification algorithm of maximum likelihood. Individual training sites were collected to create a separate training set for both locations to minimize error of misclassification. The fishnet tool was then utilized to measure the treated area of weeds within each plot. The zonal histogram spatial analysis tool in ArcMap 10.4.1 was used to determine number of pixels for each land cover class. The percentage of weed free area was calculated within each plot and SAS 9.4 PROC GLM was used to determine treatments differences with means being separated by LSD α=0.05.
Results and Discussion
Veris Soil Data
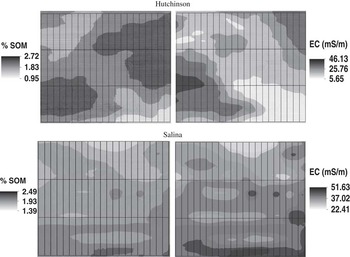
Figure 1 shows the soil data interpolated in ArcMap10.4.1. The individual plots created by the fishnet are overlaid on each map (Figure 2). In Hutchinson the soil consisted of a sandy clay loam, sandy loam, and loam based on soil with SOM varying from 0.95% to 2.72%. For Salina the soil was more uniform consisting of silt loam and silty clay loam texture with the SOM varying from 1.39% to 2.49%. To make the process applicable for producers, the EC data were correlated with the texture and divided soil into classes of coarse, medium, and fine. In Hutchinson, EC<19=Coarse, EC>19=Medium and there was no fine textured soil. In Salina, EC<15=Coarse, 15<EC<30=Medium, and EC>30=Fine.
Interpolated Veris data with percentage of SOM (left) and EC (right) with gridlines created by georeferenced fishnet tool representing the plots.

Visual weed assessment
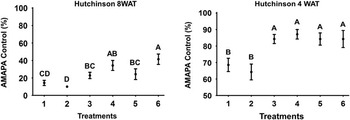
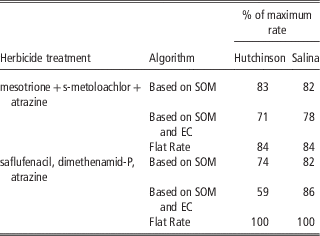
When comparing treatments at Salina, VRA provided the same amount of weed control as the flat rate for both tank mixes. At four weeks after treatment (WAT), all herbicide treatments provided adequate control (95%) of Palmer amaranth and common waterhemp. By eight WAT, all treatments continued to provide the same amount of control (80%). This was expected as both tank mixes are known to provide excellent pigweed control and timely rainfall activated herbicide in the soil. In Hutchinson the results were different, as the weed control was much more variable across treatments. The dense population of weeds combined with extended emergence throughout the growing system limited the amount of residual herbicide available to actively control the weeds later in the season. VRA applications of mesotrione, s-metolachlor, and atrazine provided the same amount of control compared to the flat rate at four WAT (Figure 3). VRA of saflufenacil, dimethenamid-P, and atrazine provided less weed control compared to flat rate treatments, but the average herbicide was greatly reduced. VRA reduced the herbicide applied by 26% and 41% for the treatments based on SOM and both SOM and EC, respectively (Table 2). By eight WAT efficacy of all treatments was greatly reduced, and VRA determined by SOM and EC were the least effective. The average rate applied for the three VRA treatments was greatly reduced when using algorithms.
Palmer amaranth (AMAPA) control four and eight WAT. Letters represent the letter of separation using Fisher’s Protected LSD α=0.05.

Average rate of herbicide applied for each algorithm based on % of maximum rate.

Multi-spectral weed assessment
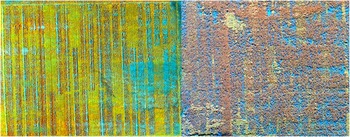
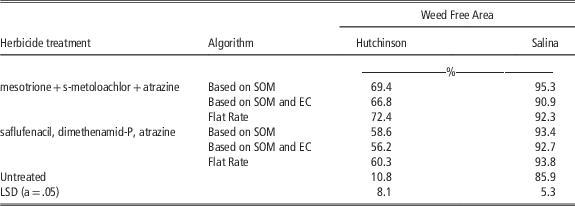
After classification of multi-spectral imagery, it was clear that the spectral signatures of weeds are greatly different than grain sorghum (Figure 4). When comparing treatments, the VRA for both tank mixes provided the same amount of weed control as the flat rate at both locations at four WAT (Table 3). At this early point in the growing season, weeds were all less than one meter tall.
False-color (near-infrared, Red Edge, Red) images of Hutchinson (left) and Salina (right) four weeks after herbicide treatments. Untreated checks and plots can be seen in areas throughout the field.

Conclusions
Site specific weed management using soil-applied herbicides is not a new idea but there has been limited research on implementing the technology in the field. The Veris sensor provided accurate SOM and EC maps to allow for VRA of soil-applied herbicides. When comparing flat rate treatments with the algorithm-based treatments it was important to understand that herbicide rates were lower with all VRA due to coarse texture and areas of low SOM. Even with lower application rates, three of the VRA treatments provided the same amount of weed control as the higher flat rate applications. This procedure could be implemented to reduce herbicide load on the environment with more appropriate herbicide application rates. Using multi-spectral imagery for calculating efficacy of herbicide was effective, providing supporting data that is much more precise. Visual assessment is very important in the weed science field and the use of sUAS may provide a better solution to determine weed control. As crop canopy closes, the ease of weed classification becomes much more difficult. Future research will be conducted across more field locations with higher amounts of soil variability to better understand if procedure is appropriate. Variability within each plot must be minimized in future research to make sure the correct application rate is being applied throughout the entire plot.
Efficacy of herbicide treatments based on weed-free area within each plot.

Acknowledgments
We appreciate the funding from USDA-NIFA-AFRI Exploratory Grant # 2016-67030-249566 and Gary Cramer and Tyler Lund for providing fields for experiment.