1 Introduction
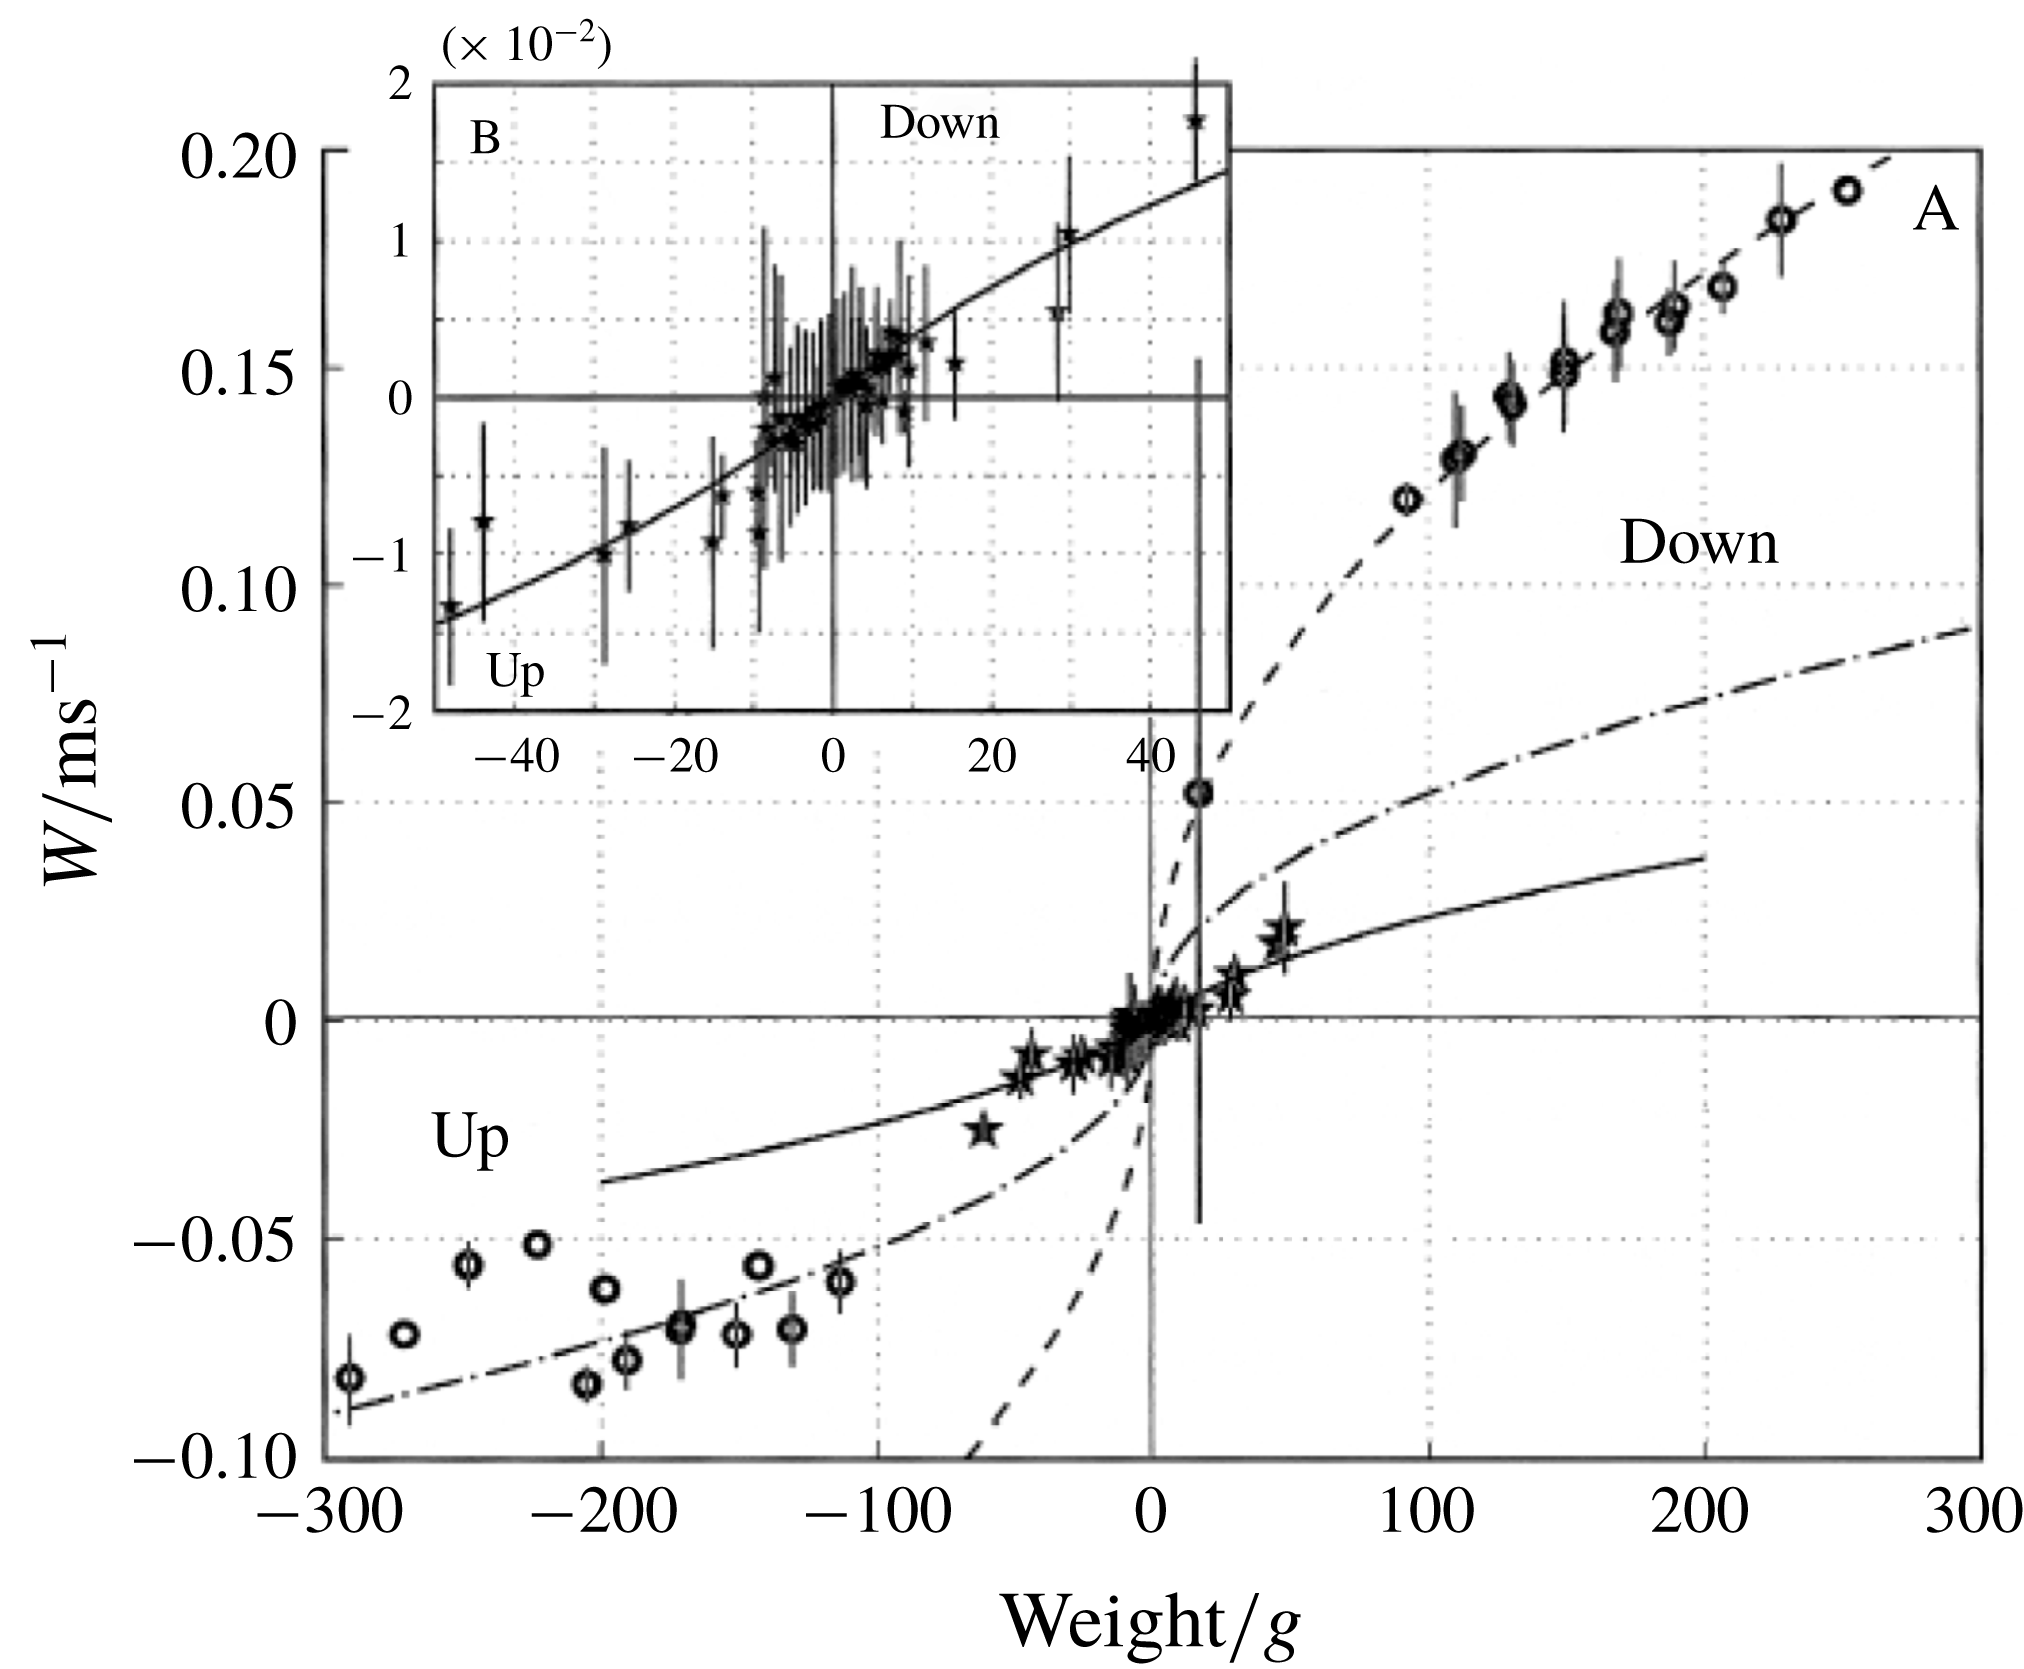
Plankton, marine snow and Lagrangian floats drifting in oceans and estuaries, as well as aerosols, dust, volcanic ash and balloons transported in the lower atmosphere, move in fluid media which locally exhibit large density gradients, owing to inhomogeneities in the vertical distribution of salt and/or temperature. Since they act as barriers hampering vertical motions, these inhomogeneous layers, referred to as ‘haloclines’ and ‘thermoclines’ in the case of salinity and temperature gradients, respectively, deeply affect the settling/ascent rate, accumulation and dispersion of inert bodies and living organisms in oceans and lakes (Riebesell Reference Riebesell1992; MacIntyre, Alldredge & Gotschalk Reference MacIntyre, Alldredge and Gotschalk1995; Bergström & Strömberg Reference Bergström and Strömberg1997; Condie & Bormans Reference Condie and Bormans1997; Widder et al. Reference Widder, Johnsen, Bernstein, Case and Neilson1999; Alldredge et al. Reference Alldredge, Cowles, MacIntyre, Rines, Donaghay, Greenlaw, Holliday, Dekshenieks, Sullivan and Zaneveld2002; Sutor & Dagg Reference Sutor and Dagg2008) and atmospheric inversions (Kellogg Reference Kellogg, Bach, Pankrath and Williams1980; Yajima et al. Reference Yajima, Imamura, Izutsu and Abe2004; Burns & Chemel Reference Burns and Chemel2015). Identification and modelling of fundamental mechanical processes at work in these stratified layers is thus of direct relevance to a better understanding of several key aspects of oceanic biochemical cycling (Denman & Gargett Reference Denman and Gargett1995), climate variability (Turco et al. Reference Turco, Toon, Ackerman, Pollack and Sagan1990) and measurement bias in observing systems (D’Asaro 2003; Bewley & Meneghello Reference Bewley and Meneghello2016).
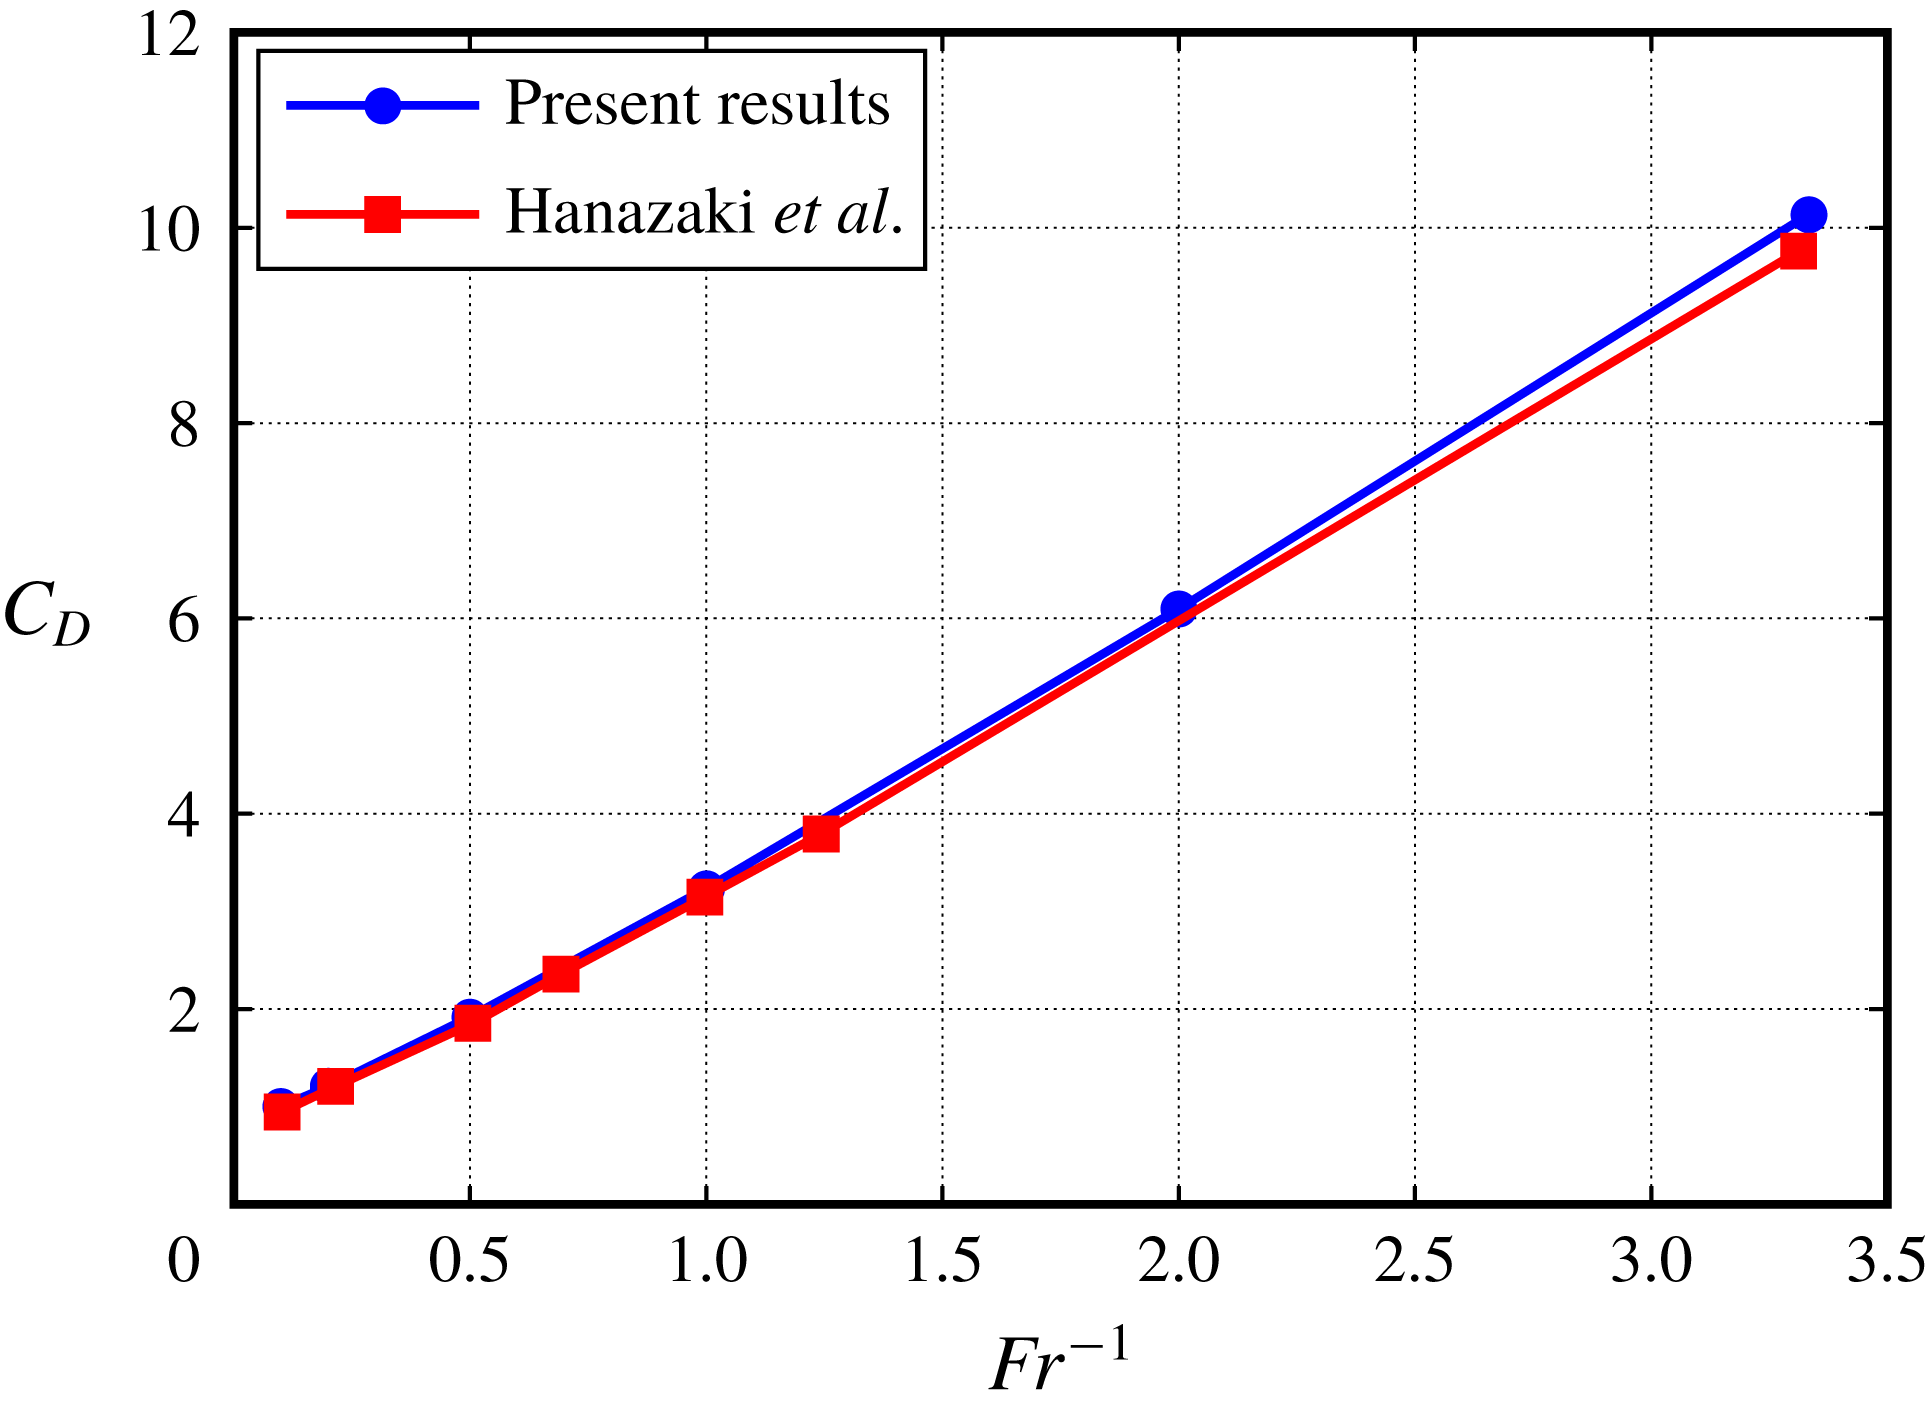
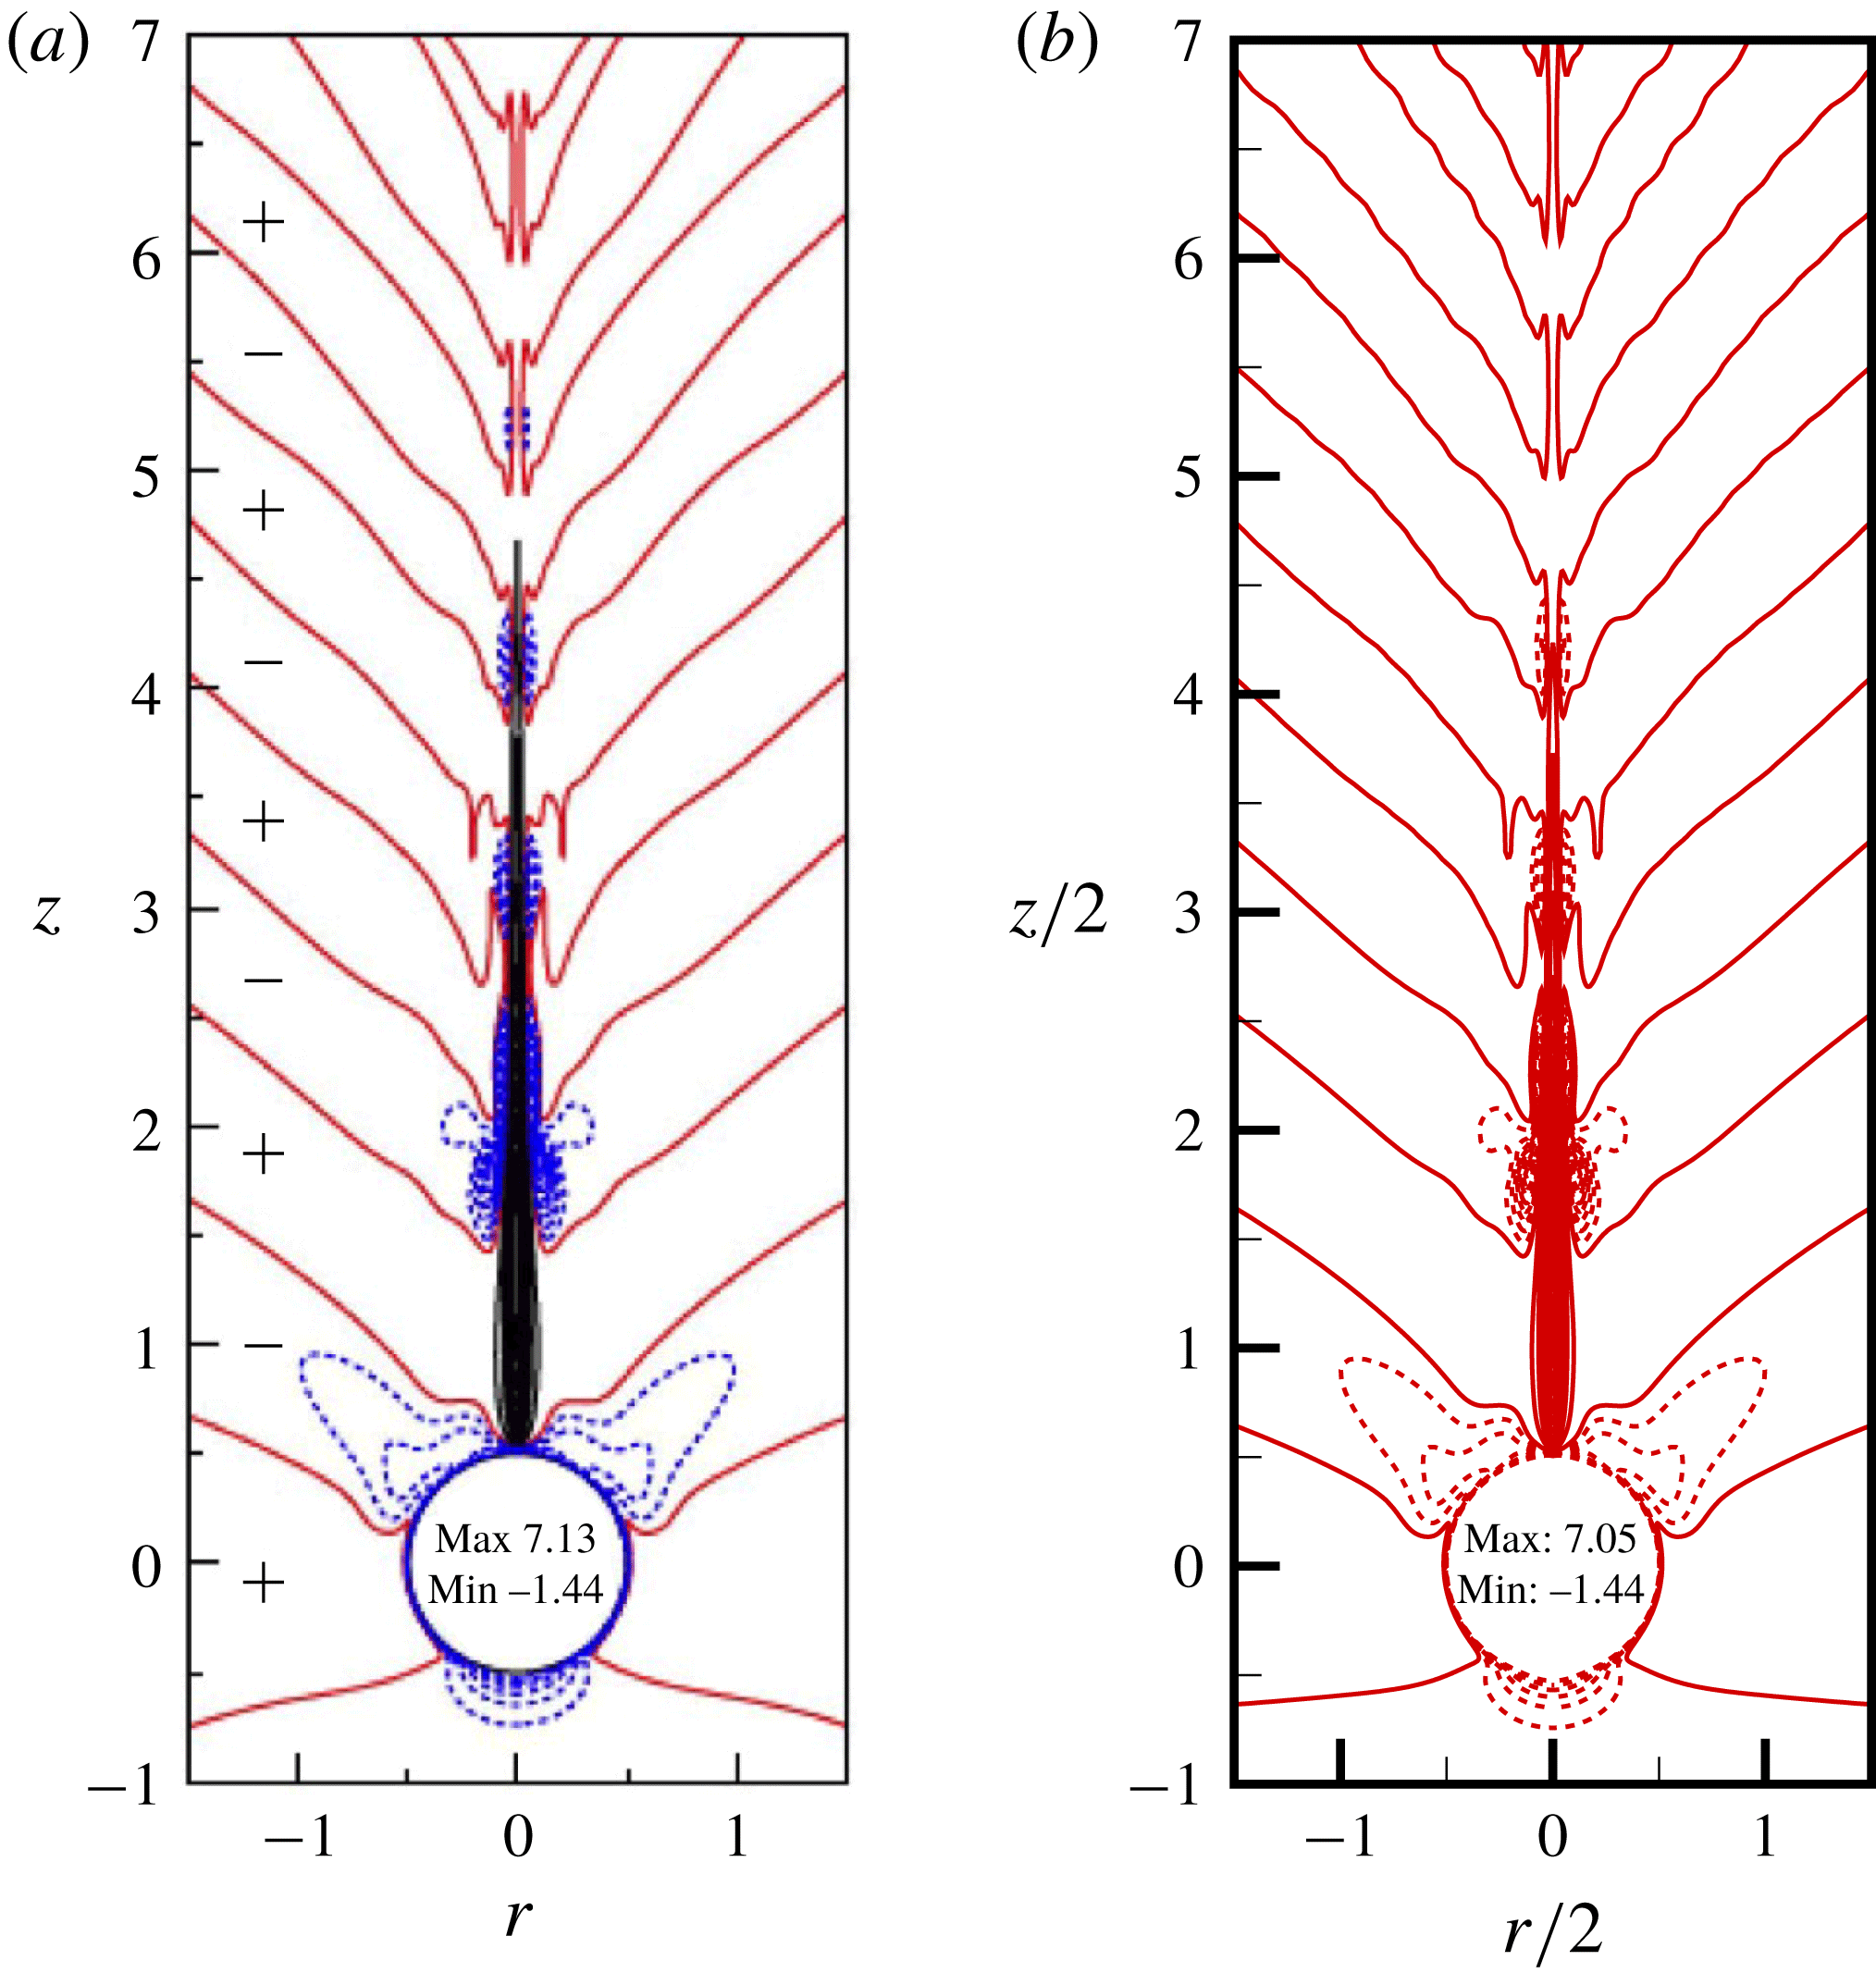
To this end, the canonical situation of a rigid sphere moving vertically in a stratified environment has concentrated attention over the last two decades. Controlled laboratory experiments (Srdic-Mitrovic, Mohamed & Fernando Reference Srdic-Mitrovic, Mohamed and Fernando1999; Abaid et al. Reference Abaid, Adalsteinsson, Agyapong and McLaughlin2004; Camassa et al. Reference Camassa, Falcon, Lin, McLaughlin and Parker2009; Hanazaki, Kashimoto & Okamura Reference Hanazaki, Kashimoto and Okamura2009a ; Yick et al. Reference Yick, Torres, Peacock and Stocker2009) and direct numerical simulation of primitive equations (Torres et al. Reference Torres, Hanazaki, Ochoa, Castillo and Van Woert2000; Hanazaki, Konishi & Okamura Reference Hanazaki, Konishi and Okamura2009b ; Hanazaki, Nakamura & Yoshikawa Reference Hanazaki, Nakamura and Yoshikawa2015) considered either linearly stratified backgrounds or homogeneous fluid layers separated by a sharply stratified region. These investigations consistently concluded that the sphere motion distorts the originally horizontal isopycnals, dragging light fluid downwards over distances frequently much larger than the body size. As a result, the drag resisting the body settling increases compared to that measured in a homogeneous fluid. In the presence of a strong stratification, the drag may increase by more than one order of magnitude (Srdic-Mitrovic et al. Reference Srdic-Mitrovic, Mohamed and Fernando1999; Torres et al. Reference Torres, Hanazaki, Ochoa, Castillo and Van Woert2000), yielding residence times within the stratified layer much longer than those predicted on the basis of standard drag laws. Asymptotic predictions for this drag increase have been derived under various approximations in the limit of negligible (Zvirin & Chadwick Reference Zvirin and Chadwick1975; Camassa et al. Reference Camassa, Falcon, Lin, McLaughlin and Mykins2010; Candelier, Mehaddi & Vauquelin Reference Candelier, Mehaddi and Vauquelin2014) or weak (Mehaddi, Candelier & Mehling Reference Mehaddi, Candelier and Mehling2018) inertial effects. However, these theoretical predictions all assume that stratification only provides a small correction to the total drag, which is far from the realm of most field conditions. Empirical models aimed at dealing with more general conditions have been proposed, based on the intuitive idea that the drag enhancement results from the additional buoyancy provided by the volume of light fluid dragged by the body. However, no consensus has been reached yet on a suitable definition of this volume capable of providing realistic estimates of the drag in both viscosity-dominated (Yick et al. Reference Yick, Torres, Peacock and Stocker2009) and inertia-dominated regimes (Srdic-Mitrovic et al. Reference Srdic-Mitrovic, Mohamed and Fernando1999; Higginson, Dalziel & Linden Reference Higginson, Dalziel and Linden2003).
This unsatisfactory situation suggests that the actual cause of the stratification-induced drag increase has not been properly identified yet. The primary aim of this paper is to get new insight into this problem by applying a rigorous mathematical decomposition valid irrespective of the relative magnitude of inertial, viscous, diffusive and buoyancy effects to the velocity and pressure fields obtained by directly simulating the flow configuration described above. The governing equations and the decomposition scheme are established in § 2. Numerical data covering contrasting flow regimes are discussed in § 3, before the various buoyancy-induced contributions to the drag are extracted through the splitting procedure. Depending on flow conditions, these contributions are found to exhibit markedly different variations with the control parameters. To interpret the observed features, the scaling laws obeyed by each of these contributions are derived in § 4 by examining the dominant balances in the governing equations. Section 5 summarizes the main outcomes of the paper. Details of the numerical procedure and validation tests are discussed in appendix A. Applicability of predictions provided in the paper to realistic situations of geophysical and engineering interest is examined in appendix B.
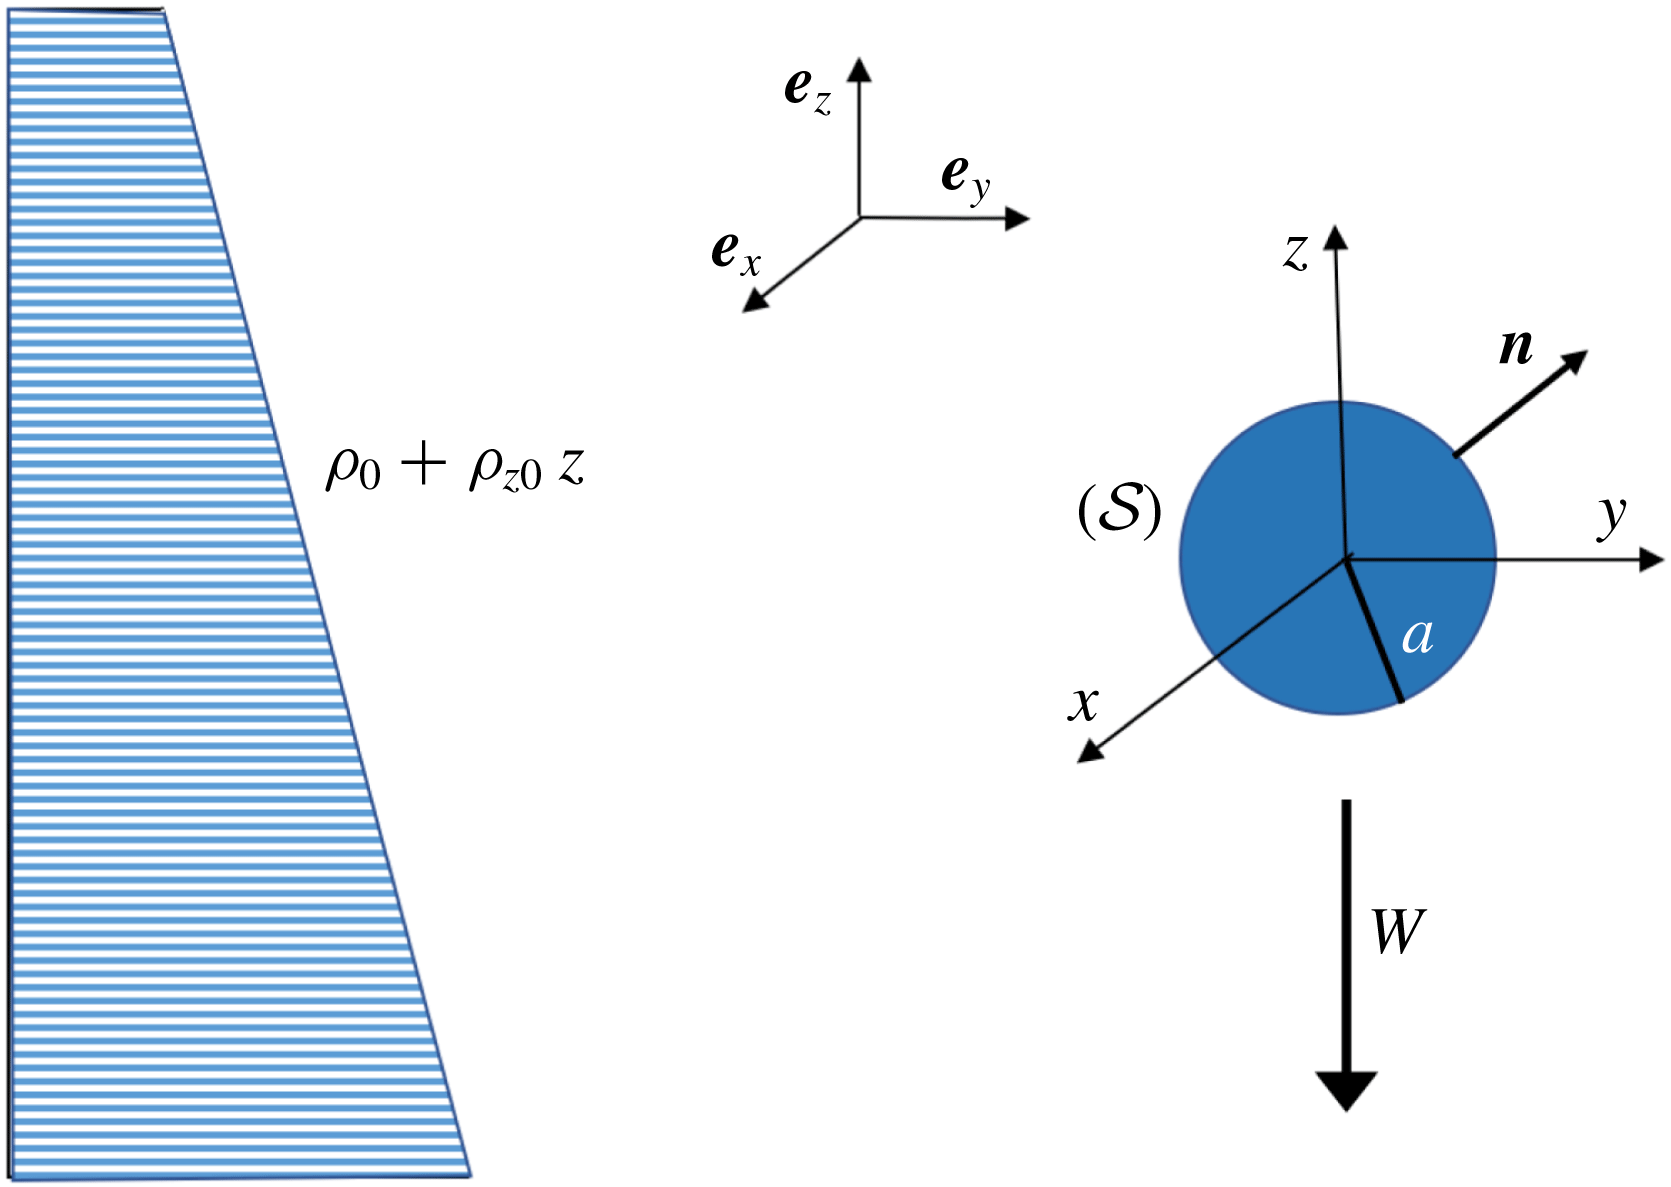
Sketch of the considered flow configuration.

2 Mathematical model and force decomposition
We consider a rigid body with characteristic size
 $a$
settling with constant velocity
 $-W\boldsymbol{e}_{z}$
through a linearly stratified Newtonian fluid with reference density
 $\unicode[STIX]{x1D70C}_{0}$
and prescribed vertical density gradient
 $\unicode[STIX]{x1D70C}_{z0}<0$
,
 $\boldsymbol{e}_{z}$
denoting the unit vector pointing upward (see figure 1). We assume the fluid to have constant viscosity,
 $\unicode[STIX]{x1D707}$
, and molecular diffusivity,
 $\unicode[STIX]{x1D705}$
, and normalize lengths, velocities, time and contributions to the pressure and density fields by
 $a$
,
 $W$
,
 $a/W$
,
 $\unicode[STIX]{x1D70C}_{0}W^{2}$
and
 $-a\unicode[STIX]{x1D70C}_{z0}$
, respectively. In a system of axes translating with the body, the velocity at time
 $t$
and position
 $\boldsymbol{x}=(x,\,y,\,z)$
from the body centroid (with
 $z$
along the ascending vertical) is
 $\boldsymbol{u}(\boldsymbol{x},t)$
and the density difference with respect to the reference density
 $\unicode[STIX]{x1D70C}_{0}$
is
 $t-z+\unicode[STIX]{x1D70C}(\boldsymbol{x},t)$
,
 $\unicode[STIX]{x1D70C}$
standing for the density disturbance. In the framework of the Boussinesq approximation, the governing equations for
 $\unicode[STIX]{x1D70C}$
and
 $\boldsymbol{u}$
then write as (Torres et al.
Reference Torres, Hanazaki, Ochoa, Castillo and Van Woert2000; Hanazaki et al.
Reference Hanazaki, Nakamura and Yoshikawa2015)
 $$\begin{eqnarray}\displaystyle & \displaystyle \unicode[STIX]{x1D735}\boldsymbol{\cdot }\boldsymbol{u}=0, & \displaystyle\end{eqnarray}$$
 $$\begin{eqnarray}\displaystyle & \displaystyle \unicode[STIX]{x2202}_{t}\unicode[STIX]{x1D70C}+\boldsymbol{u}\boldsymbol{\cdot }\unicode[STIX]{x1D735}\unicode[STIX]{x1D70C}=\boldsymbol{u}\boldsymbol{\cdot }\boldsymbol{e}_{z}-1+Pe^{-1}\unicode[STIX]{x1D6FB}^{2}\unicode[STIX]{x1D70C}, & \displaystyle\end{eqnarray}$$
 $$\begin{eqnarray}\displaystyle & \displaystyle \unicode[STIX]{x2202}_{t}\boldsymbol{u}+\boldsymbol{u}\boldsymbol{\cdot }\unicode[STIX]{x1D735}\boldsymbol{u}=-\unicode[STIX]{x1D735}p-Fr^{-2}\unicode[STIX]{x1D70C}\boldsymbol{e}_{z}+Re^{-1}\unicode[STIX]{x1D6FB}^{2}\boldsymbol{u}. & \displaystyle\end{eqnarray}$$
Equations (2.2) and (2.3) involve the Péclet and Reynolds numbers respectively characterizing the relative magnitude of advective and diffusive effects in density and momentum balances,
 $Pe=Wa/\unicode[STIX]{x1D705}$
and
 $Re=Wa/\unicode[STIX]{x1D708}$
(with
 $\unicode[STIX]{x1D708}=\unicode[STIX]{x1D707}/\unicode[STIX]{x1D70C}_{0}$
), the ratio of which is the Prandtl number,
 $Pr=\unicode[STIX]{x1D708}/\unicode[STIX]{x1D705}$
. The ratio of inertial to buoyancy effects is characterized by the Froude number,
 $Fr=W/(Na)$
, where
 $N=(-g\unicode[STIX]{x1D70C}_{z0}/\unicode[STIX]{x1D70C}_{0})^{1/2}$
is the Brunt–Väisälä frequency,
 $g$
denoting gravity. The hydrostatic pressure component
 $-(ga/W^{2})z+Fr^{-2}(z^{2}/2-zt)$
is incorporated within the pressure
 $p$
. With the above definition of
 $\unicode[STIX]{x1D70C}$
, the total density gradient is
 $\unicode[STIX]{x1D735}\unicode[STIX]{x1D70C}-\boldsymbol{e}_{z}$
. Hence, at the body surface
 $({\mathcal{S}})$
, the no-flux and no-slip boundary conditions imply
 $$\begin{eqnarray}\boldsymbol{n}\boldsymbol{\cdot }\unicode[STIX]{x1D735}\unicode[STIX]{x1D70C}=\boldsymbol{n}\boldsymbol{\cdot }\boldsymbol{e}_{z}\quad \text{and}\quad \boldsymbol{u}=\mathbf{0}\quad \text{on }({\mathcal{S}}),\end{eqnarray}$$
where
 $\boldsymbol{n}$
stands for the unit normal directed into the fluid. As disturbances vanish in the far field,
 $\unicode[STIX]{x1D70C}$
and
 $\boldsymbol{u}$
also obey
 $$\begin{eqnarray}\unicode[STIX]{x1D70C}\rightarrow 0,\quad \text{and}\quad \boldsymbol{u}\rightarrow \boldsymbol{e}_{z}\quad \text{for }||\boldsymbol{x}||\rightarrow \infty .\end{eqnarray}$$
To reveal the mechanisms governing the drag increase, we split the velocity and pressure fields in the form
 $\boldsymbol{u}=\boldsymbol{u}_{w}+\boldsymbol{u}_{\unicode[STIX]{x1D70C}},\,p=p_{w}+p_{\unicode[STIX]{x1D70C}}$
with
 $$\begin{eqnarray}\displaystyle & \displaystyle \unicode[STIX]{x1D735}\boldsymbol{\cdot }\boldsymbol{u}_{w}=0, & \displaystyle\end{eqnarray}$$
 $$\begin{eqnarray}\displaystyle & \displaystyle \unicode[STIX]{x2202}_{t}\boldsymbol{u}_{w}+\boldsymbol{u}_{w}\boldsymbol{\cdot }\unicode[STIX]{x1D735}\boldsymbol{u}_{w}=-\unicode[STIX]{x1D735}p_{w}+Re^{-1}\unicode[STIX]{x1D6FB}^{2}\boldsymbol{u}_{w}, & \displaystyle\end{eqnarray}$$
 $$\begin{eqnarray}\boldsymbol{u}_{w}=\mathbf{0}\quad \text{on }({\mathcal{S}}),\quad \text{and}\quad \boldsymbol{u}_{w}\rightarrow \boldsymbol{e}_{z}\quad \text{for }||\boldsymbol{x}||\rightarrow \infty ,\end{eqnarray}$$
 $$\begin{eqnarray}\displaystyle & \displaystyle \unicode[STIX]{x1D735}\boldsymbol{\cdot }\boldsymbol{u}_{\unicode[STIX]{x1D70C}}=0, & \displaystyle\end{eqnarray}$$
 $$\begin{eqnarray}\displaystyle & \displaystyle \unicode[STIX]{x2202}_{t}\boldsymbol{u}_{\unicode[STIX]{x1D70C}}+(\boldsymbol{u}_{\unicode[STIX]{x1D70C}}+\boldsymbol{u}_{w})\boldsymbol{\cdot }\unicode[STIX]{x1D735}\boldsymbol{u}_{\unicode[STIX]{x1D70C}}+\boldsymbol{u}_{\unicode[STIX]{x1D70C}}\boldsymbol{\cdot }\unicode[STIX]{x1D735}\boldsymbol{u}_{w}=-\unicode[STIX]{x1D735}p_{\unicode[STIX]{x1D70C}}-Fr^{-2}\unicode[STIX]{x1D70C}\boldsymbol{e}_{z}+Re^{-1}\unicode[STIX]{x1D6FB}^{2}\boldsymbol{u}_{\unicode[STIX]{x1D70C}}, & \displaystyle\end{eqnarray}$$
 $$\begin{eqnarray}\boldsymbol{u}_{\unicode[STIX]{x1D70C}}=\mathbf{0}\quad \text{on }({\mathcal{S}}),\quad \text{and}\quad \boldsymbol{u}_{\unicode[STIX]{x1D70C}}\rightarrow \mathbf{0}\quad \text{for }||\boldsymbol{x}||\rightarrow \infty .\end{eqnarray}$$
Equations (2.6)–(2.8) govern the dynamical problem corresponding to the body translation in a homogeneous fluid. In contrast, equations (2.9)–(2.11) govern the velocity disturbance,
 $\boldsymbol{u}_{\unicode[STIX]{x1D70C}}$
, induced by buoyancy effects. This disturbance carries a non-zero vorticity,
 $\unicode[STIX]{x1D74E}_{\unicode[STIX]{x1D70C}}=\unicode[STIX]{x1D735}\times \boldsymbol{u}_{\unicode[STIX]{x1D70C}}$
, which originates in the baroclinic torque,
 $Fr^{-2}\boldsymbol{e}_{z}\times \unicode[STIX]{x1D735}\unicode[STIX]{x1D70C}$
, resulting from the distortion of the isopycnals. As the stress tensor
 $\unicode[STIX]{x1D64F}=-p\mathbb{I}+Re^{-1}(\unicode[STIX]{x1D735}\boldsymbol{u}+\unicode[STIX]{x1D735}\boldsymbol{u}^{\text{T}})$
(
 $\unicode[STIX]{x1D644}$
denoting the Kronecker tensor) is a linear function of
 $\boldsymbol{u}$
and
 $p$
, the hydrodynamic force acting on the body,
 $\boldsymbol{F}=\int _{{\mathcal{S}}}\unicode[STIX]{x1D64F}\boldsymbol{\cdot }\boldsymbol{n}\,\text{d}{\mathcal{S}}$
, is the sum of the settling-induced contribution due to
 $(\boldsymbol{u}_{w},\,p_{w})$
, which it would experience in the absence of any stratification, and the buoyancy-induced contribution resulting from
 $(\boldsymbol{u}_{\unicode[STIX]{x1D70C}},\,p_{\unicode[STIX]{x1D70C}})$
.
The central idea is then to examine how and to which extent the various mechanisms involved in (2.10) alter the stress distribution on (
 ${\mathcal{S}}$
), hence the force on the body, for a given distribution of the density disturbance. To this end, we first notice that, owing to the divergence-free condition (2.9), (2.10) involves only two non-solenoidal contributions: one corresponds to the non-zero flux of the advective term, as is customary with the Navier–Stokes equations, while the other originates in the vertical variation of the density disturbance. For this reason, it is appropriate to split the buoyancy-induced pressure disturbance in the form
 $p_{\unicode[STIX]{x1D70C}}=p_{\unicode[STIX]{x1D70C}\unicode[STIX]{x03C9}}+p_{\unicode[STIX]{x1D70C}\unicode[STIX]{x1D70C}}+p_{\unicode[STIX]{x1D70C}u}$
, where
 $p_{\unicode[STIX]{x1D70C}\unicode[STIX]{x03C9}}$
obeys a Laplace equation, while the other two contributions respectively satisfy
 $$\begin{eqnarray}\displaystyle & \displaystyle \unicode[STIX]{x1D6FB}^{2}p_{\unicode[STIX]{x1D70C}\unicode[STIX]{x1D70C}}=-Fr^{-2}\unicode[STIX]{x1D735}\unicode[STIX]{x1D70C}\boldsymbol{\cdot }\boldsymbol{e}_{z}, & \displaystyle\end{eqnarray}$$
 $$\begin{eqnarray}\displaystyle & \displaystyle \boldsymbol{n}\boldsymbol{\cdot }\unicode[STIX]{x1D735}p_{\unicode[STIX]{x1D70C}\unicode[STIX]{x1D70C}}=-Fr^{-2}\unicode[STIX]{x1D70C}\boldsymbol{n}\boldsymbol{\cdot }\boldsymbol{e}_{z}\quad \text{on }({\mathcal{S}}), & \displaystyle\end{eqnarray}$$
 $$\begin{eqnarray}\displaystyle & \displaystyle \unicode[STIX]{x1D6FB}^{2}p_{\unicode[STIX]{x1D70C}\text{u}}=-\unicode[STIX]{x1D735}\boldsymbol{\cdot }\{(\boldsymbol{u}_{\unicode[STIX]{x1D70C}}+\boldsymbol{u}_{w})\boldsymbol{\cdot }\unicode[STIX]{x1D735}\boldsymbol{u}_{\unicode[STIX]{x1D70C}}+\boldsymbol{u}_{\unicode[STIX]{x1D70C}}\boldsymbol{\cdot }\unicode[STIX]{x1D735}\boldsymbol{u}_{w}\}, & \displaystyle\end{eqnarray}$$
 $$\begin{eqnarray}\displaystyle & \displaystyle \boldsymbol{n}\boldsymbol{\cdot }\unicode[STIX]{x1D735}p_{\unicode[STIX]{x1D70C}\text{u}}=0\quad \text{on }({\mathcal{S}}), & \displaystyle\end{eqnarray}$$
with
 $p_{\unicode[STIX]{x1D70C}\unicode[STIX]{x1D70C}}$
and
 $p_{\unicode[STIX]{x1D70C}\text{u}}$
vanishing for
 $||\boldsymbol{x}||\rightarrow \infty$
. Although not unique, boundary conditions (2.13) and (2.15) arise naturally from the projection of (2.10) onto
 $({\mathcal{S}})$
.
To get new insight into the various contributions to the force
 $\boldsymbol{F}$
, we employ the following procedure. Using direct numerical simulation (DNS), we first compute the flow and density fields governed by (2.1)–(2.5), and, in a separate run, the ‘homogeneous’ flow field obeying (2.6)–(2.8). Integration over
 $({\mathcal{S}})$
of stresses obtained during this first step provides
 $\boldsymbol{F}$
and its ‘homogeneous’ counterpart,
 $\boldsymbol{F}_{w}$
. Subtracting
 $(\boldsymbol{u}_{w},p_{w})$
from
 $(\boldsymbol{u},p)$
at the same instant of time yields the buoyancy-induced velocity and pressure fields,
 $\boldsymbol{u}_{\unicode[STIX]{x1D70C}}$
and
 $p_{\unicode[STIX]{x1D70C}}$
. Making use of the density field,
 $\unicode[STIX]{x1D70C}$
, and evaluating terms involved in the right-hand side of (2.14), we then solve the two Poisson problems (2.12)–(2.13) and (2.14)–(2.15), which yields the pressure fields
 $p_{\unicode[STIX]{x1D70C}\unicode[STIX]{x1D70C}}$
and
 $p_{\unicode[STIX]{x1D70C}\text{u}}$
, respectively. Last, we evaluate the excess force due to stratification effects,
 $\boldsymbol{F}_{\unicode[STIX]{x1D70C}}=\boldsymbol{F}-\boldsymbol{F}_{w}$
, as
 $$\begin{eqnarray}\boldsymbol{F}_{\unicode[STIX]{x1D70C}}=-\underbrace{\int _{{\mathcal{S}}}p_{\unicode[STIX]{x1D70C}\unicode[STIX]{x1D70C}}\boldsymbol{n}\,\text{d}{\mathcal{S}}}_{\boldsymbol{F}_{\unicode[STIX]{x1D70C}\unicode[STIX]{x1D70C}}}-\underbrace{\int _{{\mathcal{S}}}p_{\unicode[STIX]{x1D70C}\text{u}}\boldsymbol{n}\,\text{d}{\mathcal{S}}}_{\boldsymbol{F}_{\unicode[STIX]{x1D70C}u}}+\underbrace{\int _{{\mathcal{S}}}\unicode[STIX]{x1D64F}_{\unicode[STIX]{x1D70C}\unicode[STIX]{x03C9}}\boldsymbol{\cdot }\boldsymbol{n}\,\text{d}{\mathcal{S}}}_{\boldsymbol{F}_{\unicode[STIX]{x1D70C}\unicode[STIX]{x1D714}}},\end{eqnarray}$$
with
 $\unicode[STIX]{x1D64F}_{\unicode[STIX]{x1D70C}\unicode[STIX]{x03C9}}=-p_{\unicode[STIX]{x1D70C}\unicode[STIX]{x03C9}}\mathbb{I}+Re^{-1}(\unicode[STIX]{x1D735}\boldsymbol{u}_{\unicode[STIX]{x1D746}}+\unicode[STIX]{x1D735}\boldsymbol{u}_{\unicode[STIX]{x1D70C}}^{\text{T}})$
, the superscript
 $^{\text{T}}$
denoting the transpose. The contribution
 $\boldsymbol{F}_{\unicode[STIX]{x1D70C}\unicode[STIX]{x1D70C}}$
in (2.16) may be thought of as an additional Archimedes force due to the non-zero pressure gradient induced by the deflection of the isopycnals round the body, while
 $\boldsymbol{F}_{\unicode[STIX]{x1D70C}u}$
is an inertial force resulting from the momentum flux associated with the velocity field
 $\boldsymbol{u}_{\unicode[STIX]{x1D70C}}$
when
 $Re\neq 0$
. Last,
 $p_{\unicode[STIX]{x1D70C}\unicode[STIX]{x03C9}}=p_{\unicode[STIX]{x1D70C}}-(p_{\unicode[STIX]{x1D70C}\unicode[STIX]{x1D70C}}+p_{\unicode[STIX]{x1D70C}u})$
is entirely determined by the solenoidal contributions to (2.10). Moreover the divergence-free condition (2.9) combined with the no-slip condition in (2.11) imply
 $(\unicode[STIX]{x1D735}\boldsymbol{u}_{\unicode[STIX]{x1D70C}}+\unicode[STIX]{x1D735}\boldsymbol{u}_{\unicode[STIX]{x1D70C}}^{\text{T}})\boldsymbol{\cdot }\boldsymbol{n}=\unicode[STIX]{x1D74E}_{\unicode[STIX]{x1D70C}}\times \boldsymbol{n}$
on
 $({\mathcal{S}})$
(see e.g. equation (A11) in Magnaudet (Reference Magnaudet2011)). Hence
 $\boldsymbol{F}_{\unicode[STIX]{x1D70C}\unicode[STIX]{x1D714}}$
represents the entire force due to the vorticity
 $\unicode[STIX]{x1D74E}_{\unicode[STIX]{x1D70C}}$
induced by the baroclinic torque.
The two contributions
 $\boldsymbol{F}_{\unicode[STIX]{x1D70C}\unicode[STIX]{x1D70C}}$
and
 $\boldsymbol{F}_{\unicode[STIX]{x1D70C}\unicode[STIX]{x1D714}}$
are the two sides of the same coin, as they both result from the misalignment between the pressure and density gradients. However, this misalignment manifests itself in two different ways. On the one hand it distorts the vortex lines about the body, which in turn modifies the vorticity, hence the shear stress at the body surface, yielding the drag contribution
 $\boldsymbol{F}_{\unicode[STIX]{x1D70C}\unicode[STIX]{x1D714}}$
. On the other hand, the deflection of isopycnals round the body results in the net dragging of a volume of ‘light’ fluid within which the density at every vertical position is smaller than that of the surrounding fluid. This entrainment, responsible for the drag contribution
 $\boldsymbol{F}_{\unicode[STIX]{x1D70C}\unicode[STIX]{x1D70C}}$
, is the mechanism on which the semi-empirical modelling effort (Srdic-Mitrovic et al.
Reference Srdic-Mitrovic, Mohamed and Fernando1999; Higginson et al.
Reference Higginson, Dalziel and Linden2003; Yick et al.
Reference Yick, Torres, Peacock and Stocker2009) has focused up to now.
3 Simulation results
We now apply the above methodology to the flow induced by a settling sphere (from now on,
 $a$
is the sphere radius). Details about the numerical approach used to solve (2.1)–(2.5) and extensive validation tests are provided in appendix A. We select
 $Pr=0.7,\,7$
and
 $700$
, corresponding to the diffusion of heat in the atmosphere, and that of heat and salt in water under standard conditions, respectively. We consider the parameter range
 $0.05\leqslant Re\leqslant 100$
,
 $0.1\leqslant Fr\leqslant 10$
, assuming that the flow is axisymmetric throughout that range. The representativity of this parameter range with respect to field and laboratory conditions, i.e. the relative density range under which gravity/buoyancy-driven bodies may effectively experience
 $\mathit{O}(1)$
-Froude numbers when their Reynolds number lies in the above interval, is discussed in appendix B.
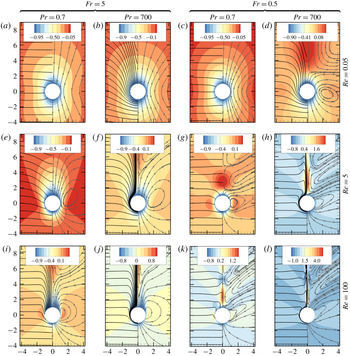
Influence of
 $Re,\,Fr$
and
 $Pr$
on the flow structure. Colours: iso-levels of the vertical velocity,
 $\boldsymbol{u}\boldsymbol{\cdot }\boldsymbol{e}_{z}-1$
, in the laboratory frame; solid lines: isopycnals,
 $\unicode[STIX]{x1D70C}-z=\text{const}.$
(left half), and streamlines (right half).

3.1 Flow field
Figure 2 displays isopycnals, streamlines and levels of the vertical velocity,
 $\boldsymbol{u}\boldsymbol{\cdot }\boldsymbol{e}_{z}-1$
, about the sphere for selected values of
 $Re,\,Fr$
and
 $Pr$
.
When viscous diffusion dominates momentum transport (figure 2
a–d), isopycnals are significantly distorted by the passing sphere only when
 $Pe\gg 1$
, i.e. for large enough
 $Pr$
(figure 2
b,d). In this case, the top-down symmetry of the velocity field is almost unaffected when
 $Fr\gg 1$
(figure 2
b), whereas no such symmetry subsists when
 $Fr\lesssim 1$
(figure 2
d). Instead, for low
 $Fr$
, a region with upward absolute velocities
 $\boldsymbol{u}\boldsymbol{\cdot }\boldsymbol{e}_{z}-1>0$
takes place at some distance downstream of the sphere. This specific structure is driven by the baroclinic torque which converts the positive radial density gradient encountered within the fluid column dragged by the sphere into a vortex ring with positive azimuthal vorticity, i.e. upward velocities near the symmetry axis. Decreasing
 $Fr$
and/or increasing
 $Pr$
increases the curvature of the streamlines (figures 2
b and 2
c), which yields closed flow regions (i.e. toroidal eddies) with size comparable to the body length when the vertical confinement imposed by the stratification is strong enough (figure 2
d).
In inertia-dominated situations (figure 2
e–l), the lower
 $Fr$
and the larger
 $Re$
and
 $Pr$
, the thinner the dragged fluid column and the larger the upward velocity on the wake axis. With
 $Fr=0.5$
and
 $Pr=700$
(figures 2
h and 2
l), the high-
 $Re$
wake structure is dominated by a thin upward jet (Torres et al.
Reference Torres, Hanazaki, Ochoa, Castillo and Van Woert2000; Hanazaki et al.
Reference Hanazaki, Kashimoto and Okamura2009a
, Reference Hanazaki, Nakamura and Yoshikawa2015) with centreline velocities several times larger than the sphere speed. Internal waves (Mowbray & Rarity Reference Mowbray and Rarity1967) propagating upwards become salient when
 $Fr\lesssim 1$
(figure 2
g–h,k–l). For a given
 $Fr$
, the size of the closed regions is smaller than in the low-
 $Re$
regime; for low
 $Fr$
, they exhibit a V-shape due to the streamwise modulation of the vertical velocity by the internal waves (figure 2
g–h,k–l). The influence of
 $Pr$
is weaker than in the low-
 $Re$
regime, except within the jet region. In line with the findings of Torres et al. (Reference Torres, Hanazaki, Ochoa, Castillo and Van Woert2000), no standing eddy (which would correspond to vertical velocities less than
 $-1$
in figure 2) exists at the back of the sphere for
 $Re=100$
throughout the explored range of
 $Fr$
, in contrast with the homogeneous situation in which this structure is present for
 $Re\gtrsim 10$
(Batchelor Reference Batchelor1967).
3.2 Buoyancy-induced contributions to the drag
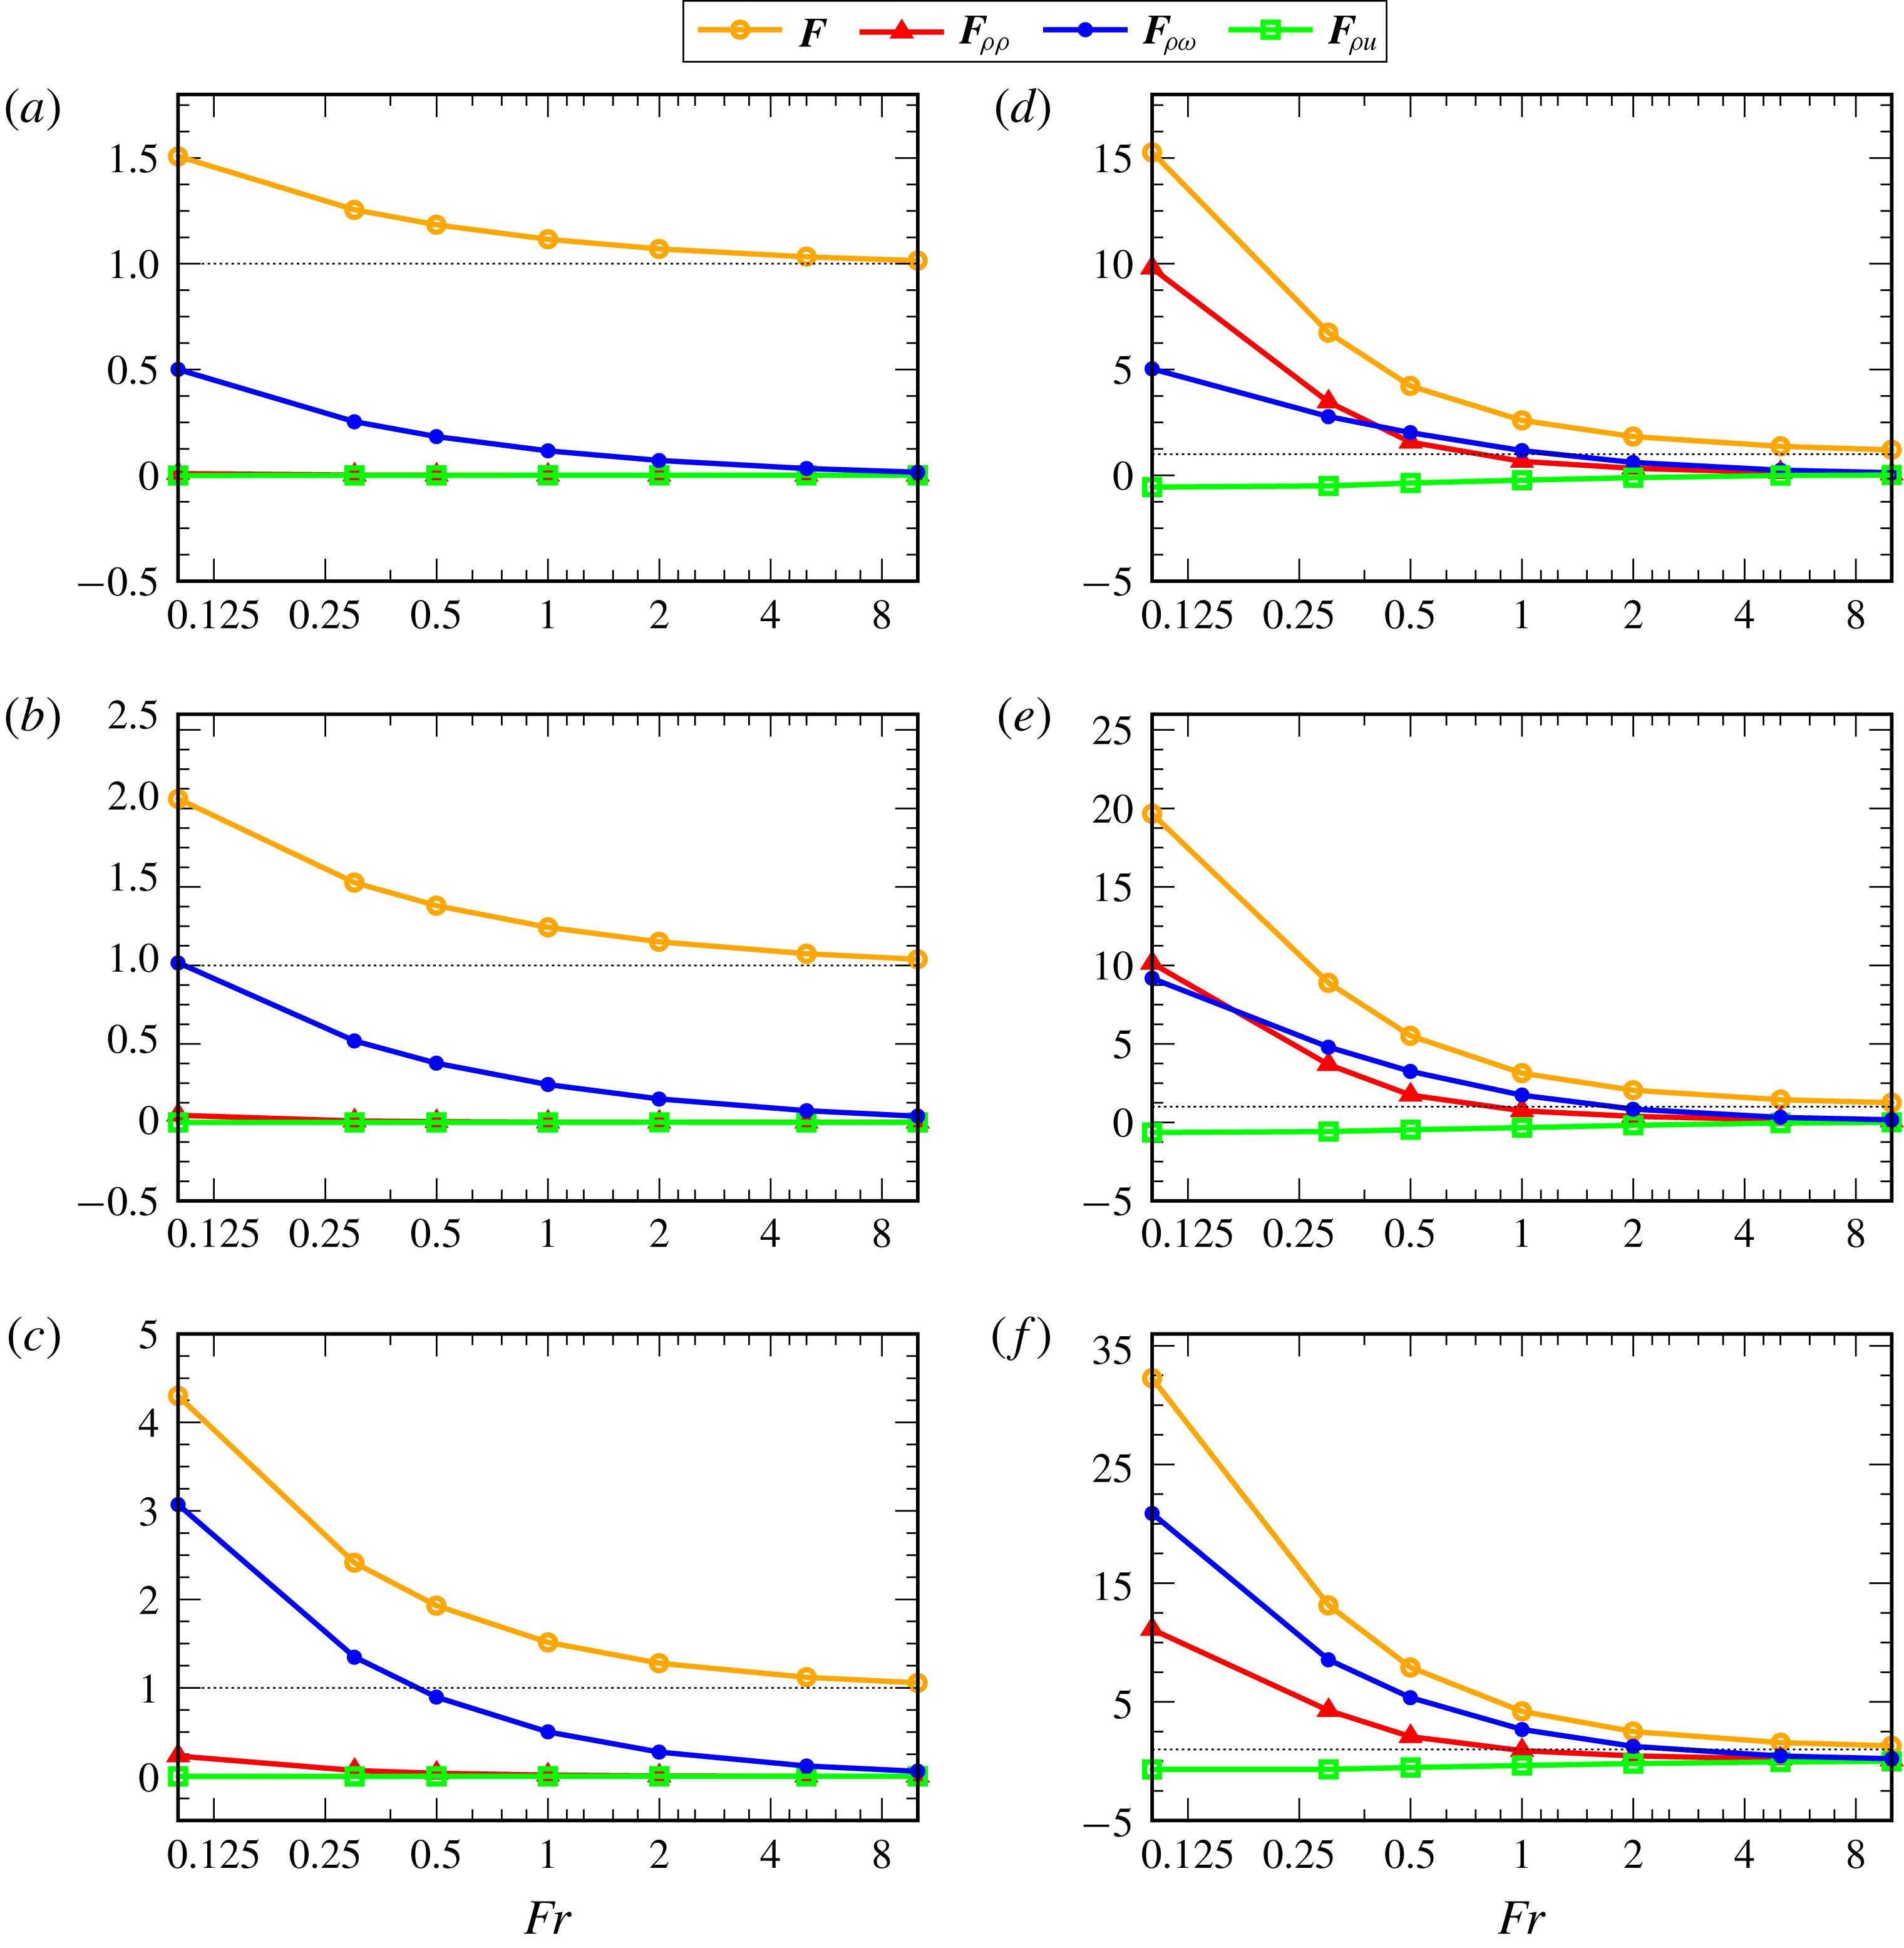
The various contributions to the drag acting on the sphere are shown in figure 3. The drag is only weakly affected by stratification effects for
 $Fr=\mathit{O}(10)$
, with less than
 $5\,\%$
(respectively
 $25\,\%$
) increase compared to the ‘homogeneous’ drag at
 $Re=0.05$
(respectively
 $100$
). In contrast, decreasing
 $Fr$
to lower values makes the drag increase dramatically whatever
 $Re$
, especially for large
 $Pr$
. With
 $Pr=700$
and
 $Fr=0.5$
, the drag almost doubles compared to its value in a homogeneous fluid when
 $Re=0.05$
, and is eight times larger when
 $Re=100$
. Decreasing
 $Pr$
to
 $0.7$
, while maintaining
 $Fr$
and
 $Re$
unchanged, reduces the drag enhancement by a factor of
 $5$
(respectively
 $2$
) at low (respectively high)
 $Re$
.
Contributions, as given in (2.16), to the vertical force on the sphere versus the Froude number for
 $Re=0.05$
(left) and
 $Re=100$
(right) with, from top to bottom,
 $Pr=0.7,\,7$
and
 $700$
. All contributions are normalized by the ‘homogeneous’ drag force,
 $F_{w}=\boldsymbol{F}_{w}\boldsymbol{\cdot }\boldsymbol{e}_{z}$
at the same
 $Re$
, so that
 $\boldsymbol{F}\boldsymbol{\cdot }\boldsymbol{e}_{z}/F_{w}=1+(\boldsymbol{F}_{\unicode[STIX]{x1D70C}\unicode[STIX]{x1D70C}}+\boldsymbol{F}_{\unicode[STIX]{x1D70C}u}+\boldsymbol{F}_{\unicode[STIX]{x1D70C}\unicode[STIX]{x1D714}})\boldsymbol{\cdot }\boldsymbol{e}_{z}/F_{w}$
.

In all cases, the contribution
 $\boldsymbol{F}_{\unicode[STIX]{x1D70C}u}$
due to the inertial pressure correction is negative (i.e. it provides a downthrust) but is negligibly small in magnitude. The reason for this may be qualitatively understood by examining the behaviour of the right-hand side of (2.14), i.e. the momentum flux, in the vicinity of the body surface. As
 $\boldsymbol{u}_{w}$
and
 $\boldsymbol{u}_{\unicode[STIX]{x1D70C}}$
both obey a no-slip condition on
 $({\mathcal{S}})$
, continuity requires that their tangential (respectively normal) component varies linearly (respectively quadratically) with the distance
 $r-1$
to
 $({\mathcal{S}})$
in the immediate vicinity of the latter (
 $r=||\boldsymbol{x}||$
). Therefore
 $(\boldsymbol{u}_{\unicode[STIX]{x1D70C}}+\boldsymbol{u}_{w})\boldsymbol{\cdot }\unicode[STIX]{x1D735}\boldsymbol{u}_{\unicode[STIX]{x1D70C}}+\boldsymbol{u}_{\unicode[STIX]{x1D70C}}\boldsymbol{\cdot }\unicode[STIX]{x1D735}\boldsymbol{u}_{w}$
varies as
 $(r-1)^{2}$
within this surface layer, forcing the momentum flux to vanish on
 $({\mathcal{S}})$
and be proportional to
 $r-1$
close to it. Consequently the source term in the Poisson equation (2.14) is nearly zero close to
 $({\mathcal{S}})$
, and variations of
 $p_{\unicode[STIX]{x1D70C}\text{u}}$
along the body surface essentially result from the distribution of the momentum flux at some distance from
 $({\mathcal{S}})$
. This non-locality limits the variations of
 $p_{\unicode[STIX]{x1D70C}\text{u}}$
along
 $({\mathcal{S}})$
, hence the magnitude of
 $\boldsymbol{F}_{\unicode[STIX]{x1D70C}\text{u}}$
. No such effect exists in the case of
 $\boldsymbol{F}_{\unicode[STIX]{x1D70C}\unicode[STIX]{x1D70C}}$
, since the distribution of
 $p_{\unicode[STIX]{x1D70C}\unicode[STIX]{x1D70C}}$
along
 $({\mathcal{S}})$
is mostly driven by the non-zero near-surface density gradients.
When
 $Re$
is low, the additional Archimedes force
 $\boldsymbol{F}_{\unicode[STIX]{x1D70C}\unicode[STIX]{x1D70C}}$
is also negligible compared to the vortical contribution
 $\boldsymbol{F}_{\unicode[STIX]{x1D70C}\unicode[STIX]{x1D714}}$
, although its relative magnitude increases with
 $Pr$
. Both contributions are of the same order when
 $Re=100$
and
 $Pr$
is moderate. However, when
 $Pr$
is large,
 $\boldsymbol{F}_{\unicode[STIX]{x1D70C}\unicode[STIX]{x1D714}}$
provides again the major part of the extra drag at
 $Re=100$
, being roughly twice as large as
 $\boldsymbol{F}_{\unicode[STIX]{x1D70C}\unicode[STIX]{x1D70C}}$
. These results reveal that modifications of the vorticity field resulting from the baroclinic torque play a pivotal role in the drag increase throughout the explored
 $Re$
-range. Conversely, density variations at the body surface play a negligible role at low
 $Re$
but their relative magnitude gradually increases with the Reynolds number. This state of affairs seriously questions the available attempts in which the stratification-induced drag has been modelled by evaluating the buoyancy provided by the volume of light fluid dragged by the body, especially in the low-
 $Re$
regime (Yick et al.
Reference Yick, Torres, Peacock and Stocker2009), or for Reynolds numbers of some units (Srdic-Mitrovic et al.
Reference Srdic-Mitrovic, Mohamed and Fernando1999).
4 Stratification regimes and scaling laws for the buoyancy-induced drag
To better understand how
 $\boldsymbol{F}_{\unicode[STIX]{x1D70C}\unicode[STIX]{x1D714}}$
and
 $\boldsymbol{F}_{\unicode[STIX]{x1D70C}\unicode[STIX]{x1D70C}}$
vary with the control parameters, it is desirable to rationalize the trends revealed by figure 3. Additionally, obtaining explicit scaling laws for these two contributions may allow predictions provided by present numerical results to be extended to a broader range of parameters, especially with respect to the Reynolds number. To this end, we start from (2.2) and (2.10) and express the linearized equations governing small disturbances in the density and vorticity associated with the buoyancy-induced flow in the form
 $$\begin{eqnarray}\displaystyle & \displaystyle \frac{D_{w}\unicode[STIX]{x1D70C}}{Dt}-Pe^{-1}\unicode[STIX]{x1D6FB}^{2}\unicode[STIX]{x1D70C}=(\boldsymbol{u}_{\unicode[STIX]{x1D70C}}+\boldsymbol{u}_{w})\boldsymbol{\cdot }\boldsymbol{e}_{z}-1, & \displaystyle\end{eqnarray}$$
 $$\begin{eqnarray}\displaystyle & \displaystyle \frac{D_{w}\unicode[STIX]{x1D74E}_{\unicode[STIX]{x1D70C}}}{Dt}+\boldsymbol{u}_{\unicode[STIX]{x1D70C}}\boldsymbol{\cdot }\unicode[STIX]{x1D735}\unicode[STIX]{x1D74E}_{w}-\unicode[STIX]{x1D74E}_{\unicode[STIX]{x1D70C}}\boldsymbol{\cdot }\unicode[STIX]{x1D735}\boldsymbol{u}_{w}-\unicode[STIX]{x1D74E}_{w}\boldsymbol{\cdot }\unicode[STIX]{x1D735}\boldsymbol{u}_{\unicode[STIX]{x1D70C}}-Re^{-1}\unicode[STIX]{x1D6FB}^{2}\unicode[STIX]{x1D74E}_{\unicode[STIX]{x1D70C}}=Fr^{-2}\boldsymbol{e}_{z}\times \unicode[STIX]{x1D735}\unicode[STIX]{x1D70C}, & \displaystyle\end{eqnarray}$$
where
 $\unicode[STIX]{x1D74E}_{\unicode[STIX]{x1D70C}}=\unicode[STIX]{x1D735}\times \boldsymbol{u}_{\unicode[STIX]{x1D70C}}$
and
 $\unicode[STIX]{x1D74E}_{w}=\unicode[STIX]{x1D735}\times \boldsymbol{u}_{w}$
denote the vorticity associated with the buoyancy-induced and homogeneous flow fields, respectively, and
 $D_{w}/Dt\equiv \unicode[STIX]{x2202}_{t}+\boldsymbol{u}_{w}\boldsymbol{\cdot }\unicode[STIX]{x1D735}$
is the material derivative with respect to the homogeneous flow. Linearization in (4.1) and (4.2) assumes that
 $||\boldsymbol{u}_{\unicode[STIX]{x1D70C}}||\ll ||\boldsymbol{u}_{w}||$
,
 $||\unicode[STIX]{x1D735}\boldsymbol{u}_{\unicode[STIX]{x1D70C}}||\ll ||\unicode[STIX]{x1D735}\boldsymbol{u}_{w}||$
and
 $||\unicode[STIX]{x1D74E}_{\unicode[STIX]{x1D70C}}||\ll ||\unicode[STIX]{x1D74E}_{w}||$
. We make use of the vorticity balance (4.2) instead of the momentum balance (2.10) to avoid having to discuss the scaling of the pressure term in each regime. The scaling laws for the buoyancy-induced forces,
 $\boldsymbol{F}_{\unicode[STIX]{x1D70C}\unicode[STIX]{x1D714}}$
and
 $\boldsymbol{F}_{\unicode[STIX]{x1D70C}\unicode[STIX]{x1D70C}}$
stem from the dominant balances in (4.1) and (4.2), and the characteristics of the undisturbed velocity field,
 $\boldsymbol{u}_{w}$
. The cornerstone of the procedure consists in determining the characteristic length scale,
 $\ell _{s}$
, over which buoyancy effects generate a velocity disturbance,
 $\boldsymbol{u}_{\unicode[STIX]{x1D70C}}$
, of the same magnitude,
 $u$
, as the driving ‘homogeneous’ disturbance,
 $\boldsymbol{u}_{w}\boldsymbol{\cdot }\boldsymbol{e}_{z}-1$
, in the sphere vicinity. These effects must in principle remain small enough for the linearization that led to (4.1) and (4.2) to be legitimate. By comparing effects of stratification with those of viscosity and diffusivity, which act over length scales
 $\ell _{\unicode[STIX]{x1D708}}$
and
 $\ell _{\unicode[STIX]{x1D705}}$
, respectively, three regimes in which
 $\boldsymbol{F}_{\unicode[STIX]{x1D70C}\unicode[STIX]{x1D714}}$
and
 $\boldsymbol{F}_{\unicode[STIX]{x1D70C}\unicode[STIX]{x1D70C}}$
vary differently with
 $Fr,\,Re$
and
 $Pr$
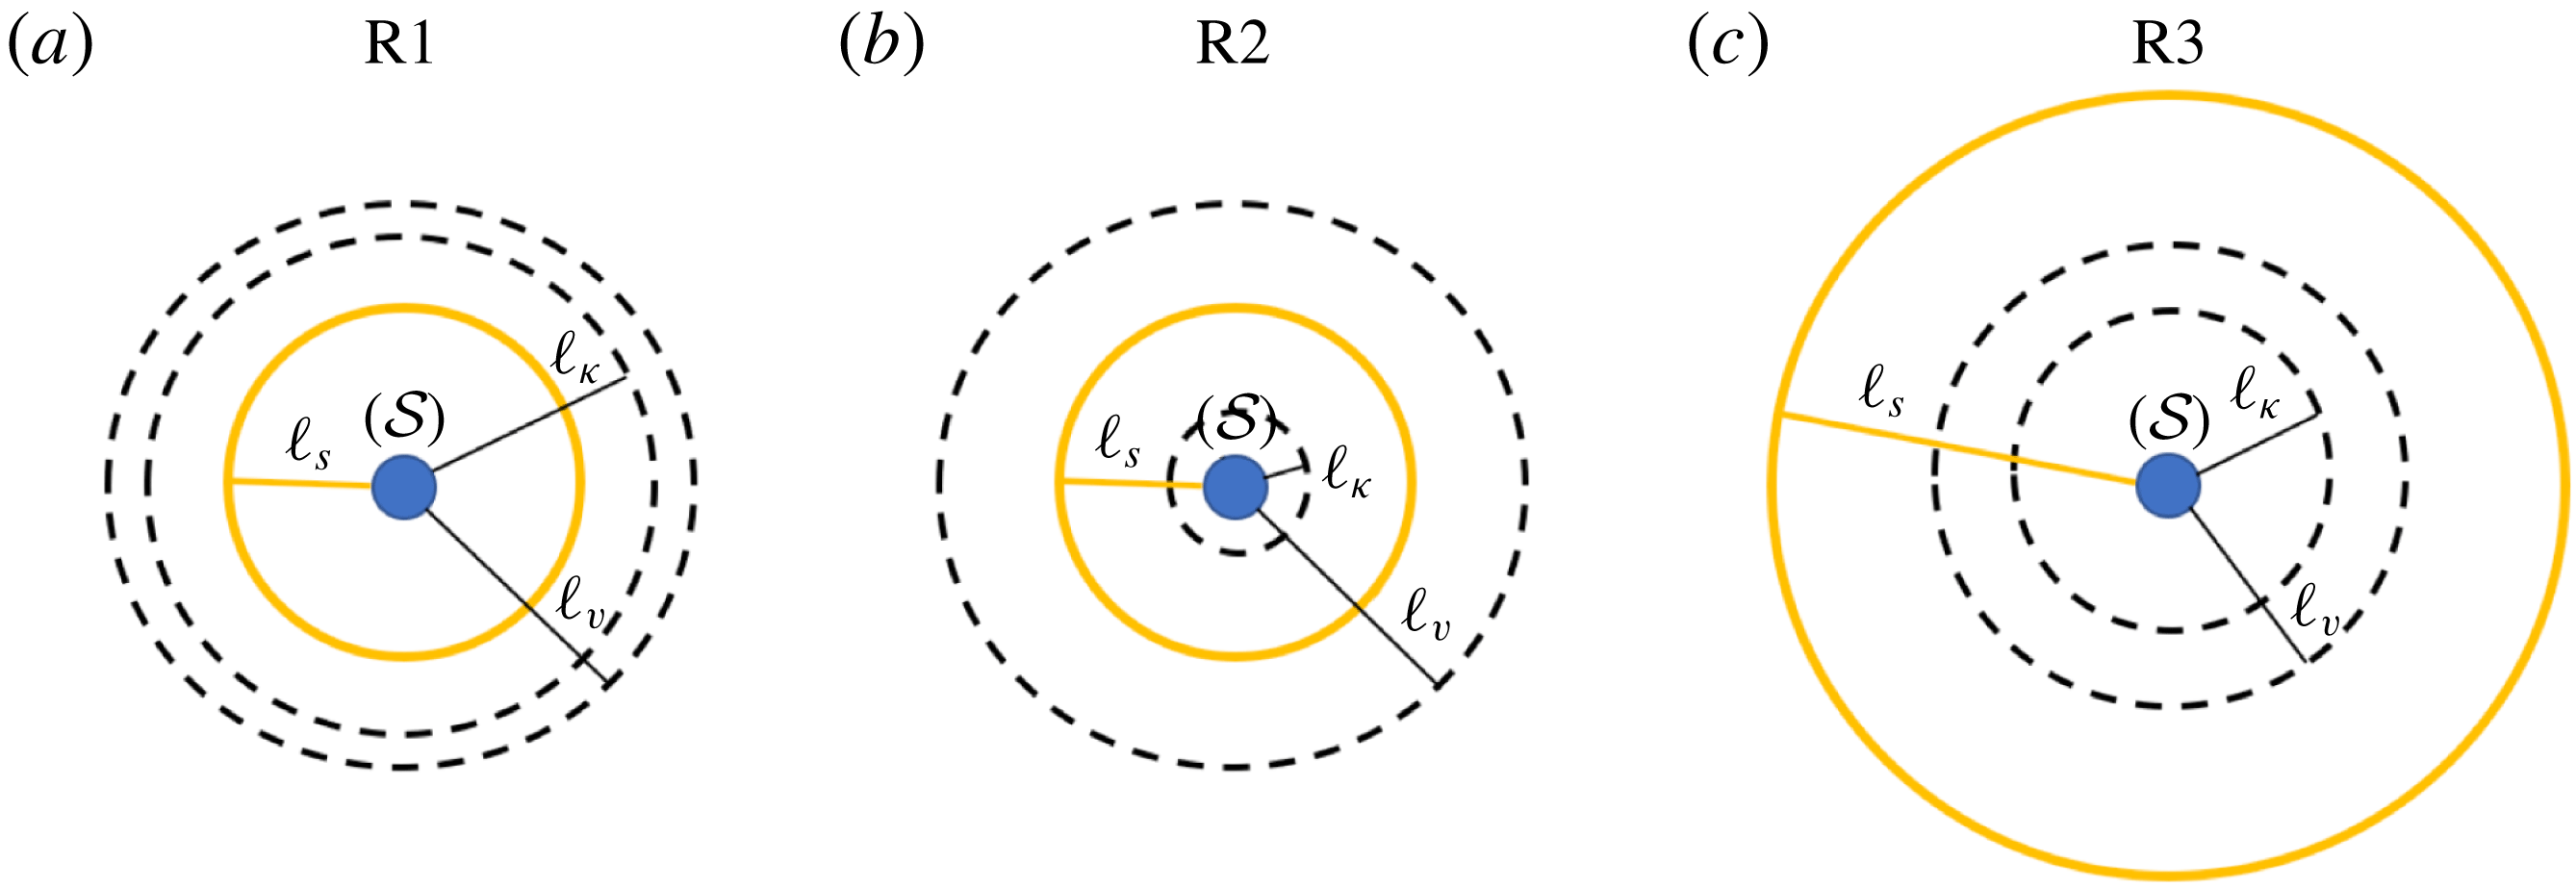
may be identified, for both low and high Reynolds number. A schematic view of the corresponding three configurations is provided in figure 4 in a low-
 $Re$
case.
Sketch of the three possible stratification regimes about a unit radius sphere settling at low Reynolds number (
 $\ell _{\unicode[STIX]{x1D708}}\gg 1$
). In (a) the Prandtl number has been selected such that
 $Pr\gtrsim 1$
(since
 $\ell _{\unicode[STIX]{x1D705}}\lesssim \ell _{\unicode[STIX]{x1D708}}$
), while in (b)
 $Pr\gg 1$
(since
 $\ell _{\unicode[STIX]{x1D705}}\ll \ell _{\unicode[STIX]{x1D708}}$
). The high-
 $Re$
case is similar, except that
 $\ell _{\unicode[STIX]{x1D708}}$
is much smaller than the characteristic body size.

4.1 Low-Reynolds-number range
We first consider the low-
 $Re$
range, in which
 $\ell _{\unicode[STIX]{x1D708}}=Re^{-1}$
. Depending on whether
 $Pe$
is small (
 $Pr=\mathit{O}(1)$
) or large (
 $Pr\gg 1$
), one then has
 $\ell _{\unicode[STIX]{x1D705}}=Pe^{-1}$
or
 $Pe^{-1/3}$
(Levich Reference Levich1962; Batchelor Reference Batchelor1980). If stratification is strong enough for the condition
 $\ell _{s}\ll \ell _{\unicode[STIX]{x1D708}}$
to be satisfied, inertial terms are negligible in (4.2). Then the balance between buoyancy and viscous effects reduces to
 $$\begin{eqnarray}Re^{-1}\underbrace{\unicode[STIX]{x1D6FB}^{2}\unicode[STIX]{x1D74E}_{\unicode[STIX]{x1D70C}}}_{\mathit{O}(u/\ell _{s}^{3})}\approx Fr^{-2}\underbrace{\unicode[STIX]{x1D735}\unicode[STIX]{x1D70C}\times \boldsymbol{e}_{z}}_{\mathit{O}(\unicode[STIX]{x1D70C}_{\ell }/\ell _{s})},\end{eqnarray}$$
so that the density disturbance,
 $\unicode[STIX]{x1D70C}_{\ell }$
, associated with the velocity disturbance,
 $u$
, obeys
 $\unicode[STIX]{x1D70C}_{\ell }\sim Fr^{2}Re^{-1}u/\ell _{s}^{2}$
. If moreover
 $\ell _{s}\ll \ell _{\unicode[STIX]{x1D705}}$
(which corresponds to configuration (a) in figure 4), advective effects are negligible in the linearized density balance (4.1) which then reduces to
 $$\begin{eqnarray}Pe^{-1}\underbrace{\unicode[STIX]{x1D6FB}^{2}\unicode[STIX]{x1D70C}}_{\mathit{O}(\unicode[STIX]{x1D70C}_{\ell }/\ell _{s}^{2})}\approx \underbrace{1-(\boldsymbol{u}_{\unicode[STIX]{x1D70C}}+\boldsymbol{u}_{w})\boldsymbol{\cdot }\boldsymbol{e}_{z}}_{\mathit{O}(u)}.\end{eqnarray}$$
Hence the driving term,
 $1-\boldsymbol{u}_{w}\boldsymbol{\cdot }\boldsymbol{e}_{z}$
, is balanced by diffusive effects, which requires
 $Pe^{-1}\unicode[STIX]{x1D70C}_{\ell }/\ell _{s}^{2}\sim u$
. Note that the buoyancy-induced advective term,
 $\boldsymbol{u}_{\unicode[STIX]{x1D70C}}\boldsymbol{\cdot }\boldsymbol{e}_{z}$
, subsists in (4.4), as it is assumed to have the same magnitude as the driving term, in contrast with the settling-induced advective contribution,
 $\boldsymbol{u}_{w}\boldsymbol{\cdot }\unicode[STIX]{x1D735}\unicode[STIX]{x1D70C}$
. The disturbance
 $u$
being small but arbitrary, compatibility between (4.4) and (4.3) implies
 $\ell _{s}^{4}\approx Fr^{2}/(PeRe)$
. This defines a viscous–diffusive regime, which we refer to as R1, characterized by a stratification length scale
 $$\begin{eqnarray}\ell _{s}\approx \ell _{s_{1}}\equiv (Fr/Re)^{1/2}Pr^{-1/4}.\end{eqnarray}$$
The relevance of this viscous–diffusive length scale was first recognized by List (Reference List1971) and later rediscovered independently by Ardekani & Stocker (Reference Ardekani and Stocker2010).
To evaluate
 $\boldsymbol{F}_{\unicode[STIX]{x1D70C}\unicode[STIX]{x1D714}}$
and
 $\boldsymbol{F}_{\unicode[STIX]{x1D70C}\unicode[STIX]{x1D70C}}$
under such conditions, the spatial distribution of the settling-induced velocity,
 $\boldsymbol{u}_{w}$
, about the body must be considered. At a distance
 $r$
from the sphere centre, the disturbance
 $\boldsymbol{u}_{w}-\boldsymbol{e}_{z}$
is dominated by the contribution of the Stokeslet, which makes it decay approximately as
 $r^{-1}$
for increasing
 $r$
. Departures from this dominant behaviour arise because of the presence of a dipole (required to satisfy the no-slip condition on
 $({\mathcal{S}})$
), and of inertial corrections required for the solution to be valid throughout the fluid domain, including the outer region
 $r\gg Re^{-1}$
(Batchelor Reference Batchelor1967). These additional contributions make the settling-induced velocity field decay slightly faster than
 $\mathit{O}(r^{-1})$
, so that we may consider that, for
 $r\gg 1$
,
 $|\boldsymbol{u}_{w}\boldsymbol{\cdot }\boldsymbol{e}_{z}-1|$
approximately behaves as
 $r^{-(1+\unicode[STIX]{x1D6FC})}$
with
 $\unicode[STIX]{x1D6FC}\gtrsim 0$
. The vortical force,
 $\boldsymbol{F}_{\unicode[STIX]{x1D70C}\unicode[STIX]{x1D714}}$
, scales as the viscous traction at the body surface,
 $Re^{-1}\boldsymbol{n}\boldsymbol{\cdot }(\unicode[STIX]{x1D735}\boldsymbol{u}_{\unicode[STIX]{x1D70C}}+\unicode[STIX]{x1D735}\boldsymbol{u}_{\unicode[STIX]{x1D70C}}^{\text{T}})$
. On
 $({\mathcal{S}})$
,
 $||\boldsymbol{u}_{w}-\boldsymbol{e}_{z}||=1$
due to the no-slip condition, whereas at the radial position
 $r=1+\ell _{s1}$
,
 $||\boldsymbol{u}_{w}-\boldsymbol{e}_{z}||\ll 1$
provided
 $\ell _{s1}\gg 1$
, owing to the
 $r^{-(1+\unicode[STIX]{x1D6FC})}$
-decay. From a physical point of view, assuming
 $\ell _{s1}\gg 1$
implies that we are considering a characteristic stratification length scale much larger than the body size (or equivalently, that the sphere is seen as a point force). This condition is fulfilled throughout the range covered by the low-
 $Re$
computations. The variation
 $\unicode[STIX]{x1D6FF}u$
of
 $||\boldsymbol{u}_{w}-\boldsymbol{e}_{z}||$
from
 $r=1+\ell _{s1}$
to
 $r=1$
is then of
 $\mathit{O}(1)$
, and so is that of
 $||\boldsymbol{u}_{\unicode[STIX]{x1D70C}}||$
, due to our definition of the stratification length scale. Assuming that the above scaling for
 $\ell _{s1}$
, derived under the assumption
 $u\ll 1$
, holds up to
 $\unicode[STIX]{x1D6FF}u=\mathit{O}(1)$
leads to the conclusion that
 $\boldsymbol{n}\boldsymbol{\cdot }\unicode[STIX]{x1D735}\boldsymbol{u}_{\unicode[STIX]{x1D70C}}\sim 1/\ell _{s1}$
on
 $({\mathcal{S}})$
. Hence
 $\boldsymbol{F}_{\unicode[STIX]{x1D70C}\unicode[STIX]{x1D714}}\sim (Re\ell _{s})^{-1}$
, which in the viscous–diffusive R1 regime implies
 $$\begin{eqnarray}\boldsymbol{F}_{\unicode[STIX]{x1D70C}\unicode[STIX]{x1D714}}\equiv \boldsymbol{F}_{\unicode[STIX]{x1D70C}\unicode[STIX]{x1D714}1}\sim (FrRe)^{-1/2}Pr^{1/4}.\end{eqnarray}$$
The above result was obtained without considering the contribution of the pressure component
 $p_{\unicode[STIX]{x1D70C}\unicode[STIX]{x1D714}}$
. However the latter exists only to ensure that the velocity field
 $\boldsymbol{u}_{\unicode[STIX]{x1D70C}}$
is solenoidal (i.e.
 $p_{\unicode[STIX]{x1D70C}\unicode[STIX]{x1D714}}$
plays the role of a Lagrange multiplier), which implies that its variations round the body have the same order of magnitude as those of the viscous traction defined above. Hence the contributions of
 $p_{\unicode[STIX]{x1D70C}\unicode[STIX]{x1D714}}\boldsymbol{n}$
and
 $Re^{-1}\boldsymbol{n}\boldsymbol{\cdot }(\unicode[STIX]{x1D735}\boldsymbol{u}_{\unicode[STIX]{x1D70C}}+\unicode[STIX]{x1D735}\boldsymbol{u}_{\unicode[STIX]{x1D70C}}^{\text{T}})$
to
 $\boldsymbol{F}_{\unicode[STIX]{x1D70C}\unicode[STIX]{x1D714}}$
have the same magnitude whatever the Reynolds number (for the same reason, it is well known (Batchelor Reference Batchelor1967) that the surface shear stress (respectively pressure) provides
 $2/3$
(respectively
 $1/3$
) of the drag force on a sphere in the low-Reynolds-number regime, and the same ratios hold in the limit of very large Reynolds numbers for a sphere obeying a shear-free condition, i.e. a bubble with a negligible inner viscosity (Kang & Leal Reference Kang and Leal1988)).
The force component
 $\boldsymbol{F}_{\unicode[STIX]{x1D70C}\unicode[STIX]{x1D70C}}$
is directly proportional to the pressure component
 $p_{\unicode[STIX]{x1D70C}\unicode[STIX]{x1D70C}}$
on
 $({\mathcal{S}})$
. From (2.12) and (2.13) one infers that
 $\unicode[STIX]{x1D735}p_{\unicode[STIX]{x1D70C}\unicode[STIX]{x1D70C}}\sim -Fr^{-2}\unicode[STIX]{x1D70C}\boldsymbol{e}_{z}$
near the body, so that the surface value of
 $p_{\unicode[STIX]{x1D70C}\unicode[STIX]{x1D70C}}$
scales as
 $Fr^{-2}\unicode[STIX]{x1D70C}_{\ell }z$
, with
 $z$
the vertical position with respect to the sphere centre. Hence one has
 $\boldsymbol{F}_{\unicode[STIX]{x1D70C}\unicode[STIX]{x1D70C}}\sim Fr^{-2}\unicode[STIX]{x1D70C}_{\ell }$
, with
 $\unicode[STIX]{x1D70C}_{\ell }$
evaluated on
 $({\mathcal{S}})$
. To estimate
 $\unicode[STIX]{x1D70C}_{\ell }$
, one has to return to (4.4) and make use of the various estimates obtained above, which yields
 $$\begin{eqnarray}Pe^{-1}\underbrace{\unicode[STIX]{x1D6FB}^{2}\unicode[STIX]{x1D70C}}_{\mathit{O}(\unicode[STIX]{x1D70C}_{\ell }/\ell _{s1}^{2})}+\underbrace{\boldsymbol{u}_{\unicode[STIX]{x1D70C}}\boldsymbol{\cdot }\boldsymbol{e}_{z}}_{\mathit{O}(\unicode[STIX]{x1D70C}_{\ell }Re\,\ell _{s1}^{2}/Fr^{2})}\approx \underbrace{1-\boldsymbol{u}_{w}\boldsymbol{\cdot }\boldsymbol{e}_{z}}_{\mathit{O}(r^{-(1+\unicode[STIX]{x1D6FC})})}.\end{eqnarray}$$
Integrating the right-hand side twice and balancing with the diffusive term yields
 $\unicode[STIX]{x1D70C}_{\ell }\sim Pe\ell _{s1}$
(the non-zero, albeit small,
 $\unicode[STIX]{x1D6FC}$
avoids a logarithmic divergence during this integration). Similarly, provided
 $\ell _{s1}\gg 1$
,
 $\int _{r=1}^{r=1+\ell _{s1}}|\boldsymbol{u}_{w}\boldsymbol{\cdot }\boldsymbol{e}_{z}-1|dr\approx 1$
, so that on average
 $|\boldsymbol{u}_{w}\boldsymbol{\cdot }\boldsymbol{e}_{z}-1|$
is of
 $\mathit{O}(1/\ell _{s1})$
in between
 $r=1+\ell _{s1}$
and
 $r=1$
. Then, balancing
 $\boldsymbol{u}_{\unicode[STIX]{x1D70C}}\boldsymbol{\cdot }\boldsymbol{e}_{z}$
with this averaged driving term and assuming
 $\unicode[STIX]{x1D70C}\approx 0$
for
 $r\gtrsim 1+\ell _{s1}$
yields
 $\unicode[STIX]{x1D70C}_{\ell }\sim Fr^{2}/(Re\ell _{s1}^{3})$
at
 $r=1$
. Given (4.5), both estimates imply
 $\unicode[STIX]{x1D70C}_{\ell }\sim (ReFr)^{1/2}Pr^{3/4}$
near the sphere surface, from which one concludes that in the R1 regime
 $$\begin{eqnarray}\boldsymbol{F}_{\unicode[STIX]{x1D70C}\unicode[STIX]{x1D70C}}\equiv \boldsymbol{F}_{\unicode[STIX]{x1D70C}\unicode[STIX]{x1D70C}1}\sim Fr^{-3/2}Re^{1/2}Pr^{3/4}.\end{eqnarray}$$
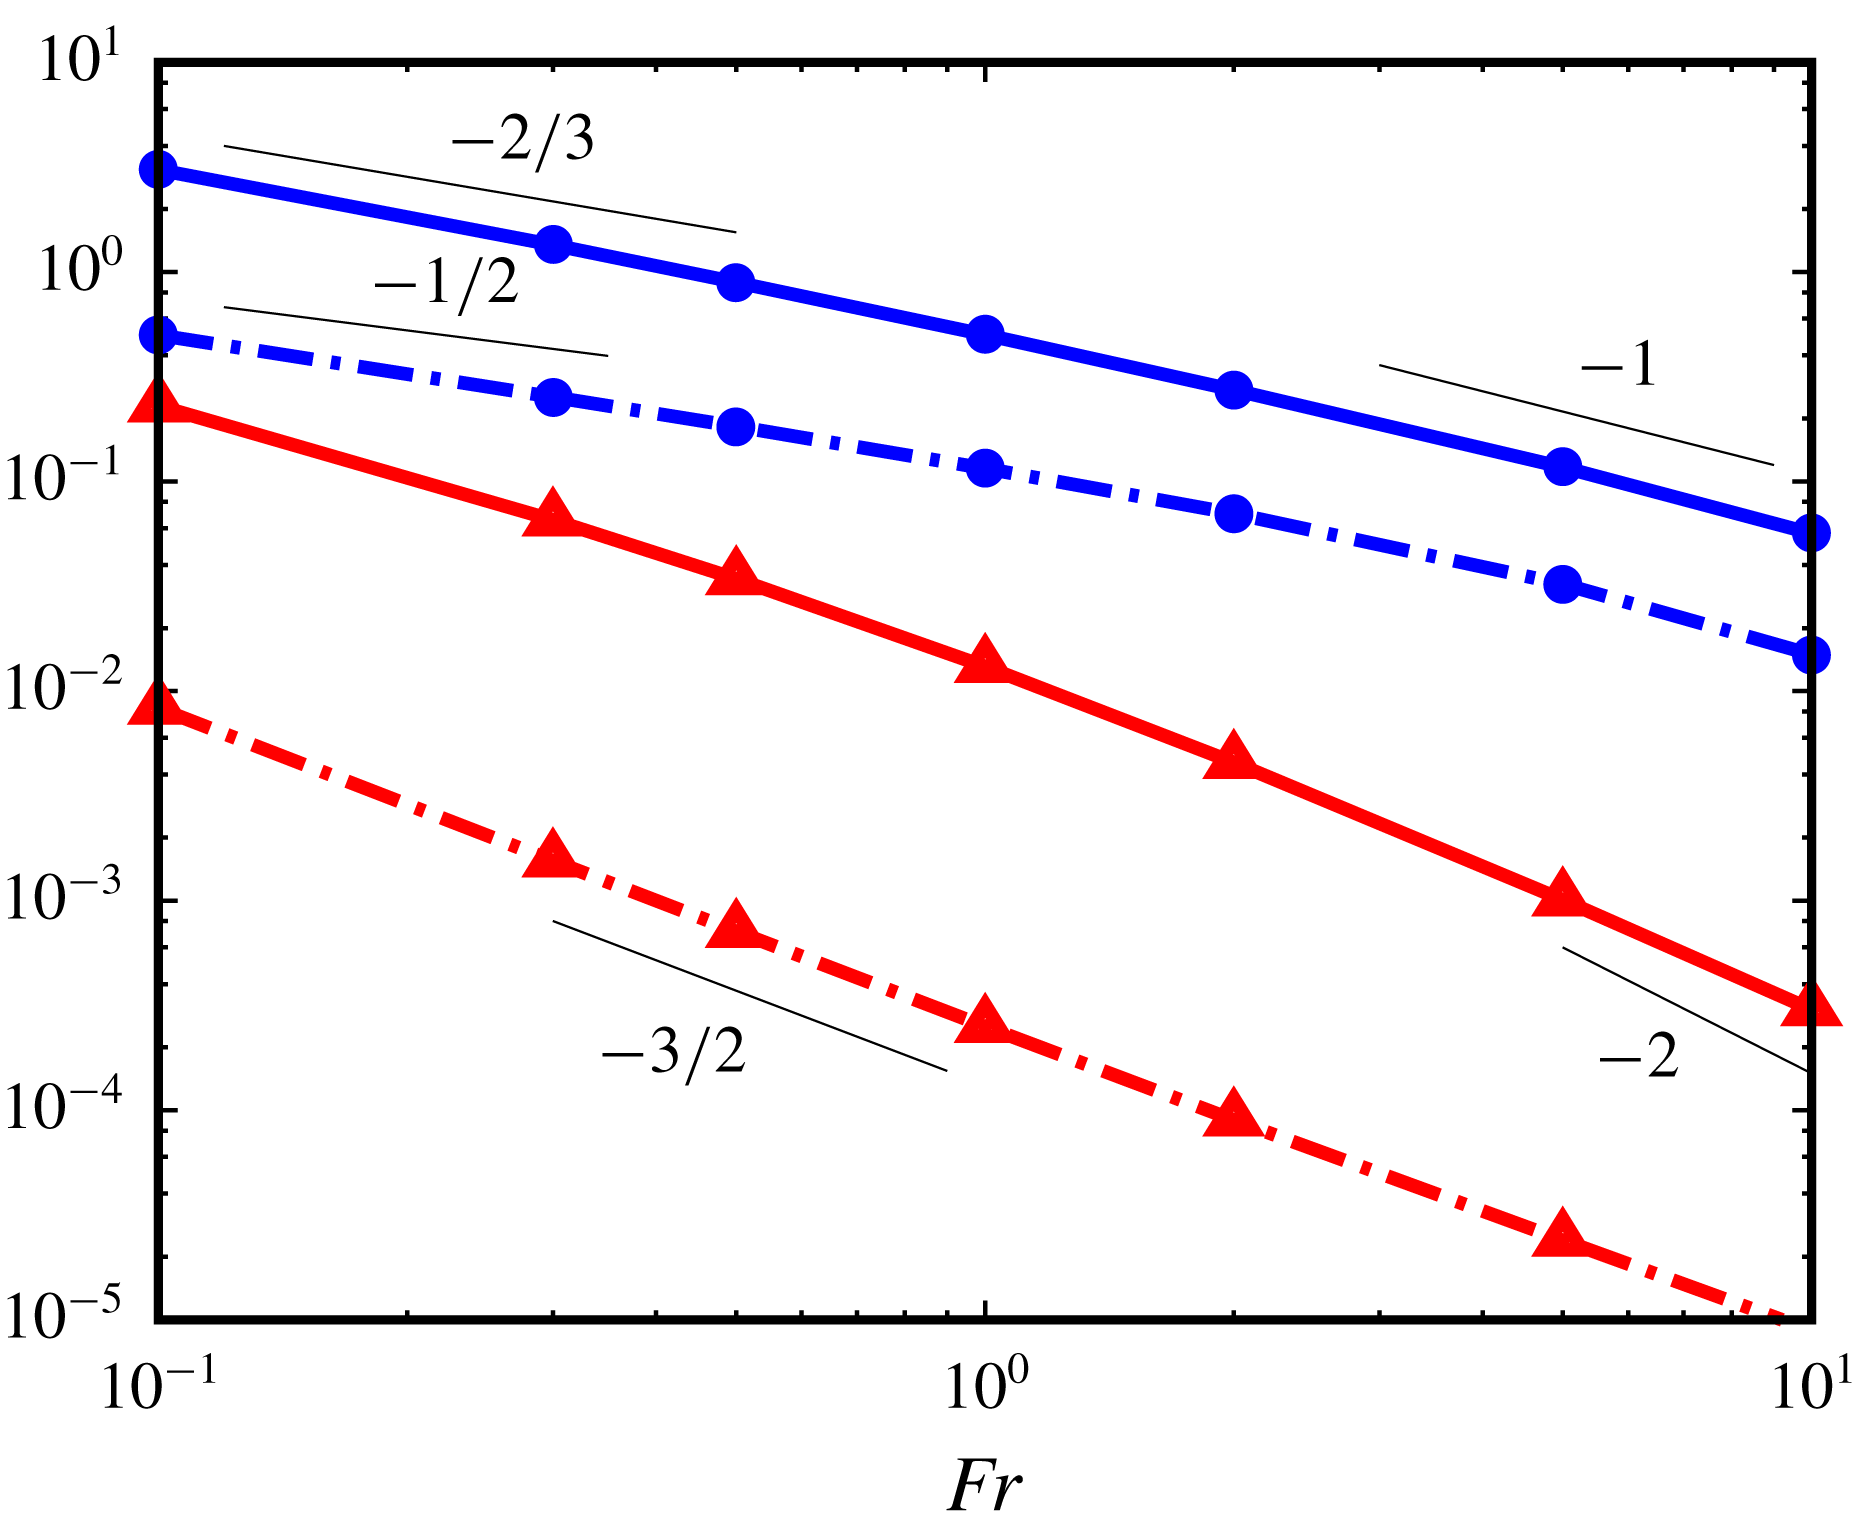
Variations of normalized force components
 $\boldsymbol{F}_{\unicode[STIX]{x1D70C}\unicode[STIX]{x1D70C}}\boldsymbol{\cdot }\boldsymbol{e}_{z}/F_{w}$
(triangles, red online) and
 $\boldsymbol{F}_{\unicode[STIX]{x1D70C}\unicode[STIX]{x1D714}}\boldsymbol{\cdot }\boldsymbol{e}_{z}/F_{w}$
(circles, blue online) in the low-
 $Re$
regime (
 $Re=0.05$
); dash-dotted line:
 $Pr=0.7$
, solid line:
 $Pr=700$
.

Variations of the buoyancy-induced drag components with the Froude number predicted by (4.6) and (4.8) are compared with numerical data in figure 5 for
 $Re=0.05$
. Results (4.6) and (4.8) apply provided
 $\ell _{s_{1}}$
is much smaller than
 $\ell _{\unicode[STIX]{x1D708}}$
and
 $\ell _{\unicode[STIX]{x1D705}}$
. Hence if
 $Re$
and
 $Pe$
are both small, the R1 regime takes place provided that
 $Fr\ll \text{min}(Re^{-1}Pr^{1/2},Re^{-1}Pr^{-3/2})$
, which with
 $Re=0.05$
and
 $Pr=0.7$
implies approximately
 $Fr\ll 15$
. In contrast, if
 $Re$
is small but
 $Pe$
is large, the second of the above bounds changes into
 $Fr\ll Re^{1/3}Pr^{-1/6}$
, which with
 $Pr=700$
implies
 $Fr\ll 0.1$
at the same Reynolds number. Hence the R1 regime is only expected to exist for
 $Pr=0.7$
in figure 5. Panels (a) and (c) in figure 2 correspond to this regime. In figure 5, the
 $-3/2$
slope predicted by (4.8) covers the entire explored
 $Fr$
-range, whereas the
 $-1/2$
slope corresponding to (4.6) is only identified for
 $Fr\lesssim 1$
. Comparing predictions (4.6) and (4.8) indicates that, for a given
 $Fr$
, the ratio
 $\boldsymbol{F}_{\unicode[STIX]{x1D70C}\unicode[STIX]{x1D70C}1}/\boldsymbol{F}_{\unicode[STIX]{x1D70C}\unicode[STIX]{x1D714}1}$
varies as
 $RePr^{1/2}$
. Hence
 $\boldsymbol{F}_{\unicode[STIX]{x1D70C}\unicode[STIX]{x1D70C}}$
is expected to be negligibly small for
 $Re\ll 1$
, the buoyancy-induced drag being dominated by the vortical contribution in this limit. This is confirmed by figure 5 which shows that
 $\boldsymbol{F}_{\unicode[STIX]{x1D70C}\unicode[STIX]{x1D70C}}$
is two orders of magnitude smaller than
 $\boldsymbol{F}_{\unicode[STIX]{x1D70C}\unicode[STIX]{x1D714}}$
throughout the R1 regime. At the moderate value
 $Pr=7$
, the low-
 $Fr$
low-
 $Re$
conditions considered in the DNS also belong to the R1 regime. These results may be used to check the
 $Pr^{1/4}$
-dependence predicted by (4.6), although the comparison is limited to one decade (
 $0.7\leqslant Pr\leqslant 7$
). As panels (a) and (b) in figure 3 indicate for
 $Fr=0.1$
, the ratio
 $\boldsymbol{F}_{\unicode[STIX]{x1D70C}\unicode[STIX]{x1D714}}(Pr=7)/\boldsymbol{F}_{\unicode[STIX]{x1D70C}\unicode[STIX]{x1D714}}(Pr=0.7)$
is close to 2.0, which compares reasonably well with the expected ratio
 $10^{1/4}\approx 1.8$
. The same check can be performed regarding the
 $Pr^{3/4}$
-dependence of
 $\boldsymbol{F}_{\unicode[STIX]{x1D70C}\unicode[STIX]{x1D70C}}$
predicted by (4.8), although the numerical values are too small for the difference to be visible in figure 3. The corresponding ratio is found to be
 $5.6$
, which compares well with the predicted ratio
 $10^{3/4}=5.25$
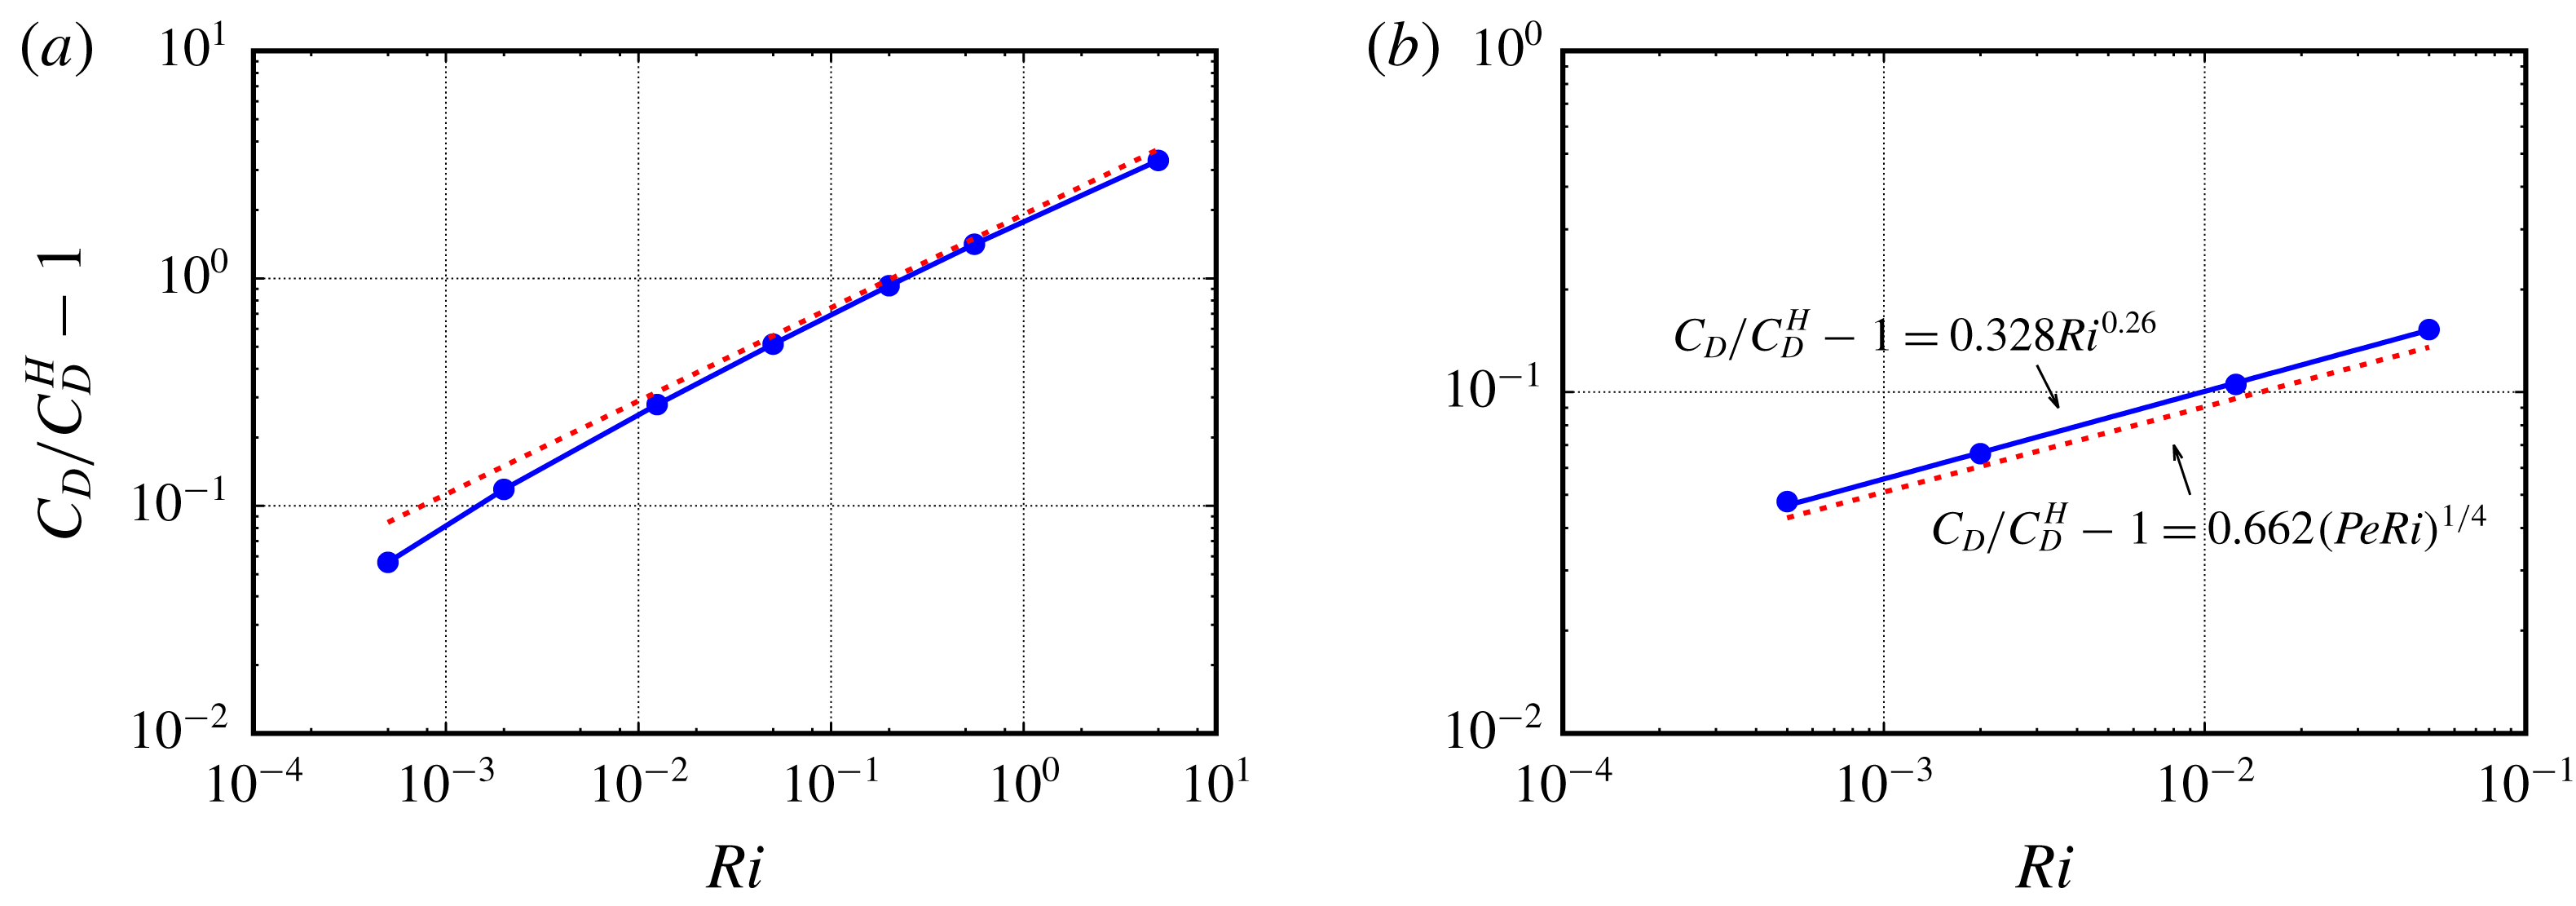
. The scaling (4.6) is similar to that found by Candelier et al. (Reference Candelier, Mehaddi and Vauquelin2014) who computed the buoyancy-induced correction to the drag using matched asymptotic expansions. These authors made use of the viscous Richardson number,
 $Ri=Re/Fr^{2}$
, and found this correction, normalized by the Stokes drag, to be
 $0.66(PeRi)^{1/4}$
. Hence the corresponding force behaves as
 $Re^{-1}(PeRi)^{1/4}$
, in line with (4.6).
If stratification is such that
 $\ell _{\unicode[STIX]{x1D705}}\ll \ell _{s}\ll \ell _{\unicode[STIX]{x1D708}}$
(which corresponds to configuration (b) in figure 4), the transport of the density disturbance at distances of
 $\mathit{O}(\ell _{s})$
from the body is dominated by advective effects, be the Péclet number small or large. Thus, in the quasi-steady approximation, the mass balance (4.1) becomes at leading order
 $$\begin{eqnarray}\underbrace{\boldsymbol{u}_{w}\boldsymbol{\cdot }\unicode[STIX]{x1D735}\unicode[STIX]{x1D70C}}_{\mathit{O}(\unicode[STIX]{x1D70C}_{\ell }/\ell _{s})}\approx \underbrace{(\boldsymbol{u}_{\unicode[STIX]{x1D70C}}+\boldsymbol{u}_{w})\boldsymbol{\cdot }\boldsymbol{e}_{z}-1}_{\mathit{O}(u)},\end{eqnarray}$$
so that
 $\unicode[STIX]{x1D70C}_{\ell }\sim \ell _{s}u$
, assuming that
 $||\boldsymbol{u}_{w}||\approx 1$
at a distance
 $r\approx 1+\ell _{s}$
from the sphere centre. Compatibility with the unchanged condition resulting from (4.3) then defines a viscous–advective regime, R2, characterized by (Chadwick & Zvirin Reference Chadwick and Zvirin1974; Zvirin & Chadwick Reference Zvirin and Chadwick1975)
 $$\begin{eqnarray}\ell _{s}\sim \ell _{s_{2}}\equiv (Fr^{2}/Re)^{1/3}.\end{eqnarray}$$
Still assuming
 $\ell _{s2}\gg 1$
, repeating the above reasoning implies that the scaling law for the buoyancy-induced vortical force is now
 $$\begin{eqnarray}\boldsymbol{F}_{\unicode[STIX]{x1D70C}\unicode[STIX]{x1D714}2}\sim (ReFr)^{-2/3}.\end{eqnarray}$$
Making again use of (4.3), the typical orders of magnitude in (4.9) are
 $$\begin{eqnarray}\underbrace{\boldsymbol{u}_{w}\boldsymbol{\cdot }\unicode[STIX]{x1D735}\unicode[STIX]{x1D70C}}_{\mathit{O}(\unicode[STIX]{x1D70C}_{\ell }/\ell _{s2})}\,-\underbrace{\boldsymbol{u}_{\unicode[STIX]{x1D70C}}\boldsymbol{\cdot }\boldsymbol{e}_{z}}_{\mathit{O}(\unicode[STIX]{x1D70C}_{\ell }\,Re\,\ell _{s2}^{2}/Fr^{2})}\approx \,\underbrace{\boldsymbol{u}_{w}\boldsymbol{\cdot }\boldsymbol{e}_{z}-1}_{\mathit{O}(\ell _{s2}^{-(1+\unicode[STIX]{x1D6FC})})}.\end{eqnarray}$$
Given (4.10), both terms on the left-hand side are of
 $\mathit{O}(\unicode[STIX]{x1D70C}_{\ell }/\ell _{s2})$
. Hence with
 $\unicode[STIX]{x1D6FC}\rightarrow 0$
, the leading-order balance in (4.12) implies
 $\unicode[STIX]{x1D70C}_{\ell }\sim 1$
on
 $({\mathcal{S}})$
. The reasoning used in the R1 regime then immediately yields
 $$\begin{eqnarray}\boldsymbol{F}_{\unicode[STIX]{x1D70C}\unicode[STIX]{x1D70C}2}\sim Fr^{-2}.\end{eqnarray}$$
If
 $Pe\ll 1$
but
 $Pr$
is large (a combination never met in present computations), the condition
 $\ell _{\unicode[STIX]{x1D705}}\ll \ell _{s}\ll \ell _{\unicode[STIX]{x1D708}}$
implies that the R2 regime takes place if the Froude number satisfies
 $Pr^{-3/2}Re^{-1}\ll Fr\ll Re^{-1}$
. In contrast,
 $\ell _{\unicode[STIX]{x1D705}}=Pe^{-1/3}$
if
 $Pe\gg 1$
(Levich Reference Levich1962; Batchelor Reference Batchelor1980), in which case the R2 regime takes place if the Froude number stands in the range
 $Pr^{-1/2}\ll Fr\ll Re^{-1}$
. With
 $Re=0.05$
and
 $Pr=700$
, hence
 $Pe=35$
, this condition corresponds to
 $0.04\ll Fr\ll 20$
. Variations of
 $\boldsymbol{F}_{\unicode[STIX]{x1D70C}\unicode[STIX]{x1D714}}$
with
 $Fr$
in figure 5 suggest that this regime actually takes place only up to
 $Fr\approx 1$
(panel d in figure 2 corresponds to this regime). Things are less clear at first glance with
 $\boldsymbol{F}_{\unicode[STIX]{x1D70C}\unicode[STIX]{x1D70C}}$
for which the
 $-2$
slope is approximately found only for
 $Fr\gtrsim 5$
. The reason is that this contribution is affected by finite-
 $\ell _{s}$
corrections when
 $Fr$
is small enough because the estimate
 $\unicode[STIX]{x1D70C}_{\ell }\approx 1$
no longer holds. It may be shown that the most general prediction for the density disturbance obtained without assuming
 $\ell _{s2}\gg 1$
is actually
 $\unicode[STIX]{x1D70C}_{\ell }(r)\sim (\ell _{s2}/r)^{3}$
. Hence the general scaling for
 $\boldsymbol{F}_{\unicode[STIX]{x1D70C}\unicode[STIX]{x1D70C}2}$
is
 $\boldsymbol{F}_{\unicode[STIX]{x1D70C}\unicode[STIX]{x1D70C}2}\sim Re^{-1}(1+(Fr^{2}/Re)^{1/3})^{-3}$
, which reduces to (4.13) only in the limit
 $\ell _{s2}\gg 1$
. In contrast the general expression predicts
 $\boldsymbol{F}_{\unicode[STIX]{x1D70C}\unicode[STIX]{x1D70C}2}\sim Re^{-1}$
when
 $\ell _{s2}$
is very small, i.e. when
 $Fr\ll 1$
. This is why in figure 5 the negative slope of the corresponding line is seen to decrease with
 $Fr$
(a qualitatively similar alteration of (4.8) is expected to take place when
 $\ell _{s1}\ll 1$
and may be computed with similar arguments; however this regime is not reached in present computations). Comparing (4.11) and (4.13) shows that
 $\boldsymbol{F}_{\unicode[STIX]{x1D70C}\unicode[STIX]{x1D70C}2}/\boldsymbol{F}_{\unicode[STIX]{x1D70C}\unicode[STIX]{x1D714}2}$
varies as
 $Re^{2/3}$
at a given
 $Fr$
. Hence
 $\boldsymbol{F}_{\unicode[STIX]{x1D70C}\unicode[STIX]{x1D70C}}$
is again expected to be negligibly small for
 $Re\ll 1$
in the R2 regime, but the ratio
 $\boldsymbol{F}_{\unicode[STIX]{x1D70C}\unicode[STIX]{x1D70C}}/\boldsymbol{F}_{\unicode[STIX]{x1D70C}\unicode[STIX]{x1D714}}$
is larger than in the R1 regime, as confirmed by figure 5. Predictions corresponding to the R2 regime were obtained using matched asymptotic expansions by Zvirin & Chadwick (Reference Zvirin and Chadwick1975) who found the drag correction, normalized by the Stokes drag, to be
 $1.06Ri^{1/3}$
in the limit
 $Pe\rightarrow \infty$
. This implies a
 $Re^{-1}Ri^{1/3}$
-scaling of the buoyancy-induced drag, equivalent to (4.11).
Finally, an inertial–advective regime, R3, emerges if stratification is so weak that
 $\ell _{s}\gg \ell _{\unicode[STIX]{x1D708}}$
(hence
 $\ell _{s}\gg \ell _{\unicode[STIX]{x1D705}}$
, given the range of
 $Pr$
considered here). Under such circumstances, which correspond to configuration (c) in figure 4, advection dominates over viscous effects. Consequently, the relevant quasi-steady approximation of (4.2) to be considered is at leading order
 $$\begin{eqnarray}\underbrace{\boldsymbol{u}_{w}\boldsymbol{\cdot }\unicode[STIX]{x1D735}\unicode[STIX]{x1D74E}_{\unicode[STIX]{x1D70C}}}_{\mathit{O}(u/\ell _{s}^{2})}+\underbrace{\boldsymbol{u}_{\unicode[STIX]{x1D70C}}\boldsymbol{\cdot }\unicode[STIX]{x1D735}\unicode[STIX]{x1D74E}_{w}}_{\mathit{O}(u/\ell _{s}^{2})}-\underbrace{\unicode[STIX]{x1D74E}_{\unicode[STIX]{x1D70C}}\boldsymbol{\cdot }\unicode[STIX]{x1D735}\boldsymbol{u}_{w}}_{\mathit{O}(u/\ell _{s}^{2})}-\underbrace{\unicode[STIX]{x1D74E}_{w}\boldsymbol{\cdot }\unicode[STIX]{x1D735}\boldsymbol{u}_{\unicode[STIX]{x1D70C}}}_{\mathit{O}(u/\ell _{s}^{2})}\approx Fr^{-2}\underbrace{\unicode[STIX]{x1D735}\unicode[STIX]{x1D70C}\times \boldsymbol{e}_{z}}_{\mathit{O}(\unicode[STIX]{x1D70C}_{\ell }/\ell _{s})},\end{eqnarray}$$
which implies
 $\unicode[STIX]{x1D70C}_{\ell }\sim Fr^{2}u/\ell _{s}$
. As the relevant density balance is still (4.9), which imposes
 $\unicode[STIX]{x1D70C}_{\ell }\sim \ell _{s}u$
, compatibility implies
 $$\begin{eqnarray}\ell _{s}\sim \ell _{s_{3}}\equiv Fr,\end{eqnarray}$$
and the reasoning that led to (4.6) immediately yields
 $$\begin{eqnarray}\boldsymbol{F}_{\unicode[STIX]{x1D70C}\unicode[STIX]{x1D714}3}\sim (FrRe)^{-1}.\end{eqnarray}$$
At
 $r=1+\ell _{s3}$
, the velocity disturbance due to the body motion is governed by the Oseen equation. Considering moderate Froude numbers such that
 $\ell _{s}\gtrsim Re^{-1}$
, we assume that
 $\boldsymbol{u}_{w}\boldsymbol{\cdot }\boldsymbol{e}_{z}-1$
still behaves approximately as
 $r^{-(1+\unicode[STIX]{x1D6FC})}$
with
 $\unicode[STIX]{x1D6FC}\gtrsim 0$
at such distances from the body, so that the typical orders of magnitude in (4.9) are
 $$\begin{eqnarray}\underbrace{\boldsymbol{u}_{w}\boldsymbol{\cdot }\unicode[STIX]{x1D735}\unicode[STIX]{x1D70C}}_{\mathit{O}(\unicode[STIX]{x1D70C}_{\ell }/\ell _{s3})}\quad -\underbrace{\boldsymbol{u}_{\unicode[STIX]{x1D70C}}\boldsymbol{\cdot }\boldsymbol{e}_{z}}_{\mathit{O}(\unicode[STIX]{x1D70C}_{\ell }\,\ell _{s3}/Fr^{2})}\approx \,\underbrace{\boldsymbol{u}_{w}\boldsymbol{\cdot }\boldsymbol{e}_{z}-1}_{\mathit{O}(\ell _{s3}^{-(1+\unicode[STIX]{x1D6FC})})}.\end{eqnarray}$$
Again this yields
 $\unicode[STIX]{x1D70C}_{\ell }\sim 1$
, so that the scaling of
 $\boldsymbol{F}_{\unicode[STIX]{x1D70C}\unicode[STIX]{x1D70C}3}$
is found to be similar to that of
 $\boldsymbol{F}_{\unicode[STIX]{x1D70C}\unicode[STIX]{x1D70C}2}$
, viz.
 $$\begin{eqnarray}\boldsymbol{F}_{\unicode[STIX]{x1D70C}\unicode[STIX]{x1D70C}3}\sim Fr^{-2}.\end{eqnarray}$$
Variations of
 $\boldsymbol{F}_{\unicode[STIX]{x1D70C}\unicode[STIX]{x1D714}}$
shown in figure 5 display the
 $-1$
slope predicted by (4.16) for both
 $Pr=0.7$
and
 $Pr=700$
when
 $Fr\gtrsim 5$
. Thus, the R1–R3 and R2–R3 transitions are found to take place for
 $Fr$
-values of some units in both cases (panel b in figure 2 corresponds to the lower limit of the R3 regime in the high-
 $Pr$
case). Mehaddi et al. (Reference Mehaddi, Candelier and Mehling2018) determined asymptotically the first-order drag corrections due to stratification or inertia effects in the limit
 $Re\ll 1$
and
 $\ell _{s_{1}}\gg 1$
but did not identify the R3 regime. This is because
 $Fr$
is much larger than
 $Re^{-1}$
there (provided
 $Pr\gtrsim 1$
), which implies
 $\boldsymbol{F}_{\unicode[STIX]{x1D70C}\unicode[STIX]{x1D714}_{3}}\ll 1$
according to (4.16). Hence the corresponding buoyancy-induced drag correction is much smaller than the
 $\mathit{O}(1)$
Oseen inertial contribution, which was the leading-order correction computed in the limit
 $FrRe\gg 1$
by these authors.
To finish with the low-
 $Re$
range, it is interesting to have a look at the empirical low-
 $Re$
buoyancy-induced drag correction proposed by Yick et al. (Reference Yick, Torres, Peacock and Stocker2009). In this work, it was suggested that the relative increase of the drag coefficient behaves as
 $Ri^{1/2}$
provided
 $Re$
is small and
 $Pr$
is large (their equation (5.2)). This correlation was based on experimental and numerical results obtained for
 $Pr=700$
with two different Reynolds numbers,
 $Re=0.05$
and
 $0.5$
, and Froude numbers up to
 $Fr=2$
. With
 $Pr=700$
and
 $Re=0.05$
, one has
 $\ell _{\unicode[STIX]{x1D708}}\approx 20$
,
 $\ell _{\unicode[STIX]{x1D705}}\approx 0.3$
,
 $\ell _{s_{1}}\approx 0.9\,Fr^{1/2}$
and
 $\ell _{s_{2}}\approx 4.5Fr^{2/3}$
. Hence, according to the present analysis, the whole range
 $0.4\leqslant Fr\leqslant 2$
stands essentially in the R2 regime. Similarly, with
 $Pr=700$
and
 $Re=0.5$
, one has
 $\ell _{\unicode[STIX]{x1D708}}\approx 2$
,
 $\ell _{\unicode[STIX]{x1D705}}\approx 0.15$
,
 $\ell _{s_{1}}\approx 0.3\,Fr^{1/2}$
and
 $\ell _{s_{2}}\approx 2.1\,Fr^{2/3}$
. Hence data in these series approach the R1 regime for
 $Fr\approx 0.4$
(since
 $\ell _{s_{1}}\approx \ell _{\unicode[STIX]{x1D705}}$
there) and the R3 regime for
 $Fr\gtrsim 1$
(since
 $\ell _{s_{3}}\approx \ell _{\unicode[STIX]{x1D708}}$
there) but they also essentially stand in the intermediate R2 regime. As mentioned above, (4.11) implies that the relative drag increase behaves as
 $Ri^{1/3}$
in this regime, which suggests that, at a given
 $Fr$
, it should be approximately
 $2.2$
larger for
 $Re=0.5$
than for
 $Re=0.05$
when
 $Fr\gtrsim 1$
, in line with the ratio deduced from data reported by Yick et al. (Reference Yick, Torres, Peacock and Stocker2009). Conversely, in the R1 regime, equation (4.6) implies that the relative drag increase is proportional to
 $(Re/Fr)^{1/2}$
at a given
 $Pr$
, so that the ratio of the two relative drag increases should be close to
 $3.15$
for
 $Fr\approx 0.4$
, which is again in agreement with their data. Hence the correlation proposed in Yick et al. (Reference Yick, Torres, Peacock and Stocker2009) appears to be an ad hoc approximation which actually mixes two different asymptotic regimes (see § B.2 in appendix B for more details).
4.2 High-Reynolds-number range
When the Reynolds number is large,
 $\ell _{\unicode[STIX]{x1D708}}=Re^{-1/2}$
, owing to the presence of the viscous boundary layer (hereinafter abbreviated to VBL). In this
 $Re$
-range, the thickness of the diffusive boundary layer obeys
 $\ell _{\unicode[STIX]{x1D705}}=Re^{-1/2}Pr^{-1/3}$
(Acrivos Reference Acrivos1960; Levich Reference Levich1962), since we are only considering moderate-to-large Prandtl numbers. Although the scalings
 $\boldsymbol{F}_{\unicode[STIX]{x1D70C}\unicode[STIX]{x1D714}}\sim (Re\ell _{s})^{-1}\unicode[STIX]{x1D6FF}u$
and
 $\boldsymbol{F}_{\unicode[STIX]{x1D70C}\unicode[STIX]{x1D70C}}\sim Fr^{-2}\unicode[STIX]{x1D70C}_{\ell }$
derived in § 4.1 still apply, the presence of the VBL, the thickness of which is much smaller than the body radius, prevents the existence of a simple expression for
 $\boldsymbol{u}_{w}$
about the sphere. Details of the
 $\boldsymbol{u}_{w}$
-distribution within the VBL are especially important in the strongly stratified R1 and R2 regimes, since the corresponding stratification length scales are by definition (much) smaller than
 $\ell _{\unicode[STIX]{x1D708}}$
. These features make the overall situation less tractable with qualitative scaling arguments than in the low-
 $Re$
case, restricting the validity range of the corresponding predictions, especially at low Froude number.
Let us first assume that the Froude number is large enough for the stratification length scale to be such that
 $\ell _{s}\gg \ell _{\unicode[STIX]{x1D708}}\,\text{Max}(1,Pr^{-1/3})$
. Under such conditions, neither molecular diffusion nor viscosity affects the buoyancy-induced flow, defining a high-
 $Re$
R3 regime. Panels
 $(i)$
and
 $(j)$
of figure 2 provide two examples of this regime. The corresponding situation is similar to the low-
 $Re$
R3 regime except that, close to the body, it involves much larger velocity gradients. This makes it necessary to determine the scaling of
 $\ell _{s}$
within the VBL. To this end, one has to recognize that, except in the top region of the sphere where the upward jet originates, variations in directions parallel to the body surface are much slower than in the radial direction. For this reason one has to distinguish between longitudinal (
 $\unicode[STIX]{x1D735}_{\Vert }$
) and radial (
 $\unicode[STIX]{x1D735}_{\bot }$
) gradient components, and longitudinal (
 $L_{s}$
) and radial (
 $\ell _{s}$
) buoyancy length scales. One also has to take into account the fact that
 $\boldsymbol{u}_{w}^{\Vert }$
and
 $\boldsymbol{u}_{w}^{\bot }$
are respectively of
 $\mathit{O}(1)$
and
 $\mathit{O}(\ell _{\unicode[STIX]{x1D708}})$
near the outer edge of the VBL, owing to continuity. The buoyancy-induced vorticity
 $\unicode[STIX]{x1D74E}_{\unicode[STIX]{x1D70C}}$
being of
 $\mathit{O}(u/\ell _{s})$
within the VBL, the leading-order approximations of (4.1) and (4.2) for
 $r=O(1+\ell _{\unicode[STIX]{x1D708}})$
respectively reduce to
 $$\begin{eqnarray}\displaystyle & \displaystyle \underbrace{\boldsymbol{u}_{w}^{\Vert }\boldsymbol{\cdot }\unicode[STIX]{x1D735}_{\Vert }\unicode[STIX]{x1D70C}}_{\mathit{O}(\unicode[STIX]{x1D70C}_{\ell }/L_{s})}\,+\,\underbrace{\boldsymbol{u}_{w}^{\bot }\boldsymbol{\cdot }\unicode[STIX]{x1D735}_{\bot }\unicode[STIX]{x1D70C}}_{\mathit{O}(\unicode[STIX]{x1D70C}_{\ell }\ell _{\unicode[STIX]{x1D708}}/\ell _{s})}\,\approx \,\underbrace{(\boldsymbol{u}_{\unicode[STIX]{x1D70C}}\,+\,\boldsymbol{u}_{w})\boldsymbol{\cdot }\boldsymbol{e}_{z}-1}_{\mathit{O}(u)}, & \displaystyle\end{eqnarray}$$
 $$\begin{eqnarray}\displaystyle & \displaystyle \underbrace{\boldsymbol{u}_{w}^{\Vert }\boldsymbol{\cdot }\unicode[STIX]{x1D735}_{\Vert }\unicode[STIX]{x1D74E}_{\unicode[STIX]{x1D70C}}}_{\mathit{O}(u/(\ell _{s}L_{s}))}\,+\,\underbrace{\boldsymbol{u}_{w}^{\bot }\boldsymbol{\cdot }\unicode[STIX]{x1D735}_{\bot }\unicode[STIX]{x1D74E}_{\unicode[STIX]{x1D70C}}}_{\mathit{O}(u\,\ell _{\unicode[STIX]{x1D708}}/\ell _{s}^{2})}\,+\cdots \approx Fr^{-2}\underbrace{\unicode[STIX]{x1D735}\unicode[STIX]{x1D70C}\times \boldsymbol{e}_{z}}_{\mathit{O}(\unicode[STIX]{x1D70C}_{\ell }/\ell _{s})}. & \displaystyle\end{eqnarray}$$
Terms on the left-hand side have the same magnitude provided that
 $L_{s}=\ell _{\unicode[STIX]{x1D708}}^{-1}\ell _{s}$
, and compatibility between (4.19) and (4.20) implies that, close to the body,
 $$\begin{eqnarray}\ell _{s}\sim \ell _{s3}\equiv \ell _{\unicode[STIX]{x1D708}}Fr=Re^{-1/2}Fr.\end{eqnarray}$$
It may then be concluded that the condition
 $\ell _{s}\gg \ell _{\unicode[STIX]{x1D708}}\,\text{Max}(1,Pr^{-1/3})$
defining the high-
 $Re$
R3 regime corresponds to values of the Froude number such that
 $Fr\gg \text{Max}(1,Pr^{-1/3})$
, i.e.
 $Fr\gg 1$
since we are not considering low Prandtl numbers. As
 $\ell _{s3}/\ell _{\unicode[STIX]{x1D708}}\gg 1$
, the driving term in (4.19) is small at
 $r\approx 1+\ell _{s3}$
, so that the approximation
 $\unicode[STIX]{x1D6FF}u\approx 1$
holds in between
 $({\mathcal{S}})$
and
 $r=1+\ell _{s3}$
. Hence the scaling
 $\boldsymbol{F}_{\unicode[STIX]{x1D70C}\unicode[STIX]{x1D714}}\sim (Re\ell _{s})^{-1}$
derived in § 4.1 is still valid, implying
 $$\begin{eqnarray}\boldsymbol{F}_{\unicode[STIX]{x1D70C}\unicode[STIX]{x1D714}3}\sim Fr^{-1}Re^{-1/2}.\end{eqnarray}$$
Within the VBL, spatial variations of the forcing term
 $1-\boldsymbol{u}_{w}\boldsymbol{\cdot }\boldsymbol{e}_{z}$
in (4.7) deeply differ from the low-
 $Re$
case. They now correspond to a boundary-layer-type solution,
 $F(\unicode[STIX]{x1D702})$
, with
 $\unicode[STIX]{x1D702}=(r-1)/\ell _{\unicode[STIX]{x1D708}}$
, supplemented by wake corrections. Unfortunately, the explicit form of
 $F(\unicode[STIX]{x1D702})$
is unknown except in the limit
 $\unicode[STIX]{x1D702}\ll 1$
, especially in the wake region where most of the distortion of the isopycnals takes place. For this reason, a direct qualitative integration of (4.19) from
 $r=1$
to
 $r=1+\ell _{s3}$
is not possible. This is why one has to resort to a different strategy to estimate
 $\boldsymbol{F}_{\unicode[STIX]{x1D70C}\unicode[STIX]{x1D70C}3}$
. The alternative approach calls on a Lagrangian energy balance over an infinitesimal fluid element, from its initial arbitrary position to its final position close to the body surface. This balance is established in appendix C. Its final outcome is (C 6) which allows us to conclude that, close to the body but at distances from its surface larger than the VBL thickness,
 $\unicode[STIX]{x1D70C}_{\ell }\sim Fr(1+\mathit{O}(Re^{-1}))$
. Since
 $p_{\unicode[STIX]{x1D70C}\unicode[STIX]{x1D70C}}$
scales as
 $Fr^{-2}\unicode[STIX]{x1D70C}_{\ell }\,z$
on
 $({\mathcal{S}})$
(see § 4.1), one has in this regime and provided
 $Re\gg 1$
 $$\begin{eqnarray}\boldsymbol{F}_{\unicode[STIX]{x1D70C}\unicode[STIX]{x1D70C}3}\sim Fr^{-1}.\end{eqnarray}$$
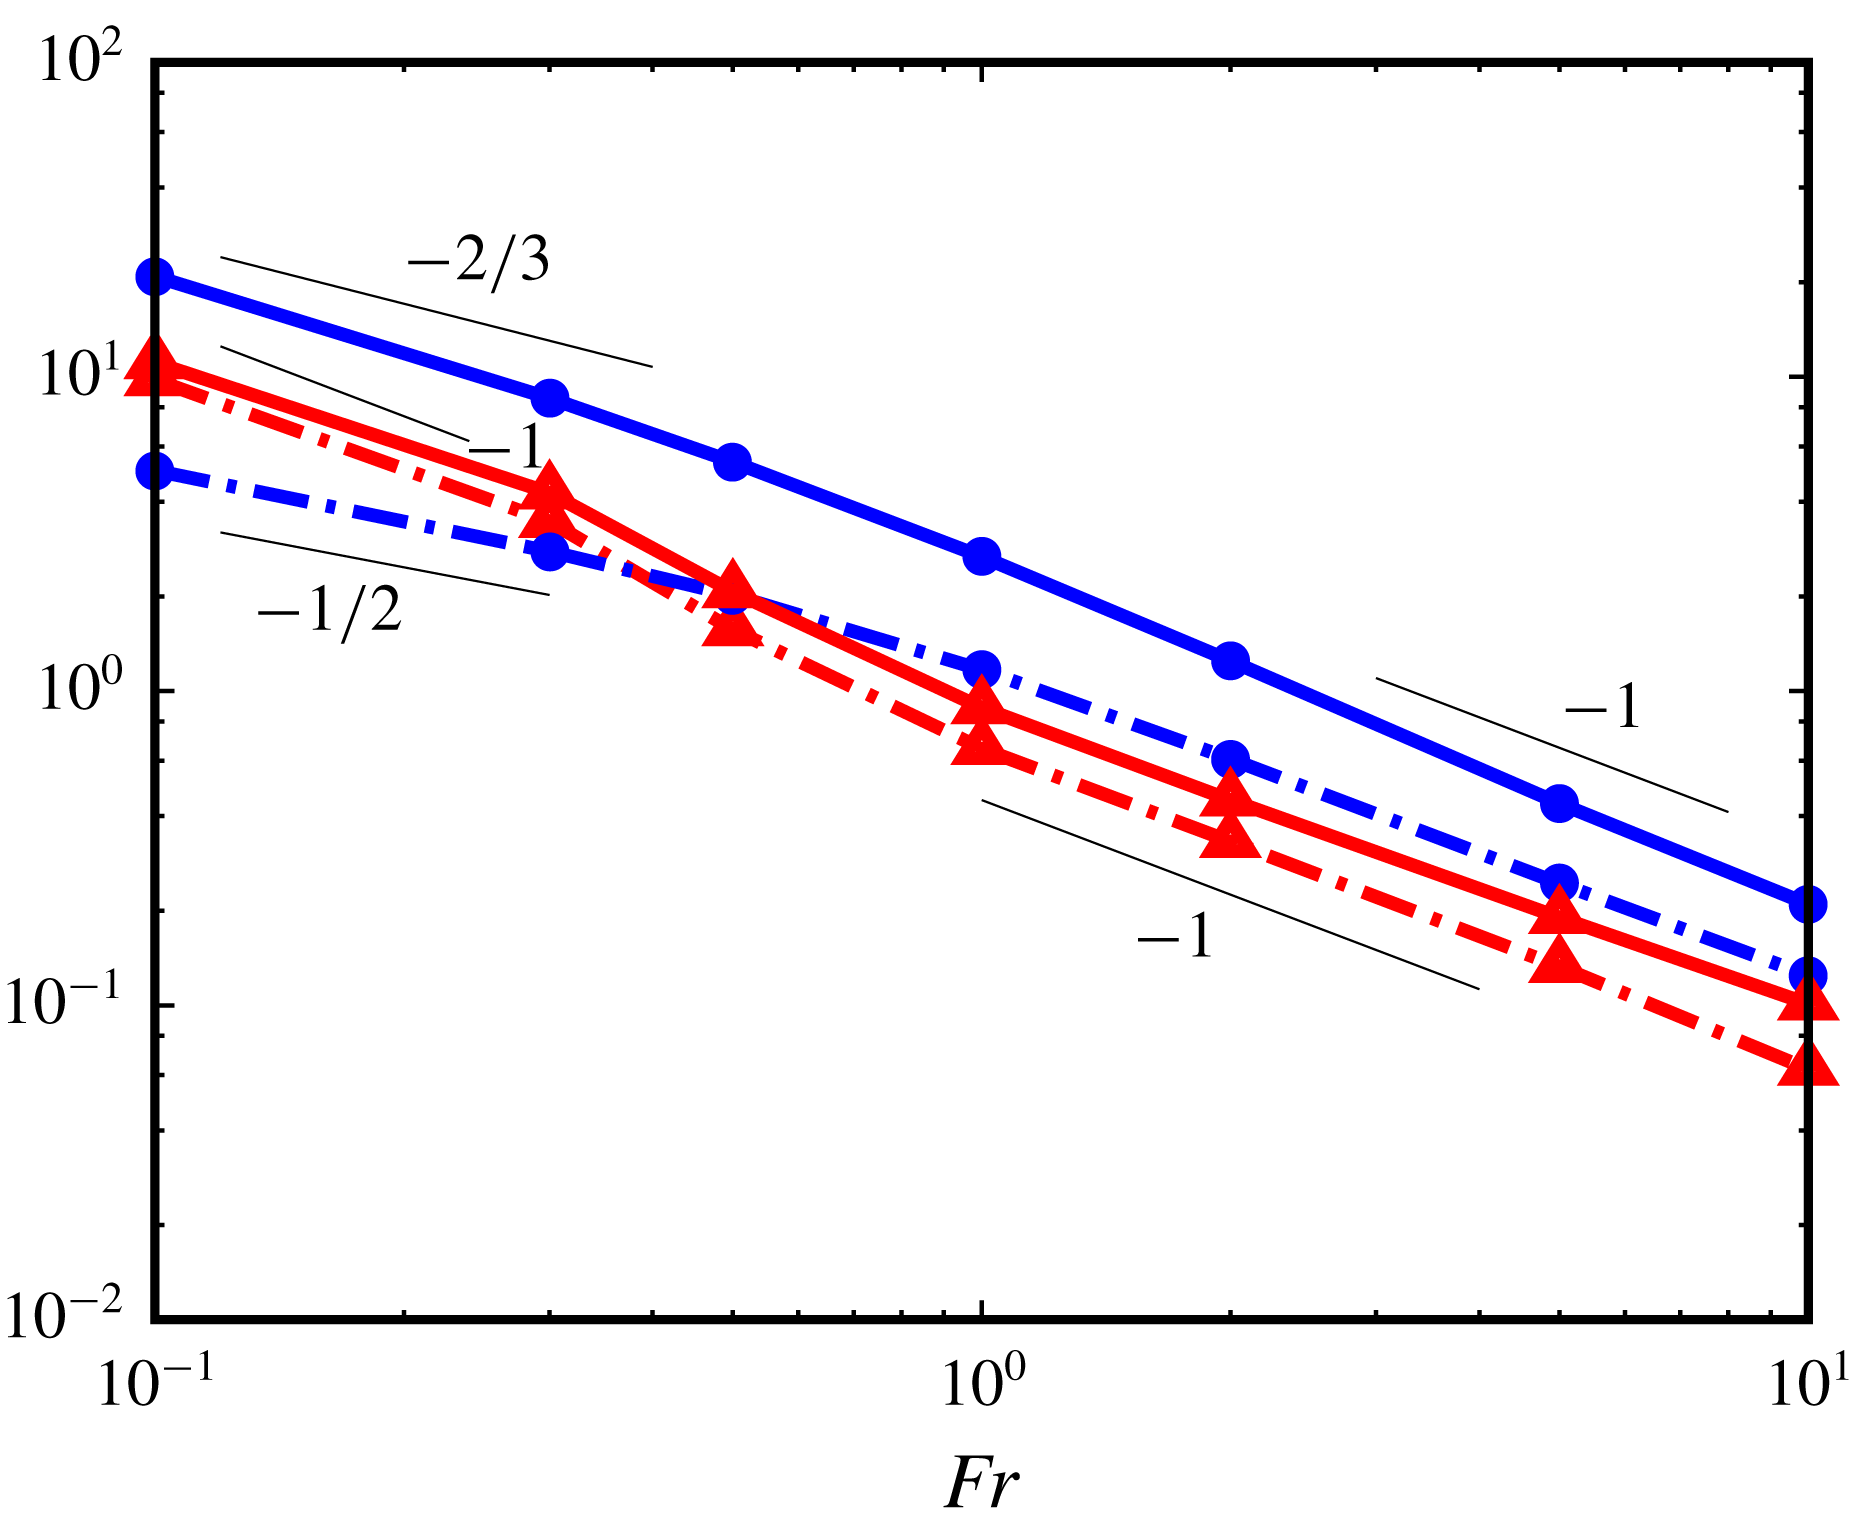
Predictions (4.22) and (4.23) are confirmed in figure 6 in which both drag components are seen to exhibit a
 $-1$
slope beyond
 $Fr\approx 1$
for
 $Pr=0.7$
and, with some slight deviations, for
 $Pr=700$
. A crucial property revealed by (4.23) is that
 $\boldsymbol{F}_{\unicode[STIX]{x1D70C}\unicode[STIX]{x1D70C}3}$
does not depend on
 $Re$
, while according to (4.22)
 $\boldsymbol{F}_{\unicode[STIX]{x1D70C}\unicode[STIX]{x1D714}3}$
still varies as
 $Re^{-1/2}$
. This is reflected in the relative magnitude of the two drag components which is now of
 $\mathit{O}(1)$
for
 $Re=100$
, although
 $\boldsymbol{F}_{\unicode[STIX]{x1D70C}\unicode[STIX]{x1D714}}$
is still typically twice as large as
 $\boldsymbol{F}_{\unicode[STIX]{x1D70C}\unicode[STIX]{x1D70C}}$
as soon as
 $Fr$
is of
 $\mathit{O}(1)$
or larger (see also panels
 $d$
and
 $f$
in figure 3). This is in stark contrast with the low-
 $Re$
regime in which the vortical contribution is always responsible for almost the entire buoyancy-induced drag increase.
Variations of normalized force components
 $\boldsymbol{F}_{\unicode[STIX]{x1D70C}\unicode[STIX]{x1D70C}}\boldsymbol{\cdot }\boldsymbol{e}_{z}/F_{w}$
(triangles, red online) and
 $\boldsymbol{F}_{\unicode[STIX]{x1D70C}\unicode[STIX]{x1D714}}\boldsymbol{\cdot }\boldsymbol{e}_{z}/F_{w}$
(circles, blue online) in the high-
 $Re$
regime (
 $Re=100$
); dash-dotted line:
 $Pr=0.7$
, solid line:
 $Pr=700$
.

Let us now examine the two low-
 $Fr$
regimes. The viscous–diffusive R1 regime takes place if
 $\ell _{s_{1}}\ll ~\text{min}(\ell _{\unicode[STIX]{x1D708}},\,\ell _{\unicode[STIX]{x1D705}})$
, i.e.
 $Fr\ll ~\text{min}(1,Pr^{-1/6})$
, with
 $\ell _{s1}$
still given by (4.5). Since
 $Pr^{-1/6}\approx 0.3$
for
 $Pr=700$
, this regime may only be observed for
 $Pr=0.7$
and
 $Pr=7$
in present computations (figure 2
 $(k)$
stands near the higher-
 $Fr$
bound of this regime). The reasoning that led to (4.6) remains unchanged. Despite the VBL structure, the estimate
 $\unicode[STIX]{x1D6FF}u=\mathit{O}(1)$
in between
 $r=1$
and
 $r=1+\ell _{s1}$
still holds, provided
 $\ell _{s1}$
, hence
 $Fr$
, is ‘not too small’. This may be seen by assuming that the flow near the sphere surface may locally be roughly approximated by Blasius’ boundary-layer solution over a flat plate. Then, considering for instance
 $Fr=0.1$
and
 $Pr=0.7$
, one has
 $\ell _{s1}/\ell _{\unicode[STIX]{x1D708}}=\unicode[STIX]{x1D702}\approx 0.35$
, a position at which the local tangential velocity predicted by Blasius’ solution is approximately
 $55\,\%$
of the free-stream velocity. Hence
 $u$
has changed from
 $u=1$
at the sphere surface to
 $u\approx 0.5$
at
 $r=1+\ell _{s1}$
for the shortest
 $\ell _{s1}$
, which makes the approximation
 $\unicode[STIX]{x1D6FF}u=\mathit{O}(1)$
still reasonable. Consequently the scaling law (4.6) for
 $\boldsymbol{F}_{\unicode[STIX]{x1D70C}\unicode[STIX]{x1D714}1}$
is unchanged at leading order. This is confirmed in figure 6 in the subrange
 $0.1\leqslant Fr\lesssim 0.3$
, in which the expected
 $-1/2$
slope is observed. This is also confirmed regarding the
 $Pr^{1/4}$
-dependence, by comparing results displayed in panels (d) and (e) of figure 3. Indeed, for
 $Fr=0.1$
,
 $\boldsymbol{F}_{\unicode[STIX]{x1D70C}\unicode[STIX]{x1D714}}(Pr=7)/\boldsymbol{F}_{\unicode[STIX]{x1D70C}\unicode[STIX]{x1D714}}(Pr=0.7)\approx 1.85$
, which is close to the expected ratio
 $10^{1/4}\approx 1.8$
. Similar to the R3 regime, one has to rely on the Lagrangian energy balance established in appendix C to estimate
 $\boldsymbol{F}_{\unicode[STIX]{x1D70C}\unicode[STIX]{x1D70C}1}$
, since most of the distortion of the isopycnals takes place outside the sublayer
 $1<r\leqslant 1+\ell _{s1}$
. In this case, equation (C 6) implies
 $\unicode[STIX]{x1D70C}_{\ell }\sim Fr(1+\mathit{O}(Re^{-1/2}))$
near the body surface, which leaves the leading-order estimate for
 $\boldsymbol{F}_{\unicode[STIX]{x1D70C}\unicode[STIX]{x1D70C}}$
unchanged, viz.
 $$\begin{eqnarray}\boldsymbol{F}_{\unicode[STIX]{x1D70C}\unicode[STIX]{x1D70C}1}\sim Fr^{-1}.\end{eqnarray}$$
The
 $Fr^{-1}$
-behaviour is observed in figure 6 for
 $Pr=0.7$
and
 $Fr\lesssim 0.3$
. Again, the high-
 $Re$
predictions suggest that the vortical component to the buoyancy-induced drag decreases as
 $Re^{-1/2}$
, and the Archimedes-like component is independent of the Reynolds number. However, while the former is still larger than the latter for
 $Re=100$
in the case of the R3 regime, the situation is reversed in the R1 regime, the ratio
 $\boldsymbol{F}_{\unicode[STIX]{x1D70C}\unicode[STIX]{x1D714}}/\boldsymbol{F}_{\unicode[STIX]{x1D70C}\unicode[STIX]{x1D70C}}$
being close to
 $0.5$
for
 $Fr=0.1$
according to figure 6. This situation is also to be compared with the low-
 $Re$
R1 regime in which this ratio is typically two orders of magnitude larger. Finally, it must be noticed that, although
 $\boldsymbol{F}_{\unicode[STIX]{x1D70C}\unicode[STIX]{x1D714}1}$
varies with the Prandtl number according to (4.6), (4.24) predicts that
 $\boldsymbol{F}_{\unicode[STIX]{x1D70C}\unicode[STIX]{x1D70C}1}$
does not. Comparing panels (d) and (e) in figure 3 confirms that increasing
 $Pr$
from
 $0.7$
to
 $7$
leaves
 $\boldsymbol{F}_{\unicode[STIX]{x1D70C}\unicode[STIX]{x1D70C}}$
unchanged in the low-
 $Fr$
range.
The R2 regime also exists when
 $Pr\gg 1$
, provided the Froude number is such that
 $\ell _{\unicode[STIX]{x1D705}}\ll \ell _{s}\ll \ell _{\unicode[STIX]{x1D708}}$
. If these inequalities hold, the relevant orders of magnitude in the vorticity equation arise from (4.3), implying
 $\unicode[STIX]{x1D70C}_{\ell }\sim Fr^{2}Re^{-1}u/\ell _{s}^{2}$
. In the density equation, they would be similar to those resulting from (4.19) if
 $\ell _{s2}$
were only ‘slightly smaller’ than
 $\ell _{\unicode[STIX]{x1D708}}$
, since the two components of
 $\boldsymbol{u}_{w}$
were evaluated near the outer edge of the VBL in (4.19). If this were the case, the density equation would imply
 $\unicode[STIX]{x1D70C}_{\ell }\sim (\ell _{s}/\ell _{\unicode[STIX]{x1D708}})u$
. However the decrease of both components of
 $\boldsymbol{u}_{w}$
with
 $\unicode[STIX]{x1D702}$
cannot be ignored if
 $\ell _{s2}$
is significantly smaller than
 $\ell _{\unicode[STIX]{x1D708}}$
, i.e.
 $\unicode[STIX]{x1D702}(\ell _{s2})\ll 1$
. In particular, Blasius’ solution suggests that
 $||\boldsymbol{u}_{w}^{\bot }||$
varies approximately linearly (respectively quadratically) with
 $\unicode[STIX]{x1D702}$
in the range
 $0.2\leqslant \unicode[STIX]{x1D702}\leqslant 0.7$
(respectively
 $0<\unicode[STIX]{x1D702}<0.2$
). Hence in the former range,
 $||\boldsymbol{u}_{w}^{\bot }||\sim \ell _{s}$
, so that the corresponding advective term in (4.19) is of
 $\mathit{O}(\unicode[STIX]{x1D70C}_{\ell })$
, and the balance with the right-hand side implies
 $\unicode[STIX]{x1D70C}_{\ell }\sim u$
. Although there is no reason to expect
 $\boldsymbol{u}_{w}$
to vary as a power law of
 $\unicode[STIX]{x1D702}$
for
 $\unicode[STIX]{x1D702}\geqslant 0.2$
(Blasius’ solution rather suggests a hyperbolic tangent behaviour), the above two distinct scalings arising from the density equation may be qualitatively gathered in the form
 $\unicode[STIX]{x1D70C}_{\ell }\sim (\ell _{s}/\ell _{\unicode[STIX]{x1D708}})^{\unicode[STIX]{x1D6FD}}u$
, with
 $\unicode[STIX]{x1D6FD}$
decreasing from 1 to 0 as
 $\ell _{s}/\ell _{\unicode[STIX]{x1D708}}$
decreases from
 $\mathit{O}(1)$
- to
 $\mathit{O}(10^{-1})$
-values. Compatibility between the leading-order balances provided by (4.3) and (4.19) then yields
 $$\begin{eqnarray}\ell _{s}\sim \ell _{s2}\equiv Re^{-1/2}Fr^{2/(2+\unicode[STIX]{x1D6FD})},\end{eqnarray}$$
which predicts the R2 regime to take place in the
 $Fr$
-range
 $Pr^{-1/3}\ll Fr\ll 1$
, since the lower bound of
 $\ell _{s2}$
is reached with
 $\unicode[STIX]{x1D6FD}\approx 0$
. We previously showed that the estimate
 $\unicode[STIX]{x1D6FF}u=\mathit{O}(1)$
is still legitimate for stratification lengths significantly smaller than
 $\ell _{\unicode[STIX]{x1D708}}$
. So, in the above range of
 $\ell _{s}/\ell _{\unicode[STIX]{x1D708}}$
, the vortical component of the buoyancy-induced drag may still be considered to scale as
 $\boldsymbol{F}_{\unicode[STIX]{x1D70C}\unicode[STIX]{x1D714}2}\sim (Re\ell _{s2})^{-1}$
, i.e.
 $$\begin{eqnarray}\boldsymbol{F}_{\unicode[STIX]{x1D70C}\unicode[STIX]{x1D714}2}\sim Re^{-1/2}Fr^{-2/(2+\unicode[STIX]{x1D6FD})}.\end{eqnarray}$$
Therefore the above reasoning predicts that variations of
 $\boldsymbol{F}_{\unicode[STIX]{x1D70C}\unicode[STIX]{x1D714}}$
in the high-
 $Re$
R2 regime should be close to a power law with an exponent standing in between
 $-2/3$
and
 $-1$
, depending on the actual ratio
 $\ell _{s2}/\ell _{\unicode[STIX]{x1D708}}$
. For
 $Re=100$
and
 $Pr=700$
,
 $\ell _{\unicode[STIX]{x1D705}}\approx 0.1\ell _{\unicode[STIX]{x1D708}}$
and, with
 $\unicode[STIX]{x1D6FD}=0$
,
 $Pr^{-(2+\unicode[STIX]{x1D6FD})/6}=Pr^{-1/3}\approx 0.11$
. Consequently the R2 regime is expected to cover a limited extent in the range
 $0.1\ll Fr\ll 1$
. A subrange with a slope corresponding to an exponent in between
 $-2/3$
and
 $-1$
is observed in the corresponding plot of figure 6, confirming the above predictions.
The situation regarding the determination of the Archimedes-like component is similar to that discussed in the R1 regime, so that the scaling (4.24) applies to
 $\boldsymbol{F}_{\unicode[STIX]{x1D70C}\unicode[STIX]{x1D70C}2}$
. In figure 6, the slope of the
 $\boldsymbol{F}_{\unicode[STIX]{x1D70C}\unicode[STIX]{x1D70C}}$
-curve corresponding to
 $Pr=700$
is observed to change for
 $Fr\approx 0.3$
, similar to that of
 $\boldsymbol{F}_{\unicode[STIX]{x1D70C}\unicode[STIX]{x1D714}}$
. For lower
 $Fr$
, this slope is close to
 $-1$
as predicted by (4.24). Similar to the other two high-
 $Re$
regimes, the scaling (4.26) predicts that
 $\boldsymbol{F}_{\unicode[STIX]{x1D70C}\unicode[STIX]{x1D714}2}$
decreases as
 $Re^{-1/2}$
, while
 $\boldsymbol{F}_{\unicode[STIX]{x1D70C}\unicode[STIX]{x1D70C}2}$
no longer varies with the Reynolds number. However, figure 6 shows that the former is still approximately twice as large as the latter for
 $Re=100$
, similar to the behaviour observed in the R3 regime.
Domains of existence of the various stratification regimes. Numbers in each row refer to the equation providing the corresponding scaling law for
 $\boldsymbol{F}_{\unicode[STIX]{x1D70C}\unicode[STIX]{x1D714}}$
and
 $\boldsymbol{F}_{\unicode[STIX]{x1D70C}\unicode[STIX]{x1D70C}}$
, respectively. The bounds of some regimes have been simplified by considering only
 $Pr$
in the range
 $[1,\,\infty ]$
.

4.3 Discussion
Table 1 summarizes the predicted domain of existence of the various asymptotic regimes derived in § § 4.1 and 4.2. It has to be noticed that, while the low-
 $Re$
R1 and R2 regimes may be associated with stratification lengths significantly larger than the body even at low
 $Fr$
(thanks to the
 $Re^{-1/2}$
and
 $Re^{-1/3}$
dependencies of
 $\ell _{s1}$
and
 $\ell _{s2}$
, respectively), this is by no means the case at high Reynolds number. Rather, the high-
 $Re$
R1 and R2 regimes correspond to situations in which the flow structure in the vicinity of the body is deeply affected by stratification, as may be realized by coming back to the longitudinal and radial buoyancy scales introduced in § 4.2. As deduced from (4.19) and (4.20),
 $L_{s}=\ell _{\unicode[STIX]{x1D708}}^{-1}\ell _{s}$
, i.e.
 $L_{s}\sim Fr^{1/2}Pr^{-1/4}$
in R1 and
 $L_{s}\sim Fr^{2/(2+\unicode[STIX]{x1D6FD})}$
in R2, with
 $0\leqslant \unicode[STIX]{x1D6FD}\leqslant 1$
. According to the bounds established for these two regimes, this implies that the longitudinal scale is such that
 $L_{s}\ll Pr^{-1/3}$
in R1 and
 $Pr^{-1/3}\ll L_{s}\ll 1$
in R2 whatever
 $\unicode[STIX]{x1D6FD}$
. Hence in both cases,
 $L_{s}$
is smaller than unity, so that the characteristic scale of buoyancy effects in directions parallel to
 $({\mathcal{S}})$
is smaller than the body scale. In other words, in these high-
 $Re$
low-
 $Fr$
regimes, stratification effects are strong enough to impose a vertical layering of the flow within the boundary layer at scales smaller than the body size.
Variations of the normalized force components from
 $Re=50$
(pale lines, yellow online) to
 $Re=100$
(dark lines, blue online). (a)
 $\boldsymbol{F}_{\unicode[STIX]{x1D70C}\unicode[STIX]{x1D714}}/F_{w}$
; (b)
 $\boldsymbol{F}_{\unicode[STIX]{x1D70C}\unicode[STIX]{x1D70C}}/F_{w}$
. Dash-dotted lines:
 $Pr=0.7$
, solid lines:
 $Pr=700$
.

Nevertheless, the most noticeable point regarding high-
 $Re$
predictions is that
 $\boldsymbol{F}_{\unicode[STIX]{x1D70C}\unicode[STIX]{x1D70C}}$
is expected to become independent of the Reynolds number in all three regimes while
 $\boldsymbol{F}_{\unicode[STIX]{x1D70C}\unicode[STIX]{x1D714}}$
always behaves as
 $Re^{-1/2}$
, as does the ‘homogeneous’ drag,
 $\boldsymbol{F}_{w}$
. The predicted difference in the high-
 $Re$
behaviours of
 $\boldsymbol{F}_{\unicode[STIX]{x1D70C}\unicode[STIX]{x1D714}}$
and
 $\boldsymbol{F}_{\unicode[STIX]{x1D70C}\unicode[STIX]{x1D70C}}$
is confirmed in figure 7 where their variations with
 $Fr$
, normalized by those of
 $\boldsymbol{F}_{w}$
, are compared at two Reynolds numbers,
 $Re=50$
and
 $100$
. Figure 7(a) confirms that
 $\boldsymbol{F}_{\unicode[STIX]{x1D70C}\unicode[STIX]{x1D714}}/F_{w}$
tends to become independent of
 $Re$
, especially when stratification effects are large: no significant variation of the normalized force is observed for
 $Fr\leqslant 5$
(respectively
 ${\leqslant}2$
) when
 $Pr=700$
(respectively
 $0.7$
). Conversely, figure 7(b) confirms that
 $\boldsymbol{F}_{\unicode[STIX]{x1D70C}\unicode[STIX]{x1D70C}}/F_{w}$
is still increasing with
 $Re$
whatever
 $Fr$
and
 $Pr$
. Since
 $F_{w}\sim Re^{-1/2}$
, the normalized
 $\boldsymbol{F}_{\unicode[STIX]{x1D70C}\unicode[STIX]{x1D70C}}$
component is expected to grow as
 $Re^{1/2}$
, i.e. to increase by a factor of approximately
 $1.4$
from
 $Re=50$
to
 $Re=100$
. The order of magnitude of the observed increase is consistent with this estimate.
This critical difference between the low- and high-
 $Re$
scalings suggests that, although the vortical contribution
 $\boldsymbol{F}_{\unicode[STIX]{x1D70C}\unicode[STIX]{x1D714}}$
generally dominates the stratification-induced drag up to Reynolds numbers of
 $\mathit{O}(10^{2})$
, the extra Archimedes force
 $\boldsymbol{F}_{\unicode[STIX]{x1D70C}\unicode[STIX]{x1D70C}}$
becomes the dominant contribution when
 $Re$
becomes very large. However, this high-
 $Re$
prediction must of course be taken with some caution since the analysis carried out here assumes that the flow is steady and axisymmetric, which is unlikely to be the case when
 $Re\rightarrow \infty$
.
Numerical results provided in § 3 and scaling laws derived in § 4 may be combined to obtain predictions of the drag increase, hence of the reduction of the settling/rising speed, beyond the bounds of the Reynolds-number range explored computationally here. To this end, one must first refer to table 1 to identify the relevant stratification regime. With this information, the relevant equations in § 4 provide the scaling laws for
 $\boldsymbol{F}_{\unicode[STIX]{x1D70C}\unicode[STIX]{x1D714}}$
and
 $\boldsymbol{F}_{\unicode[STIX]{x1D70C}\unicode[STIX]{x1D70C}}$
. The missing pre-factors are finally obtained by examining the numerical data relevant to that regime in figure 3. Examples of this extrapolation strategy are provided in appendix B in real flow configurations with settling Reynolds numbers typically two orders of magnitude beyond the upper and lower bounds considered in the simulations, respectively. Predictions obtained through this procedure are shown to agree quantitatively well with experimental data, suggesting that this extrapolation strategy is valid, even under conditions in which the instantaneous flow is presumably no longer axisymmetric (Akiyama et al.
Reference Akiyama, Yusuke, Okino and Hanazaki2019) and small-scale turbulence is present.
5 Concluding remarks
In this paper, we derived a rational splitting procedure of the flow field aimed at disentangling the various physical effects that contribute to produce an extra drag on bodies settling with a constant speed in a linearly stratified fluid. This splitting identifies three distinct contributions, out of which two dominate the buoyancy-induced drag. One is due to the alteration of the flow structure by stratifications effects, and results in an extra stress at the body surface originating in the vorticity generated by the baroclinic torque. The other is an Archimedes-like force due to the non-uniform pressure distribution resulting from the density disturbance, i.e. the distortion of the isopycnals, at the body surface. We applied this splitting scheme to a series of direct simulations spanning three decades of Reynolds number, from viscosity-dominated to inertia-dominated regimes. Similarly, we considered Prandtl numbers ranging from
 $\mathit{O}(1)$
-values typical of gases to the value
 $Pr=700$
characterizing the diffusion of salt in water. While the drag is only weakly affected by stratification effects for
 $Fr=10$
whatever the Reynolds and Prandtl numbers, its increase is significant even for Froude numbers of some units when
 $Re\ll 1$
, and exceeds by far the ‘homogeneous’ drag for
 $Fr\lesssim 1$
when
 $Re\gg 1$
. The relative magnitude of the two buoyancy-induced drag components varies with the flow parameters but the former dominates whatever
 $Pr$
when
 $Re$
is low, and at least up to
 $Re=\mathit{O}(10^{2})$
when
 $Pr$
is large. This conclusion clearly challenges the possibility of deriving regime-independent models based on a well-defined ‘entrained’ volume of fluid to predict the drag of light settling bodies and particles, especially in the ocean.
To unravel the variations of the two dominant contributions to the drag increase, we derived their scaling laws by considering the leading-order balance resulting from the governing equations. We identified the existence of three different stratification regimes at both low and high Reynolds number, depending on the strength of stratification compared to that of viscous and diffusive effects. This yields a total of twelve scaling laws, the predictions of which are supported by the numerical results. Although present computations span a limited range in Reynolds number, their bounds are sufficiently far apart to provide quantitative predictions corresponding to viscous-dominated and inertia-dominated regimes, respectively. Obviously, the scaling laws do not suffer from the same limitation with respect to the Reynolds number. This is why, as we showed on several real examples, they may be combined with the numerical results to obtain quantitative predictions of the drag increase for Reynolds numbers at least two orders of magnitude beyond the bounds considered in the computations.
Present results were obtained assuming a prescribed settling speed. However, they can be used to predict the settling speed of gravity-driven bodies for which the drag and net weight are in balance, provided acceleration effects are small and the path remains approximately vertical. Under such conditions, results provided in §§ 3 and 4 may be combined in the way discussed in appendix B to determine the ratio
 $K^{S}(Re,Fr)=C_{D}(Re,Fr)/C_{D}^{H}(Re)$
of the actual drag coefficient corresponding to the set of parameters
 $(Re,Fr)$
to its ‘homogeneous’ counterpart,
 $C_{D}^{H}(Re)$
. This determination requires an iterative process since the body speed, hence
 $Re$
and
 $Fr$
, is unknown. Once this process is converged, the vertical position of the body centroid may be predicted as a function of time. Additionally, moderate acceleration effects can be taken into account in a semi-empirical manner by incorporating the inertia force due to the body inertia and the added-mass force evaluated with the reference fluid density
 $\unicode[STIX]{x1D70C}_{0}$
in the vertical force balance. Numerical results discussed in § 3 are restricted to the specific case of a sphere. In contrast, the scaling laws derived in § 4 are not, since the derivation only involves properties of the far-field flow at low Reynolds number, and local properties of the boundary layer at high Reynolds number. Consequently, the strategy used here straightforwardly generalizes to arbitrarily shaped bodies as far as the body does not rotate. For instance, in the case of a body with no axial symmetry about the vertical direction, separate computations with a prescribed velocity along every relevant direction of space must first be performed to compute the corresponding drag opposing the prescribed motion and the possible sideways force. Having determined the pre-factors involved in the various components of
 $\boldsymbol{F}_{\unicode[STIX]{x1D70C}\unicode[STIX]{x1D714}}$
and
 $\boldsymbol{F}_{\unicode[STIX]{x1D70C}\unicode[STIX]{x1D70C}}$
through this procedure allows the quasi-static force balance along each direction to be solved, yielding all relevant components of the body velocity.
Acknowledgements
The development of the DNS code owes much to the continuous support of A. Pedrono and the expertise of F. Auguste. J.Z.’s stay at IMFT was supported by the China Scholarship Council (CSC) and the National Nature Science Foundation of China (NSFC) under grant no. 11872296.
Appendix A. Numerical techniques and validation tests
The DNS results discussed in § 3 were obtained with the JADIM code developed at IMFT. As this code has been documented in numerous papers, we only summarize the methods it is based on, and describe in more detail the specific developments carried out in direct relation with the present study.
A.1 Numerical schemes
The JADIM code makes use of a finite-volume discretization of the governing equations with a staggered arrangement of velocity and pressure nodes (Magnaudet, Rivero & Fabre Reference Magnaudet, Rivero and Fabre1995). The solution of the Navier–Stokes equations is advanced in time by combining a third-order Runge–Kutta algorithm with a semi-implicit Crank–Nicolson scheme for the viscous terms. Incompressibility is satisfied to machine accuracy at the end of each time step, thanks to a projection step during which an auxiliary potential corresponding to a pressure correction is determined by solving a Poisson equation. The resulting velocity and pressure fields are second-order accurate in both time and space (Calmet & Magnaudet Reference Calmet and Magnaudet1997).
In JADIM, spatial derivatives involved in the equation governing the transport of a scalar are usually approached with second-order centred schemes (Calmet & Magnaudet Reference Calmet and Magnaudet1997), as are those involved in the momentum equation. However, this approach undergoes well-known limitations when diffusive effects become very weak, resulting in the occurrence of wiggles in the numerical solution. To preserve the monotonicity of the density field when considering high Péclet numbers, we replaced the centred discretization of the density disturbance
 $\unicode[STIX]{x1D70C}$
in the advective flux
 $\unicode[STIX]{x1D735}\boldsymbol{\cdot }(\unicode[STIX]{x1D70C}\boldsymbol{u})$
by an upwind discretization based on the total variation diminishing (TVD) ‘monotonized central’ van Leer limiter (van Leer Reference van Leer1977). The corresponding improvement in the numerical solution is illustrated in figure 8. This figure shows how, on a given grid, the sphere drag coefficient and vertical velocity field evolve in a configuration corresponding to a strong stratification
 $(Fr=0.3)$
and a very large Péclet number (
 $Pe=7\times 10^{4}$
). The marked, irregular oscillations originally detected in the drag coefficient for
 $t\gtrsim 10$
(figure 8
a) almost disappear with the TVD scheme (figure 8
b), as do those seen in the spatial distribution of the vertical velocity in the upstream jet.
To make sure that the use of the TVD scheme does not alter the results in regions where molecular diffusion is likely to be important, we performed an additional test by evaluating the Nusselt number on a spherical bubble immersed in a high-Reynolds-number uniform flow. To achieve this test, the no-slip condition at the sphere surface was replaced by a shear-free boundary condition, the source term
 $\boldsymbol{u}\boldsymbol{\cdot }\boldsymbol{e}_{z}-1$
was switched off in the density equation and the inhomogeneous Neumann condition
 $\boldsymbol{n}\boldsymbol{\cdot }\unicode[STIX]{x1D735}\unicode[STIX]{x1D70C}=\boldsymbol{n}\boldsymbol{\cdot }\boldsymbol{e}_{z}$
was replaced by a Dirichlet boundary condition
 $\unicode[STIX]{x1D70C}=1$
on
 $({\mathcal{S}})$
. If
 $Re\gg 1$
, the flow past the bubble is close to a potential flow (up to a thin and weak boundary layer (Moore Reference Moore1963)), and the Nusselt number,
 $Nu=(2\unicode[STIX]{x03C0})^{-1}\int _{{\mathcal{S}}}\boldsymbol{n}\boldsymbol{\cdot }\unicode[STIX]{x1D735}\unicode[STIX]{x1D70C}d{\mathcal{S}}$
, obeys the law
 $Nu=(8\unicode[STIX]{x03C0}^{-1}Pe)^{1/2}$
(Rückenstein Reference Rückenstein1959). Table 2 shows that the numerical results closely follow the theoretical prediction and are unaltered by the switch from the centred discretization to the TVD approximation.
Evolution of the drag coefficient,
 $C_{D}$
, and vertical fluid velocity,
 $\boldsymbol{u}\boldsymbol{\cdot }\boldsymbol{e}_{z}-1$
, for
 $Re=100,\,Pr=700$
and
 $Fr=0.3$
. (a) Centred scheme; (b) van Leer TVD scheme.

Nusselt number for the heat/mass transfer at the surface of a spherical bubble immersed in a high-Reynolds-number uniform flow. The theoretical prediction corresponds to the limit
 $Re\rightarrow \infty$
, while the numerical predictions were obtained with
 $Re=2500$
.

A.2 Grid design and grid-independence tests
Computations were carried out on a spherical grid with a non-uniform distribution of cells in both the radial (
 $r$
) and polar (
 $\unicode[STIX]{x1D703}$
) directions. Along the latter, to allow for an accurate description of the wake region, the grid is divided into two parts (figure 9
a). Region 1, within which the distribution of cells in the
 $\unicode[STIX]{x1D703}$
-direction is non-uniform, corresponds to a conical subdomain with a
 $60^{\circ }$
half-top angle and is centred on the upper half of the flow axis. Region 2 covers the rest of the flow and has a uniform polar distribution of cells. In region 1, the polar grid spacing is decreased as the upper pole is approached, using a geometrical distribution with a common ratio of 1.04. In the
 $r$
-direction, previous grid-independence studies (e.g. Blanco & Magnaudet (Reference Blanco and Magnaudet1995), Auguste & Magnaudet (Reference Auguste and Magnaudet2018)) showed that the present code properly captures boundary layers provided they are discretized over at least 4 cells. Here we went beyond that rule of thumb and designed the grid so that 8 cells lie within the diffusive boundary layer (or the viscous boundary layer if
 $Pr<1$
). Starting from the sphere surface (
 $r=1$
), the grid spacing increases in the radial direction through a geometrical distribution with a common ratio of 1.08. The outer boundary is located at
 $r=r_{max}=40$
for
 $Re\geqslant 5$
and
 $r_{max}=80$
for smaller Reynolds numbers. These values result from a series of tests which showed very little influence of the exact location of the outer boundary on the results (especially on the drag force and the density and vertical velocity distributions at the rear of the sphere) when
 $r_{max}$
was taken twice as large as the above values. The most difficult case considered in the paper, i.e. the one involving the weakest diffusive effects and the strongest stratification influence, corresponds to
 $Re=100,\,Pr=700$
and
 $Fr=0.1$
. With the above requirements and characteristics, the corresponding
 $(r,\,\unicode[STIX]{x1D703})$
grid involves
 $160\times 200$
cells,
 $80\,\%$
of which lie in region 1 (figure 9
b). At the sphere surface, the minimum grid spacing in the
 $r$
-direction,
 $\unicode[STIX]{x1D6FF}_{r}$
, and the grid spacing in the polar direction next to the upper pole,
 $\unicode[STIX]{x1D6FF}_{\unicode[STIX]{x1D703}}$
, are identical, with
 $\unicode[STIX]{x1D6FF}_{r}=\unicode[STIX]{x1D6FF}_{\unicode[STIX]{x1D703}}=1.0\times 10^{-3}$
. As the diffusive boundary layer is much thicker when
 $Re=\mathit{O}(1)$
or less, these values are increased up to
 $\unicode[STIX]{x1D6FF}_{r}=\unicode[STIX]{x1D6FF}_{\unicode[STIX]{x1D703}}=1.0\times 10^{-2}$
when
 $Re<5$
.
A typical computational domain (
 $N_{r}\times N_{\unicode[STIX]{x1D703}}=160\times 200$
with
 $\unicode[STIX]{x1D6FF}_{\unicode[STIX]{x1D703}}=\unicode[STIX]{x1D6FF}_{r}=1.0\times 10^{-3}$
). (a) General view, with the refined region 1 aimed at capturing the small-scale wake structure downstream of the sphere; for clarity, only one out of five (respectively two) cells is displayed in each direction in region 1 (respectively region 2). (b) Zoom around the upper half of the sphere.

Conditions also have to be specified on the outer surface of the computational domain,
 $r=r_{max}$
. The undisturbed velocity
 $\boldsymbol{u}=\boldsymbol{e}_{z}$
was prescribed on the part of this boundary belonging to region 2, while the non-reflecting outlet condition described in Magnaudet et al. (Reference Magnaudet, Rivero and Fabre1995) (which makes use of a parabolized form of the momentum equation) was prescribed on the part lying in region 1. A specific treatment was applied to the density equation in order to prevent the spurious reflection of internal waves on the outer boundary. This treatment consists in considering the last five cells in the
 $r$
-direction next to the outer boundary as a sponge layer within which the density disturbance is damped thanks to a linear Rayleigh damping (Slinn & Riley Reference Slinn and Riley1998; Chongsiripinyo & Sarkar Reference Chongsiripinyo and Sarkar2017). More specifically, a term
 $-\unicode[STIX]{x1D713}(r)\unicode[STIX]{x1D70C}$
was added to the right-hand side of (2.2), with a weighting function
 $\unicode[STIX]{x1D713}(r)$
growing quadratically with
 $r$
from 0 at the inner edge of the sponge layer to 1 at
 $r=r_{max}$
. Applying a similar procedure to (2.3) was found to produce negligible difference in the results. Consequently, no damping term was introduced in the momentum equation.
(a) Evolution of the drag coefficient, and (b) variations of the vertical velocity
 $w-1$
along the wake centreline in the laboratory frame (with
 $w=\boldsymbol{u}\boldsymbol{\cdot }\boldsymbol{e}_{z}$
), both for
 $Re=100,\,Pr=700$
and
 $Fr=0.1$
. Solid line: grid I, dotted line: grid II, dash-dotted line: grid III.

To make sure that results discussed in the paper are grid independent, the specific case
 $Re=100,\,Pr=700$
and
 $Fr=0.1$
, supposed to be the most demanding, was computed on three different grids. Starting from the
 $N_{r}\times N_{\unicode[STIX]{x1D703}}=160\times 200$
grid detailed above (grid I), two finer grids were built by increasing the number of cells in the
 $r$
-direction and redistributing the 200 cells available in the
 $\unicode[STIX]{x1D703}$
-direction so as to cluster more of them in the wake region in such a way that
 $\unicode[STIX]{x1D6FF}_{\unicode[STIX]{x1D703}}$
is kept identical to
 $\unicode[STIX]{x1D6FF}_{r}$
. This yielded grid II with
 $N_{r}\times N_{\unicode[STIX]{x1D703}}=420\times 200$
and
 $\unicode[STIX]{x1D6FF}_{r}=\unicode[STIX]{x1D6FF}_{\unicode[STIX]{x1D703}}=5.0\times 10^{-4}$
, and grid III with the same number of cells in each direction but
 $\unicode[STIX]{x1D6FF}_{r}=\unicode[STIX]{x1D6FF}_{\unicode[STIX]{x1D703}}=2.5\times 10^{-4}$
. The corresponding results for the evolution of the drag coefficient and the variations of the vertical velocity on the wake centreline are shown in figure 10. All three curves superimpose almost perfectly, indicating that grid I is sufficient to resolve the boundary layer and wake regions even in this case. Consequently, this grid was used throughout the present study for
 $Re\geqslant 5$
. As already mentioned, another grid extending up to
 $r_{max}=80$
was used for cases corresponding to
 $Re<5$
; this grid has
 $N_{r}\times N_{\unicode[STIX]{x1D703}}=150\times 200$
cells and
 $\unicode[STIX]{x1D6FF}_{r}=\unicode[STIX]{x1D6FF}_{\unicode[STIX]{x1D703}}=1.0\times 10^{-2}$
.
A.3 Validation against available results
Comparison of present predictions (solid line, blue online) with available low-
 $Re$
computational or theoretical results (dotted line, red online). (a)
 $Pr=700$
, present results obtained with
 $Re=0.05$
and variable
 $Fr$
are compared with the fit of DNS data reported by Yick et al. (Reference Yick, Torres, Peacock and Stocker2009); (b) present results obtained with
 $Re=0.05$
and
 $Pr=0.7$
(i.e.
 $Pe=0.035$
) and variable
 $Fr$
are compared with the asymptotic prediction of Candelier et al. (Reference Candelier, Mehaddi and Vauquelin2014).

Comparison of the drag coefficient predicted for
 $Re=100$
and
 $Pr=700$
with results of Hanazaki et al. (Reference Hanazaki, Nakamura and Yoshikawa2015).

To complete these preliminary tests, computational predictions for the flow past a sphere settling with a prescribed speed in a linearly stratified fluid were compared with available results in both low- and high-Reynolds-number regimes.
As mentioned in § 4.1, a correlation for the extra drag experienced by a sphere for
 $Pr=700$
and
 $Re\leqslant 0.5$
was proposed by Yick et al. (Reference Yick, Torres, Peacock and Stocker2009), based on a fit of their computational findings. This correlation expresses the relative increase of the drag coefficient,
 $C_{D}$
, in the form
 $C_{D}/C_{D}^{H}-1$
, where
 $C_{D}^{H}$
stands for the drag coefficient at the same
 $Re$
in the homogeneous case. According to this correlation,
 $C_{D}/C_{D}^{H}-1\approx 1.91Ri^{0.41}$
, with
 $Ri=Re/Fr^{2}$
. The comparison of present results with this fit is displayed in figure 11(
 $a$
), which reveals a very good agreement down to
 $Ri\approx 10^{-2}$
(accuracy of the computational results reported by Yick et al. (Reference Yick, Torres, Peacock and Stocker2009) in the limit
 $Ri\rightarrow 0$
(i.e.
 $Fr\rightarrow \infty$
) was probably limited by confinement effects, since their computational domain extended only up to
 $r_{max}=40$
). We also performed a comparison with the asymptotic prediction
 $C_{D}/C_{D}^{H}-1\approx 0.662(PeRi)^{1/4}$
derived by Candelier et al. (Reference Candelier, Mehaddi and Vauquelin2014) in the limit
 $\ell _{s_{1}}\gg Pe^{-1/3}$
, with
 $\ell _{s_{1}}$
defined in (4.5). Setting
 $Re=0.05,\,Pr=0.7$
and varying
 $Fr$
over one decade, we obtained the results reported in figure 11(
 $b$
). The agreement with the theoretical prediction is excellent.
In the high-
 $Re$
range, we checked our predictions against those of Hanazaki et al. (Reference Hanazaki, Nakamura and Yoshikawa2015) for
 $Re=100$
and
 $Pr=700$
. Figure 12 shows how the drag coefficients compare throughout the
 $Fr$
-range considered in that reference (
 $0.3\leqslant Fr\leqslant 10$
). The agreement is very good whatever
 $Fr$
, with a difference less than
 $4\,\%$
for
 $Fr=0.3$
. Last, figure 13 displays iso-contours of the steady vertical velocity for
 $Fr=0.3$
. The two distributions are found to be in excellent agreement, not only regarding the maximum and minimum velocities in the jet that takes place downstream of the sphere, but also for the position and shape of the various iso-contours.
Iso-contours of the vertical velocity in the laboratory frame,
 $w-1$
, at steady state (
 $w=\boldsymbol{u}\boldsymbol{\cdot }\boldsymbol{e}_{z}$
). (a) Figure 9(a) reprinted from Hanazaki et al. (Reference Hanazaki, Nakamura and Yoshikawa2015) with permission from Cambridge University Press; (b) present results. Solid (dashed) lines correspond to
 $w-1\geqslant 0$
(
 $w-1<0$
) with intervals of
 $w_{max}/10$
(
 $\mid w_{min}-1\mid /10$
). Values mentioned within the sphere are the maximum and minimum velocities in the wake.

Appendix B. When and where are
 $\mathit{O}(1)$
Froude numbers encountered under field and laboratory conditions?

Extensive laboratory experiments and DNS have been carried out over the last two decades to describe the specific features exhibited by the stratified flow past a sphere translating vertically. However, a good part of these investigations considered configurations in which the sphere is towed at a constant speed. This is especially true in simulations, since the body is usually kept fixed and experiences a prescribed upstream velocity irrespective of its drag, hence of the strength of stratification effects (Torres et al.
Reference Torres, Hanazaki, Ochoa, Castillo and Van Woert2000; Hanazaki et al.
Reference Hanazaki, Konishi and Okamura2009b
, Reference Hanazaki, Nakamura and Yoshikawa2015). This is also the case in experiments in which the sphere motion is driven by a motor to which the body is connected by rigid wires (Hanazaki et al.
Reference Hanazaki, Kashimoto and Okamura2009a
; Okino, Akiyama & Hanazaki Reference Okino, Akiyama and Hanazaki2017; Akiyama et al.
Reference Akiyama, Yusuke, Okino and Hanazaki2019). It is often non-intuitive to figure out the actual characteristics, especially the relative body-to-fluid density contrast,
 $\unicode[STIX]{x0394}\unicode[STIX]{x1D70C}$
, that must be achieved for a gravity/buoyancy-driven body to settle or rise with prescribed values of the Reynolds and Froude numbers. Conversely, knowing the body characteristics, it is important to estimate the density gradient, i.e. the Brunt–Väisälä frequency, required for the body motion to be significantly affected by stratification effects.
These questions are examined in this appendix with two distinct but complementary goals. One is to determine the Froude number experienced by settling bodies in some real configurations, especially in the ocean. The other is to take advantage of the corresponding data to check whether or not results provided in §§ 3 and 4 may be useful to predict the settling characteristics in these systems.
Relationship between vertical velocity and buoyancy for an Argo float, showing distinctly the linear drag law (inset) corresponding to the stratification-dominated low-velocity regime, and the usual quadratic regime. In the quadratic regime, the drag coefficient differs according to the sign of the vertical velocity, because the ‘drogue’ is open (closed) when the float goes up (down). From D’Asaro (2003). ©American Meteorological Society, used with permission.

B.1 A high-
$Re$
example: Lagrangian floats

We start by considering a well-documented high-
 $Re$
case relevant to ocean observational systems, namely a Lagrangian Argo float close to its neutral buoyancy level (D’Asaro 2003). Argo floats are 1 m high cylinders maintained very close to this level by extruding a piston in and out so as to adjust their internal volume to the local water density at the desired depth. Once they reach this depth, these floats are stabilized by opening a flexible horizontal ‘drogue’ with a frontal area
 ${\mathcal{A}}=0.8~\text{m}^{2}$
. Figure 14 shows how the net mass
 $\unicode[STIX]{x0394}{\mathcal{M}}$
of the float relative to the fluid varies with its vertical velocity
 $W$
, in a case with
 $N\approx 0.015~\text{s}^{-1}$
. It emphasizes the existence of two distinct regimes: the variation is quadratic when
 $W>1~\text{cm s}^{-1}$
, but is linear when
 $W<1~\text{cm s}^{-1}$
. Data reported in this figure indicate for instance that floats with
 $\unicode[STIX]{x0394}{\mathcal{M}}=0.3~\text{kg}$
have an upward velocity
 $W\approx 9.1~\text{cm s}^{-1}$
, while the threshold velocity
 $W=1~\text{cm s}^{-1}$
between the two regimes is reached with
 $\unicode[STIX]{x0394}{\mathcal{M}}\approx 0.027~\text{kg}$
. To compare the corresponding conditions with those used in present simulations, the equivalent radius of the float (with the ‘drogue’ open in both cases) is set by imposing that the frontal area be conserved. Hence, writing
 ${\mathcal{A}}=\unicode[STIX]{x03C0}a^{2}$
yields
 $a\approx 0.50~\text{m}$
. Then, in the above two cases, the relative densities of the equivalent sphere are
 $\unicode[STIX]{x0394}\unicode[STIX]{x1D70C}=\unicode[STIX]{x0394}{\mathcal{M}}/(4/3\unicode[STIX]{x03C0}a^{3})\approx 0.56\,\text{kg m}^{-3}$
(hence
 $\unicode[STIX]{x0394}\unicode[STIX]{x1D70C}/\unicode[STIX]{x1D70C}_{0}\approx 5.4\times 10^{-4}$
) and
 $0.05\,\text{kg m}^{-3}$
(
 $\unicode[STIX]{x0394}\unicode[STIX]{x1D70C}/\unicode[STIX]{x1D70C}_{0}\approx 4.9\times 10^{-5}$
), respectively. With
 $W=9.1~\text{cm s}^{-1}$
and the above values for
 $N$
and
 $a$
,
 $Fr=W/(aN)\approx 12$
and
 $Re=aW/\unicode[STIX]{x1D708}\approx 4.6\times 10^{4}$
. Similarly, with
 $W=1~\text{cm s}^{-1}$
,
 $Fr=1.32$
and
 $Re\approx 5\times 10^{3}$
.
The corresponding drag coefficients may be determined by balancing the drag and net weight of the body in the form
 $$\begin{eqnarray}\frac{4}{3}\unicode[STIX]{x03C0}a^{3}\unicode[STIX]{x0394}\unicode[STIX]{x1D70C}g=\frac{\unicode[STIX]{x03C0}}{2}K^{S}C_{D}^{H}a^{2}\unicode[STIX]{x1D70C}_{0}W^{2},\end{eqnarray}$$
with
 $C_{D}^{H}(Re)$
the drag coefficient in a homogeneous fluid, and
 $K^{S}(Re,Fr)=C_{D}(Re,Fr)/C_{D}^{H}(Re)$
the factor by which the drag is increased by stratification effects. The above balance may also be re-written in the form
 $$\begin{eqnarray}\frac{\unicode[STIX]{x0394}\unicode[STIX]{x1D70C}}{\unicode[STIX]{x1D70C}_{0}}=\frac{3}{8}K^{S}C_{D}^{H}\frac{N^{2}a}{g}Fr^{2}\equiv \frac{3}{8}K^{S}C_{D}^{H}\frac{N^{2}a}{g}\left(\frac{\unicode[STIX]{x1D708}}{Na^{2}}\right)^{2}Re^{2}.\end{eqnarray}$$
Inserting the value of
 $\unicode[STIX]{x0394}\unicode[STIX]{x1D70C}/\unicode[STIX]{x1D70C}_{0}$
corresponding to
 $W=9.1~\text{cm s}^{-1}$
in (B 2) yields
 $K^{S}C_{D}^{H}\approx 0.86$
, i.e.
 $C_{D}^{H}\approx 0.86$
, since stratification effects only have a small influence for
 $Fr=12$
. Repeating the procedure with the low
 $\unicode[STIX]{x0394}\unicode[STIX]{x1D70C}/\unicode[STIX]{x1D70C}_{0}$
corresponding to
 $W=1~\text{cm s}^{-1}$
yields
 $K^{S}C_{D}^{H}\approx 6.47$
. The homogeneous drag coefficient
 $C_{D}^{H}$
is almost constant when
 $Re$
is very large: for a sphere,
 $C_{D}^{H}(Re=4.6\times 10^{4})\approx 0.42$
and
 $C_{D}^{H}(Re=5\times 10^{3})\approx 0.46$
. Therefore, considering that
 $C_{D}^{H}$
does not change either throughout that range for the float, one concludes that
 $K^{S}(Fr=1.32,Re=5\times 10^{3})\approx 7.5$
, i.e. stratification effects increase the drag of the float by nearly one order of magnitude.
The maximum Reynolds number reached in the present simulations is
 $10^{2}$
, which is 50 times smaller than in the above application. Therefore the corresponding flow is likely to be three-dimensional and turbulent. Nevertheless, with all due caution, we can extrapolate the computational predictions to the appropriate Reynolds number by making use of the scaling laws derived in § 4. Since
 $Fr\gtrsim 1$
, the case under consideration belongs to the high-
 $Re$
R3 regime, so that according to (4.22) and (4.23),
 $F_{\unicode[STIX]{x1D70C}\unicode[STIX]{x1D714}}\sim Re^{-1/2}Fr^{-1}$
and
 $F_{\unicode[STIX]{x1D70C}\unicode[STIX]{x1D70C}}\sim Fr^{-1}$
. As
 $K^{S}=1+F_{\unicode[STIX]{x1D70C}\unicode[STIX]{x1D714}}/F_{w}+F_{\unicode[STIX]{x1D70C}\unicode[STIX]{x1D70C}}/F_{w}$
(assuming that the inertial contribution
 $F_{\unicode[STIX]{x1D70C}u}$
stays negligible whatever
 $Re$
), we can make use of these scaling laws to infer
 $K^{S}(Fr=1.32,\,Re=5\times 10^{3})$
from the numerical results at
 $Re=100$
, for instance with
 $Fr=1$
. According to figure 3(f),
 $F_{\unicode[STIX]{x1D70C}\unicode[STIX]{x1D714}}/F_{w}\approx 2.7$
and
 $F_{\unicode[STIX]{x1D70C}\unicode[STIX]{x1D70C}}/F_{w}\approx 0.8$
for this set of parameters. Applying (4.22) and (4.23) and assuming a
 $Re^{-1/2}$
-variation for
 $F_{w}$
, we then infer
 $F_{\unicode[STIX]{x1D70C}\unicode[STIX]{x1D714}}/F_{w}\approx 2.7Fr^{-1}\approx 2.05$
and
 $F_{\unicode[STIX]{x1D70C}\unicode[STIX]{x1D70C}}/F_{w}\approx 0.8Fr^{-1}(Re/100)^{1/2}\approx 4.3$
for (
 $Fr=1.32,\,Re=5\times 10^{3}$
). These estimates imply
 $K^{S}(Fr=1.32,\,Re=5\times 10^{3})\approx 1+2.05+4.3=7.35$
, which is within
 $2\,\%$
of the experimentally determined drag. Although the
 $2\,\%$
-difference must not be taken too seriously because of uncertainties and possible error compensations, the overall agreement between this extrapolation and the actual drag of the float provides an important support to the scaling laws derived in § 4.2. Note that both
 $F_{\unicode[STIX]{x1D70C}\unicode[STIX]{x1D70C}}$
and
 $F_{\unicode[STIX]{x1D70C}\unicode[STIX]{x1D714}}$
contribute significantly to the drag increase under the above conditions, although the former is now roughly twice as large as the latter. This result indicates that, for
 $\mathit{O}(1)$
-Froude numbers, the vortical contribution to the drag increase cannot be ignored even for Reynolds numbers as large as
 $5\times 10^{3}$
.
B.2 Low Reynolds numbers
In this case it is appropriate to write the vertical force balance in the form
 $$\begin{eqnarray}{\textstyle \frac{4}{3}}\unicode[STIX]{x03C0}a^{3}\unicode[STIX]{x0394}\unicode[STIX]{x1D70C}g=6\unicode[STIX]{x03C0}K^{S}\unicode[STIX]{x1D708}\unicode[STIX]{x1D70C}_{0}aW,\end{eqnarray}$$
where
 $K^{S}$
now denotes the fraction by which the drag is increased by stratification effects and inertial corrections (
 $K^{S}=1$
under usual Stokes conditions). This balance may also be re-expressed in the form
 $$\begin{eqnarray}\frac{\unicode[STIX]{x0394}\unicode[STIX]{x1D70C}}{\unicode[STIX]{x1D70C}_{0}}=\frac{9K^{S}}{2}\frac{\unicode[STIX]{x1D708}N}{ga}Fr\equiv \frac{9K^{S}}{2}\frac{\unicode[STIX]{x1D708}^{2}}{ga^{3}}Re.\end{eqnarray}$$
To reach
 $\mathit{O}(1)$
-Froude numbers, laboratory experiments make use of very light spheres; e.g. polystyrene particles (Srdic-Mitrovic et al.
Reference Srdic-Mitrovic, Mohamed and Fernando1999; Yick et al.
Reference Yick, Torres, Peacock and Stocker2009), or porous agarose spheres mimicking marine snow (Kindler, Khalili & Stocker Reference Kindler, Khalili and Stocker2010; Camassa et al.
Reference Camassa, Khatri, McLaughlin, Prairie, White and Yu2013). In these devices, values of the Brunt–Väisälä frequency typically two orders of magnitude larger than in the ocean, from
 $1.5~\text{s}^{-1}\leqslant N\leqslant 3~\text{s}^{-1}$
(Yick et al.
Reference Yick, Torres, Peacock and Stocker2009) to
 $N\approx 7.2~\text{s}^{-1}$
(Kindler et al.
Reference Kindler, Khalili and Stocker2010), have been used to reveal effects of stratification within reasonably tall tanks (some tens of centimetres). By the time particles are released at the top of the tank, their relative density ratio is typically
 $1-4\,\%$
and the corresponding Froude number is moderate or even large. As they settle in denser water,
 $\unicode[STIX]{x0394}\unicode[STIX]{x1D70C}/\unicode[STIX]{x1D70C}_{0}$
decreases, until it is reduced to some per thousand. It is during this late stage that stratification effects become prominent. This evolution is clearly seen in figure 15.
Parameter range covered by laboratory experiments performed in a linear stratified fluid with polystyrene spheres with
 $a=196\,\unicode[STIX]{x03BC}\text{m}$
(experiments 1, 2, 3, 5, 6, 9 and 10) and
 $a=390\,\unicode[STIX]{x03BC}\text{m}$
(experiments 4, 7, 8 and 11). Values of
 $N$
range from
 $N\approx 1.7~\text{s}^{-1}$
(e.g. in runs 1 and 2), to
 $N\approx 3~\text{s}^{-1}$
(e.g. in runs 3 and 6). From Yick et al. (Reference Yick, Torres, Peacock and Stocker2009), with permission from Cambridge University Press.

Runs 1 and 2 in this figure were performed with
 $a\approx 0.2~\text{mm}$
,
 $N=1.7~\text{s}^{-1}$
and
 $\unicode[STIX]{x1D708}=1.15\times 10^{-6}~\text{m}^{2}~\text{s}^{-1}$
, in which case the relation
 $Re/Fr=Na^{2}/\unicode[STIX]{x1D708}$
implies
 $Re\approx 0.06$
for
 $Fr=1$
. According to figure 5, with
 $Pr=700$
such conditions correspond to the low-
 $Re$
R2 regime in which (4.11) and (4.13) indicate that
 $F_{\unicode[STIX]{x1D70C}\unicode[STIX]{x1D714}}/F_{w}$
and
 $F_{\unicode[STIX]{x1D70C}\unicode[STIX]{x1D70C}}/F_{w}$
scale as
 $(Re/Fr^{2})^{1/3}$
and
 $Re/Fr^{2}$
, respectively. Nevertheless,
 $F_{\unicode[STIX]{x1D70C}\unicode[STIX]{x1D70C}}$
is two orders of magnitude smaller than
 $F_{\unicode[STIX]{x1D70C}\unicode[STIX]{x1D714}}$
, as figure 3(c) confirms. Hence the drag enhancement factor essentially behaves as
 $K^{S}(Fr=1,\,Pr=700)\approx 1+\unicode[STIX]{x1D6FD}_{2}Re^{1/3}$
. Figure 3(c) provides
 $F_{\unicode[STIX]{x1D70C}\unicode[STIX]{x1D714}}/F_{w}\approx 0.5$
for
 $Re=0.05$
and
 $Fr=1$
, hence
 $\unicode[STIX]{x1D6FD}_{2}\approx 1.35$
. With this pre-factor one gets
 $K^{S}\approx 1.53$
for
 $Re=0.06$
, which corresponds to a
 $53\,\%$
stratification-induced drag increase. This is consistent with curve 1 in figure 15, in which the Froude number decreases gradually from 1.6 until 0.25. From (B 4) one then deduces that the pivotal value
 $Fr=1$
is reached when
 $\unicode[STIX]{x0394}\unicode[STIX]{x1D70C}/\unicode[STIX]{x1D70C}_{0}\approx 7\times 10^{-3}$
. Just as we showed in § B.1, the scaling laws derived in § 4.1 may also be used to predict
 $K^{S}$
for Reynolds numbers lower than those considered in the DNS. For instance, the extreme point
 $(Fr=0.1,\,Re=0.01)$
reached at the end of run 3 in figure 15 also belongs to the R2 regime (see table 1). Setting again
 $K^{S}(Fr,\,Re,\,Pr=700)\approx 1+1.35(Re/Fr^{2})^{1/3}$
, one infers
 $K^{S}(0.1,\,0.01)\approx 2.35$
, which reveals a
 $135\,\%$
drag increase yielding
 $\unicode[STIX]{x0394}\unicode[STIX]{x1D70C}/\unicode[STIX]{x1D70C}_{0}\approx 1.25\times 10^{-3}$
according to (B 4). Given the large
 $N$
, the decrease in
 $\unicode[STIX]{x0394}\unicode[STIX]{x1D70C}/\unicode[STIX]{x1D70C}_{0}$
from the position where
 $Fr=1$
until that where
 $Fr=0.1$
takes place within
 $2~\text{cm}$
in this experiment.
Note that if the Reynolds number becomes so small that the actual conditions rather belong to the R1 regime, equation (4.6) and the negligible magnitude of
 $\boldsymbol{F}_{\unicode[STIX]{x1D70C}\unicode[STIX]{x1D70C}}$
imply
 $K^{S}=1+\unicode[STIX]{x1D6FD}_{1}(Re/Fr)^{1/2}Pr^{1/4}$
. Results displayed in figure 3(a) for
 $(Pr=0.7,\,Re=0.05)$
may be used to determine
 $\unicode[STIX]{x1D6FD}_{1}$
. In particular, considering the drag increase observed for
 $Fr=0.1$
yields
 $\unicode[STIX]{x1D6FD}_{1}\approx 0.75$
. This closes the expression for
 $K^{S}$
, which may then be employed to obtain predictions at the desired
 $\unicode[STIX]{x0394}\unicode[STIX]{x1D70C}/\unicode[STIX]{x1D70C}_{0}$
with
 $Pr=700$
.
In the upper ocean and estuarine zones, the most relevant low-
 $Re$
particles, the fate of which is recognized to be affected by stratification effects, are the aggregates commonly referred to as marine snow. ‘Abnormal’ retention of marine snow is primarily observed in strong haloclines characterized by values of
 $N$
significantly larger than the standard value
 $N=0.01\,\text{s}^{-1}$
corresponding to the average vertical density distribution in the ocean. For instance, high concentrations of marine snow were observed in haloclines with
 $0.04\,\text{s}^{-1}\leqslant N\leqslant 0.07\,\text{s}^{-1}$
by MacIntyre et al. (Reference MacIntyre, Alldredge and Gotschalk1995) and Alldredge et al. (Reference Alldredge, Cowles, MacIntyre, Rines, Donaghay, Greenlaw, Holliday, Dekshenieks, Sullivan and Zaneveld2002). They may a fortiori happen with larger
 $N$
, especially in estuaries and fjords where values of
 $N$
up to
 $0.2~\text{s}^{-1}$
have been reported (Farmer & Armi Reference Farmer and Armi1999). The size distribution of marine snow is broad, from less than
 $100\,\unicode[STIX]{x03BC}\text{m}$
to approximately
 $1\,\text{cm}$
. Its excess relative density is very low when the porosity
 $\unicode[STIX]{x1D719}_{P}$
goes beyond
 $0.99$
; e.g.
 $\unicode[STIX]{x0394}\unicode[STIX]{x1D70C}/\unicode[STIX]{x1D70C}_{0}\approx 1.9\times 10^{-4}$
with
 $\unicode[STIX]{x1D719}_{P}\approx 0.996$
(Ploug et al.
Reference Ploug, Grossart, Azam and Jorgensen1999; Ploug, Iversen & Fischer Reference Ploug, Iversen and Fischer2008). Assuming
 $N=0.05\,\text{s}^{-1}$
and keeping the above value
 $a=0.2~\text{mm}$
unchanged, the ratio
 $Re/Fr$
appropriate to such aggregates is typically
 $35$
times smaller than in the laboratory experiments discussed above. This situation still belongs to the R2 regime. With
 $\unicode[STIX]{x0394}\unicode[STIX]{x1D70C}/\unicode[STIX]{x1D70C}_{0}\approx 1.9\times 10^{-4}$
, equation (B 4) yields
 $Fr\approx 1.25$
, which confirms that the settling of such aggregates is deeply influenced by stratification effects.
B.3 Immiscible fluids with similar viscosities
Finally, it is worth mentioning that
 $\mathit{O}(1)$
-Froude numbers are also encountered during the settling or rise of particles and drops through interfaces separating immiscible fluids with similar viscosities. In this case, capillary effects characterized by a capillary length
 $\ell _{c}=(\unicode[STIX]{x1D6FE}/(\unicode[STIX]{x1D70C}_{2}-\unicode[STIX]{x1D70C}_{1})g)^{1/2}$
are involved (
 $\unicode[STIX]{x1D70C}_{2}$
and
 $\unicode[STIX]{x1D70C}_{1}$
denote the densities of the heavy and light fluids, respectively, and
 $\unicode[STIX]{x1D6FE}$
is the interfacial tension). Nevertheless, provided
 $a\gg \ell _{c}$
and/or inertia effects dominate the flow past the particle in the initial fluid, the settling or rise is governed by the particle Reynolds and Froude numbers, the latter being now based on an equivalent Brunt–Väisälä frequency defined as
 $N^{2}=(2g)/a(\unicode[STIX]{x1D70C}_{2}-\unicode[STIX]{x1D70C}_{1})/(\unicode[STIX]{x1D70C}_{2}+\unicode[STIX]{x1D70C}_{1})$
. An example of such a situation is shown in figure 16. In this case, the particle crosses the interface separating a silicone oil top layer from a bottom layer made of a water–glycerin mixture, both with viscosities in the range
 $50-90$
cP. Here,
 $\unicode[STIX]{x1D70C}_{2}/\unicode[STIX]{x1D70C}_{1}\approx 1.26$
,
 $\unicode[STIX]{x0394}\unicode[STIX]{x1D70C}/\unicode[STIX]{x1D70C}_{1}\approx 1.25$
,
 $Re\approx 30,\,Fr\approx 3$
, based on
 $\unicode[STIX]{x1D70C}_{1}$
and
 $W_{1}$
, the settling speed in the upper fluid. As the figure suggests, large buoyancy effects take place in this configuration, due to the long tail entrained by the particle. The origin of this tail is similar to the distortion of the isopycnals in the miscible case, although the stratification is by no means linear in the present case, making the particle velocity change over time. More specifically, the particle speed passes through a minimum
 $W(t)\approx 0.67W_{1}$
, before it slightly re-increases up to a final value
 $W_{2}\approx 0.75W_{1}$
. Existence of this minimum is characteristic of
 $\mathit{O}(1)$
-
 $Fr$
situations in two-layer set-ups, both with immiscible and miscible fluids (see e.g. Srdic-Mitrovic et al. (Reference Srdic-Mitrovic, Mohamed and Fernando1999) and Blanchette & Shapiro (Reference Blanchette and Shapiro2012) for the latter), and constitutes the footprint of buoyancy-induced effects on the time variation of the settling speed. Note that in this case, the large
 $N$
(
 $N\approx 21~\text{s}^{-1}$
) allows
 $\unicode[STIX]{x0394}\unicode[STIX]{x1D70C}/\unicode[STIX]{x1D70C}_{1}$
to be much larger than in miscible situations considered so far, and the large viscosity limits the Reynolds number to a few tens, even for centimetre-size particles. The configuration just described is encountered in many engineering applications; e.g. steel elaboration (with impurities crossing the interface separating the liquid metal from the top slag layer), encapsulation, the liquid–liquid extraction process in chemical engineering, scenarios of nuclear accidents with bubbles rising through stratified corium layers, etc.
A 10 mm diameter Teflon sphere settling through a silicone oil/water–glycerin set-up, with
 $\unicode[STIX]{x0394}\unicode[STIX]{x1D70C}/\unicode[STIX]{x1D70C}_{1}=1.25,\,Re\approx 30,\,Fr\approx 3$
. From Pierson & Magnaudet (Reference Pierson and Magnaudet2018), with permission from Cambridge University Press.

Appendix C. Lagrangian energy balance over a fluid element
Consider a fluid element initially at rest at position
 $\boldsymbol{x}_{\mathbf{0}}=(x_{0},y_{0},z_{0})$
with respect to the sphere centre. At the current instant of time, the sphere has moved downward by a distance
 $t$
and the fluid element stands at position
 $\boldsymbol{x}=(x,y,z)$
with respect to the current position of its centre. Neglecting diffusive effects, the density balance (2.2) reduces to
 $$\begin{eqnarray}\frac{\text{D}}{\text{D}t}\{\unicode[STIX]{x1D70C}-z+t\}=0,\end{eqnarray}$$
where
 $\text{D}/\text{D}t$
denotes the material derivative and the identity
 $\text{D}z/\text{D}t=\boldsymbol{u}\boldsymbol{\cdot }\boldsymbol{e}_{z}$
has been used. Thus, assuming that the initial density disturbance is zero, the density of the fluid element evolves according to
 $$\begin{eqnarray}\unicode[STIX]{x1D70C}(\boldsymbol{x},t)+t=z-z_{0}.\end{eqnarray}$$
Forming the dot product of the momentum balance (2.3) with
 $\boldsymbol{u}$
, the energy balance on the fluid element may be written in the form
 $$\begin{eqnarray}\displaystyle \frac{\text{D}}{\text{D}t}\left(\frac{\boldsymbol{u}\boldsymbol{\cdot }\boldsymbol{u}}{2}\right)=\unicode[STIX]{x1D735}\boldsymbol{\cdot }(\boldsymbol{u}\boldsymbol{\cdot }\unicode[STIX]{x1D64F})-Fr^{-2}\unicode[STIX]{x1D70C}\frac{\text{D}z}{\text{D}t}-\unicode[STIX]{x1D716}, & & \displaystyle\end{eqnarray}$$
where
 $\unicode[STIX]{x1D716}=1/2Re^{-1}(\unicode[STIX]{x1D735}\boldsymbol{u}+\unicode[STIX]{x1D735}\boldsymbol{u}^{\text{T}}):(\unicode[STIX]{x1D735}\boldsymbol{u}+\unicode[STIX]{x1D735}\boldsymbol{u}^{\text{T}})$
is the viscous dissipation rate and
 $\unicode[STIX]{x1D64F}=-p\mathbb{I}+Re^{-1}(\unicode[STIX]{x1D735}\boldsymbol{u}+\unicode[STIX]{x1D735}\boldsymbol{u}^{\text{T}})$
is the stress tensor. To reveal the complete expression of the potential energy, one has to remove the contribution proportional to
 $Fr^{-2}$
in the pressure field
 $p$
. This amounts to introducing the pressure field
 $p^{\ast }=p+Fr^{-2}(zt-z^{2}/2)$
which does not involve any buoyancy contribution, and the corresponding stress tensor
 $\unicode[STIX]{x1D64F}^{\ast }=-p^{\ast }\mathbb{I}+Re^{-1}(\unicode[STIX]{x1D735}\boldsymbol{u}+\unicode[STIX]{x1D735}\boldsymbol{u}^{\text{T}})$
. Then (C 3) becomes
 $$\begin{eqnarray}\displaystyle \frac{\text{D}}{\text{D}t}\left(\frac{\boldsymbol{u}\boldsymbol{\cdot }\boldsymbol{u}}{2}\right)=\unicode[STIX]{x1D735}\boldsymbol{\cdot }(\boldsymbol{u}\boldsymbol{\cdot }\unicode[STIX]{x1D64F}^{\ast })-Fr^{-2}(\unicode[STIX]{x1D70C}+t-z)\frac{\text{D}z}{\text{D}t}-\unicode[STIX]{x1D716}. & & \displaystyle\end{eqnarray}$$
According to (C 2), one has
 $(\unicode[STIX]{x1D70C}+t-z)\text{D}z/\text{D}t=1/2(\text{D}/\text{D}t)((\unicode[STIX]{x1D70C}+t)^{2}-z^{2})$
. Considering a fluid element that eventually comes to rest with respect to the body, integration of (C 4) then yields
 $$\begin{eqnarray}\displaystyle -\,\frac{1}{2}+\frac{1}{2}Fr^{-2}[(\unicode[STIX]{x1D70C}(\boldsymbol{x},t)+t)^{2}+z_{0}^{2}-z^{2}]=\int _{0}^{t}\unicode[STIX]{x1D735}\boldsymbol{\cdot }(\boldsymbol{u}\boldsymbol{\cdot }\unicode[STIX]{x1D64F}^{\ast })\,\text{d}t^{\prime }-\int _{0}^{t}\unicode[STIX]{x1D716}\,\text{d}t^{\prime }, & & \displaystyle\end{eqnarray}$$
where all variables in the integrands depend on the current position
 $\boldsymbol{x}^{\prime }$
and time
 $t^{\prime }$
along the path. The two terms on the left-hand side of (C 5) respectively represent the total variation of the kinetic and potential energies of the fluid element along its path. The two terms on the right-hand side respectively represent the cumulated stress flux exchanged through its surface with the surrounding fluid and the cumulated dissipation within the fluid element. Thanks to (C 2), the term in square brackets reduces to
 $1/2[(z-z_{0})^{2}+z_{0}^{2}-z^{2}]=z_{0}(z_{0}-z)$
, which on average equals
 $z_{0}^{2}$
on the sphere surface. Thus if the fluid element reaches
 $({\mathcal{S}})$
or comes very close to it, the typical magnitude of the total density disturbance,
 $\unicode[STIX]{x1D70C}+t$
, on
 $({\mathcal{S}})$
is
 $\unicode[STIX]{x1D70C}_{\ell }\approx z_{0}$
. In (C 5), the dissipation rate is of
 $\mathit{O}(Re^{-1})$
in the bulk and of
 $\mathit{O}(1)$
within the boundary layer since
 $Re\gg 1$
. Nevertheless, most of the distortion of the isopycnals takes place in the bulk. Moreover, as
 $\ell _{\unicode[STIX]{x1D708}}\sim Re^{-1/2}$
, the time spent by the fluid element within the boundary layer is typically smaller by a factor of
 $\mathit{O}(Re^{-1/2})$
compared to the time it spends in the bulk. Hence, viscous effects only play a secondary role in (C 5), making variations of the potential and kinetic energies essentially in balance. Consequently (C 5) yields
 $$\begin{eqnarray}\underbrace{z_{0}(z_{0}-z)}_{\mathit{O}(\unicode[STIX]{x1D70C}_{\ell }^{2})}\approx Fr^{2}(1+\mathit{O}(Re^{-n})),\end{eqnarray}$$
with
 $n=1$
if the fluid element eventually stands outside the boundary later (R3 regime) and
 $n=1/2$
if it stands within it (R1 and R2 regimes). This implies the leading-order scaling
 $\unicode[STIX]{x1D70C}_{\ell }\sim Fr$
in both cases, in line with the conclusion reached by Higginson et al. (Reference Higginson, Dalziel and Linden2003) in the inviscid limit.