Political divisions based on class would seem to be central to contemporary American politics. Inequalities in the distribution of income and wealth have grown steadily over the last 30 years, creating greater differences in opportunity and challenging the longstanding American belief in equality of opportunity (Hochschild 1995). The two major parties differ sharply in their concern for class issues, making class political divisions all the more likely.
Despite these trends, for much of the last several decades the dominant conclusion has been that class has not mattered very much in American politics. While it was generally agreed that class divisions had some political relevance from the 1930s through the 1950s, by the 1970s and 1980s they were thought to have only declining relevance. The standard argument was that post-war America had experienced a widespread increase in affluence, lessening the relevance of economic concerns as a source of political division. Economic divisions increasingly were seen as having been displaced by disagreements over issues intertwined with race, culture, or values (see, for example, Inglehart 1971; 1977; 1990). This analysis reviews the ways in which we have thought about class divisions in American politics and then examines what has actually transpired.
The Post-World War II Era
In the years following World War II, there were reasons to presume that conflicts over economic issues were less relevant than they had been in previous decades. While there had been enormous inequality and little income growth during the 1930s, World War II spurred the American economy, and in the 1950s and 1960s, incomes increased steadily and inequality declined as a result. In addition, in the decades between the World Wars, it appeared that Republicans generally had accepted the New Deal and its safety nets, and fundamental conflicts over whether government would play a significant role in society were resolved.
These economic trends were accompanied by analyses arguing that material concerns had become less salient in people's lives. Bell (1962) argued that the great political issues were settled and ideological conflicts were over. Inglehart (1971; 1977; 1990) led the argument that the United States had entered a post-industrial era in which people were more concerned with the quality of life than they were with material concerns (see also Ladd and Hadley 1978). Race, in particular, was posited as a major source of division between the parties (Carmines and Stimson 1989; Edsall and Edsall 1991, 137–153), displacing class divisions (Huckfeldt and Kohfeld 1989, 6–16) as had already been the case in the South for decades (Key 1949). Other observers saw the post-1960s era as a time when cultural issues (including crime, abortion, homosexuality, pornography, and free speech) came to dominate American politics, presumably because economic disparities had grown less politically significant (Wattenberg 1995).
The consequence was a widespread conclusion that political divisions based on class were no longer particularly relevant. Some measured class using self-identified social class (Alford 1963; Flanigan and Zingale 1994) while others used socioeconomic status (Ladd and Hadley 1978).1
With regard to class self-identity, respondents in ANES surveys were presented with a question of whether they regarded themselves as middle or working class. With regard to socioeconomic status, respondents were classified based on a combination of their income, education, and occupation.
A Premature Conclusion?
Although at one time American class divisions may in fact have narrowed, that decline may well have reflected a combination of conditions that subsequently have changed. Further, analyses focusing on self-identified class or socioeconomic status2
The approaches that were used to measure class had reasonable logics. Those following the Marxian tradition focused on whether a worker held a non-manual or manual job (Alford 1963, 79–81). Others conceived of class as a composite of indicators of socioeconomic status, combining income, education, and occupation (Ladd and Hadley 1978, 64–74; Petrocik 1981, 172–173). These seemingly objective indicators drew criticism on the grounds that they did not recognize the importance of class consciousness or social self-location. In order to shift emphasis to how people see themselves, surveys in the 1940s began to ask people whether they regarded themselves as middle or working class (Abramson, Aldrich, and Rohde 1995, 153; Jackman and Jackman 1983). Each of these measures has drawbacks. The manual/non-manual job distinction, while perhaps once a useful division, does little to capture the enormous variation in the economic situations of people in non-manual jobs in today's complex economy (Brooks and Manza 1997a; 1997b). The SES indicators, which incorporate education and occupation, measure status as much as economic position. Status involves notions of the value or respect accorded to some position, but status is quite different than relative economic situation (Segal and Knoke 1971, 942). Moreover, self-identified class, while valuable as a reflection of self-perceived status, does not specifically track economic location.
Class divisions are likely to be limited when inequality is declining and when parties do not differ much on public policy; divisions are likely to be greater when inequality is growing and when the parties differ on policy alternatives. The United States has experienced considerable variation in both inequality and party differences over time, which should create corresponding differences in class divisions.
In brief, inequality and party differences were substantial in the 1930s and 1940s. From the 1950s through the 1970s, both inequality and party divisions were declining. Since then inequality has increased, as have party differences about public policy (McCarty, Poole, and Rosenthal 2006). These long-term changes should have produced corresponding changes in class divisions (Stonecash 2006).
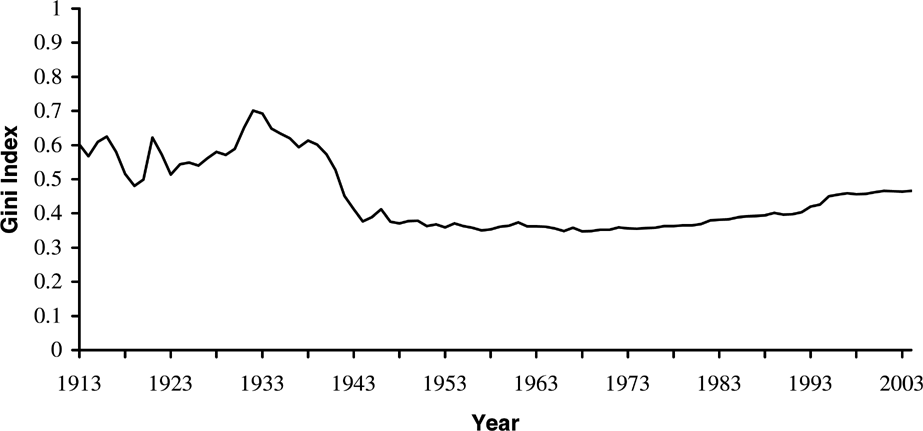
Figure 1 displays the pattern of inequality in the distribution of income, measured by the Gini index,3
The Gini index (Plotnick, Smolensky, Evenhouse, and Reilly 1998) measures how evenly incomes are distributed. It runs from 0 to 1. A score of zero indicates there is no difference between the percentage of the population and the percentage of income received by that population. High scores indicate that a small percentage of the population has a large percentage of income. The greater this discrepancy is, the greater the inequality, and the higher the Gini index. Plotnick and colleagues use the Gini index for family incomes from the Bureau of the Census for 1947–1996. To estimate scores for 1913–1964, they first fit an equation to estimate the Gini index for 1947–1996 using several independent variables. Then they use the parameters derived from the 1947–1996 equation results and data on the same independent variables from 1913–1946 and estimate a Gini index for 1913–1946. The Gini index from 1997–2004 is taken from the U.S. Census Bureau Historical Income Tables.

Inequality in the Distribution of Income (the Gini Index), 1913 to 2004
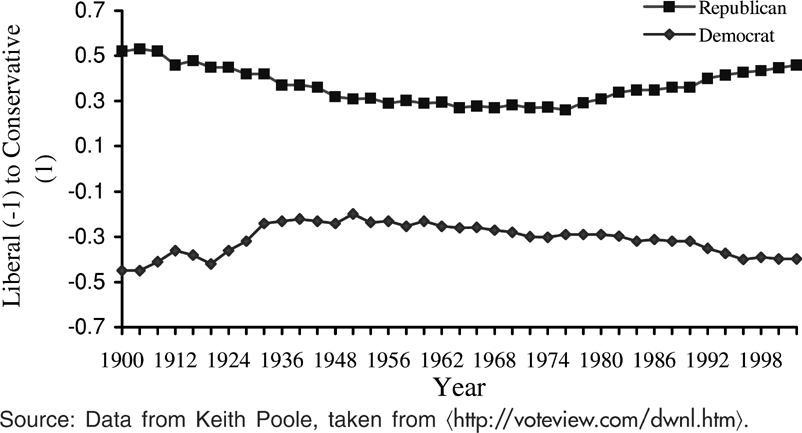
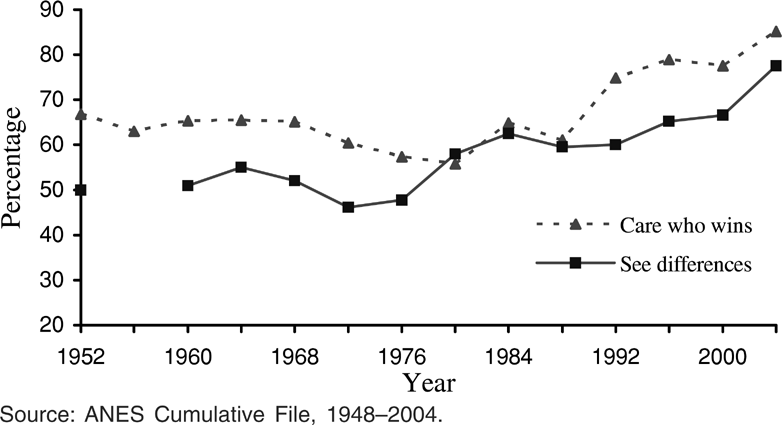
Given these variations, the other important matter is whether the parties differ substantially on policy alternatives and whether voters recognize such differences. Previous research shows that differences between the parties follow a pattern very similar to that of inequality (Stonecash, Brewer, and Mariani 2003). Figure 2 presents party differences using the DW-NOMINATE scores developed by Keith Poole. Differences were relatively great during the first half of the 20th century and then gradually declined from the 1940s through most of the 1970s. Then the differences began to increase, and they are now as great as they were a hundred years ago (Gerring 1998, 125–158, 232–253; Stonecash 2006; Taylor 1996). Voters have recognized these growing differences. As Figure 3 indicates, respondents in national surveys increasingly say they see differences between the two parties and care about who wins the presidential election.

Average Party DW-Nominate Scores, House of Representatives, 1900–2002

Voter Awareness of Party Differences, 1952–2004
Class Divisions in American Politics
Given the variations in inequality and party differences over time, we should expect to see greater class divisions prior to and after the 1950s–1970s. To assess this, we need individual-level income and voting data covering a long time span. There are two data sources for such an analysis: early (1930s–1940s) Gallup Polls and the American National Election Studies (ANES) Cumulative File, which has been conducted since 1948. Although these datasets differ over time, both were collected by reputable organizations and allow us to make a rough assessment of long-term patterns.
In Gallup polls conducted in 1936 and 1940 respondents were not asked about their income, but interviewers classified people—based on their housing, possession of a telephone, car ownership, and the like—into five categories of general affluence: “average plus,” “average,” “poor plus,” “poor,” and “on relief” (Ladd and Hadley 1978, 53).4
Of the respondents Gallup classified in 1936, 35.9% were in the category of “average plus,” 27.6% in the “average” category, and 36.5% in the “poor plus,” “poor,” or “on relief” category. In the 1940 poll, Gallup added a “wealthy” category. They classified 43.7% of the 1940 respondents in the categories of “wealthy,” “average plus,” and “average”; 19.2% as “poor plus,” and 36.9% as “poor” or “on relief.” For 1940, if the two categories of wealthy and average plus are combined, they constitute only 13.4% of respondents. This percentage is relatively small, so the political division between the most affluent and the poorest appears much greater. I chose to contrast the larger groupings. Regardless, the differences in the 1930s and the 1940s were much greater than in the 1950s and 1960s. I do not know the specific instructions that interviewers were given in classifying respondents. The distribution of the Gallup SES classification roughly corresponds to the measures employed in the ANES cumulative file.
The ANES Cumulative File presents income using five income percentile categories to classify respondents. The percentile groupings are 0–16, 17–34, 35–62, 63–95, and 95–100. Those in a particular percentile grouping may make more or less in absolute dollars over time, but our concern is their relative economic situation. With that in mind, respondents in the bottom two categories are coded together as lower income, and those in the top two categories are coded together as the highest-income households. The extent of class division is then measured by determining the percentage of the lowest economic category who voted Democratic5
The 1932 presidential results are self-reports from the October 1936 Gallup Poll and therefore should be interpreted with some caution. Not only are there problems of recall, but there is also the fact that individuals may have experienced considerable economic change from 1932 to 1936 such that their 1936 situation did not reflect their 1932 situation, making the cross-tabulation of their 1936 economic situation with the recall of their 1932 vote problematic. With those cautions in mind, the results are still of crude value to indicate the divisions that prevailed in the 1930s relative to later time periods. For readers who are surprised that class divisions were not greater in 1932, the results indicate that every economic group supported Roosevelt—even the most affluent—which might mask the extent of class division in the Great Depression era.
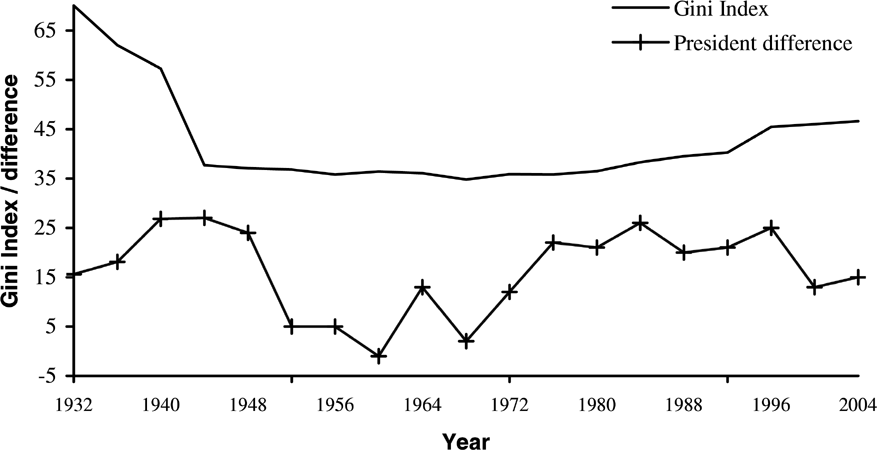
To assess the long-term relationship between income and voting behavior, Figure 4 presents the Gini index (multiplied by 100 to make it comparable to percentages) and the difference between the top and bottom third in voting for the Democratic presidential candidate since 1932. The pattern for 1932 through 1968 roughly squares with conventional wisdom. During the early years of this time span, inequality was high, and so were class divisions. Throughout the 1950s and the 1960s, inequality declines and class divisions also decline relative to the levels that prevailed in the 1930s and the 1940s. After 1970, the divisions increase to the levels that existed in the 1940s, but they declined somewhat in 2000 and 2004.

Inequality in the Distribution of Income, and Class Political Divisions, 1932 to 2004
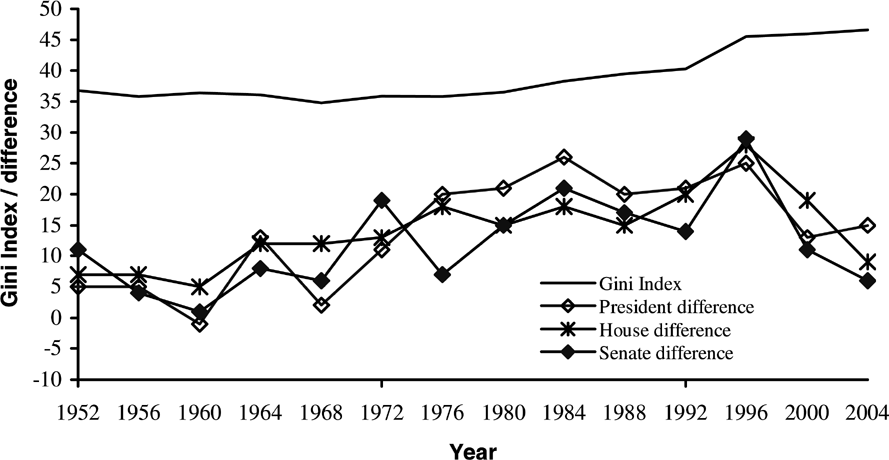
The dominant argument about class divisions has focused on the post-World War II era. Figure 5 presents ANES data focusing only on those years and including differences for Senate and House elections. Here the post-World War II pattern becomes clearer: as inequality increased after 1970, class divisions steadily increased in voting for all offices—until the 2004 elections.

Inequality and Class Political Divisions, 1952 to 2004
The Intervening Role of Short-Term Forces
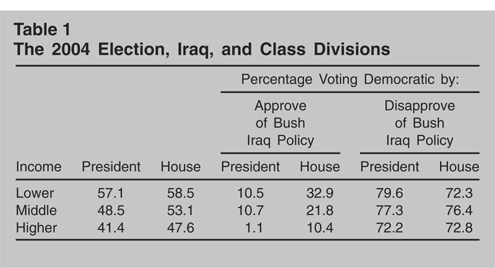
The decline in class divisions in 2000 and 2004 is somewhat puzzling, with inequality continuing to increase and party polarization persisting and growing. As often happens in politics, short-term factors matter, and they are the likely source of this decline. Much analysis is needed to understand these two elections, but two factors are especially important. In 2000 a significant factor may have been that most voters did not recognize just how conservative George W. Bush would be. In 2004 it is clear that voting choices were tied closely to reactions to the Iraq War. The issue divided the electorate strongly and that division almost overwhelmed other sources of political division. As Table 1 indicates, the primary source of division in presidential and House voting was tied to attitudes toward the Iraq War. Approval and disapproval of the war created splits within income groups of almost 70 percentage points. Among lower-income supporters of the war, support for John Kerry was only 11%. Among higher-income opponents of the war, support for Kerry was 72%. There was still an income gap in House and presidential voting, but it was relatively small in comparison to the last two decades. The same kind of split occurred in 1998 over the impeachment of Bill Clinton, the last intervening issue to reduce class divisions.6
The intensity of opinion about the Clinton impeachment was so strong that it dominated voting in 1998 irrespective of class (Stonecash 2000, 119–120). Those who supported impeachment voted strongly Republican across class groupings and those who opposed it voted strongly Democratic across class groupings. The result was that class divisions were much less politically significant in 1998 than they had been in previous years.
The 2004 Election, Iraq, and Class Divisions

The 2006 Elections and the Future
The Iraq War will someday be over and the polarizing President George W. Bush (Jacobson 2006) will be in retirement.After these short-term factors fade from the scene, presuming no other equally powerful short-term factors arise, the more enduring and fundamental divisions revolving around class are likely again to become more salient. This is especially so because inequality and party differences are continuing to increase. However, given the continuing prominence of the Iraq War and the fact that Bush will still be in the White House, it is unlikely that class issues will be central to the 2006 elections. Republicans are also acutely aware that the Iraq War is hurting them politically, and they are likely to be careful about taking actions that would add class divisions to the current problems they face. Democrats know the primary weaknesses of Republicans are the Iraq War and George Bush, so even though they will argue that Bush and Republicans have hurt the working class, their focus will be on the most obvious Republican vulnerabilities.
Biography
Jeff Stonecash is Maxwell Professor at Syracuse University. He is the author of Class and Party in American Politics (2000), Diverging Parties (2002), Parties Matter: Realignment and the Return of Partisanship (2006), and Split: Class and Cultural Divisions in American Politics (CQ Press, 2006).