Introduction
The Ni–W alloy substrates have attracted much attention because of excellent cube texture and mechanical and magnetic properties for YBCO-coated conductors [Reference Cantoni, Christen, Goyal, Heatherly, List, Ownby, Zehner, Christen and Rouleau1, Reference Bhattacharjee, Tsuji and Ray2, Reference Sarma, Eickemeyer, Mickel, Schultz and Holzapfel3]. The yield strength (σ0.2) of 170 MPa, recrystallization cube texture of 98%, and saturation magnetization (M s) equal to 27.5 emu/g were obtained in a commercial Ni–5 at.% W substrate [4], fabricated via Rolling Assisted Biaxially Textured Substrates (RABiTS) technique [Reference Norton, Goyal, Budai, Christen, Kroeger, Specht, He, Saffian, Paranthaman, Klabunde, Lee, Sales and List5]. Previous studies reported [Reference Zhou, Ghalsasi and Hanna6, Reference Eickemeyer, Huhne, Guth, Rodig, Gaitzsch, Freudenberger, Schultz and Holzapfel7, Reference Sarma, Eickemeyer, Schultz and Holzapfel8] that the increased W content has increased the σs while decreasing the Curie temperature (T C) and M s in Ni–W alloy substrates. Several Ni–W alloy substrates with suppressed ferromagnetism are reported by Eickemeyer et al. [Reference Eickemeyer, Huhne, Guth, Rodig, Gaitzsch, Freudenberger, Schultz and Holzapfel7, Reference Hühne, Eickemeyer, Sarma, Güth, Thersleff, Freudenberger, de Haas, Weigand, Durrel, Schultz and Holzapfel9, Reference Gaitzsch, Hänisch, Hühne, Rodig, Freudenberger, Holzapfel and Schultz10]. However, it was found difficult to obtain a strong recrystallization cube texture in Ni–W (>5 at.% W) substrates [Reference Eickemeyer, Selbmann, Opitz, de Boer, Holzapfel, Schultz and Miller11] because of low stacking fault energy caused by higher tungsten content.
The composite substrate [Reference Zhao, Suo, Liu, He, Zhang and Zhou12, Reference Sarma, Eickemeyer, Schultz and Holzapfel13, Reference Goyal14, Reference Yoshino, Yamazaki and Thanh15, Reference Sarma, de Boer, Eickemeyer and Holzapfel16, Reference Ma, Gao, Qi, Zhang, Wang, Zhang and Wang17, Reference Waltz, Retraint, Roos and Olier18, Reference Sarma, Eickemeyer, Singh, Schultz and Holzapfel19, Reference Zumelzu, Rull and Boettcher20] with sandwich-like structure has been proposed [Reference Gao, Suo, Zhao, Grivel, Cheng, Ma, Wang, Gao, Wang, Liu, Wang and Kou21, Reference Zhao, Suo, Liu, He, Zhang, Ma and Zhou22, Reference Suo, Ma, Gao, Meng, Wang, Liu, Zhao and Grivel23] as the solution to this problem. In the sandwich-like composite substrates, the external layers are low W content alloy, to obtain a sharp surface cube texture, whereas higher W content alloy in the core can reduce the substrate’s magnetization and improve its mechanical strength. In general, there are three kinds of routes to form composite substrates, i.e., (i) powder in tube method (PIT) [Reference Sarma, Eickemeyer, Schultz and Holzapfel13, Reference Sarma, Eickemeyer, Singh, Schultz and Holzapfel19], (ii) co-rolling method [Reference Zumelzu, Rull and Boettcher20], and (iii) composite ingot method [Reference Gao, Suo, Zhao, Grivel, Cheng, Ma, Wang, Gao, Wang, Liu, Wang and Kou21, Reference Zhao, Suo, Liu, He, Zhang, Ma and Zhou22]. However, texture in the surface of composite substrates and binding force between inner and external layers are very sensitive to the temperature of deformation involved during PIT and co-rolling methods [Reference Shi, Zhou and Liang24]. Suo et al. [Reference Suo, Ma, Gao, Meng, Wang, Liu, Zhao and Grivel23, Reference Suo, Zhao, Liu, Ye, Zhu, He, Ma, Ji and Zhou25, Reference Suo, Zhao, Liu, Ma, He, Zhang and Zhou26, Reference Suo, Zhao, Liu, Zhang, He, Ma, Ji and Zhou27] have investigated Ni–W composite substrates by “composite ingot” method prepared by Spark Plasma Sintering (SPS), rolling, and annealing processes. Even though the texture in the surface of composite substrates and the binding force between inner and external layers were enhanced by the composite ingot method effectively [Reference Gao, Suo, Gao, Zhao, Ma, Liu, Wang and Qiu28], the denseness and the distribution of Ni and W elements in Ni–W composite ingot were caused by using SPS technique.
In this study, the Ni–5 at.% W/Ni–9.3 at.% W/Ni–5 at.% W composite ingot was fabricated via a novel method, called solid-clad-by-liquid method. A more homogeneous elemental distribution of Ni and W elements is expected to be obtained in the composite ingot, as compared with the SPS method. Three deformation routes (cold rolling, cold rolling with intermediate annealing, and cold rolling combined with warm rolling) were investigated in short Ni–5 at.% W/Ni–9.3 at.% W/Ni–5 at.% W composite substrates. For comparison with furnace-cooled annealing, the air-cooled annealing in short Ni–5 at.% W/Ni–9.3 at.% W/Ni–5 at.% W composite substrate was investigated to optimize the parameters of the dynamic continuous annealing for the long Ni–5 at.% W/Ni–9.3 at.% W/Ni–5 at.% W composite substrates. A 10-m long by 10-mm wide by 80-μm thick Ni–5 at.% W/Ni–9.3 at.% W/Ni–5 at.% W composite substrate with excellent cube texture was successfully fabricated via warm rolling deformation at 550 °C and two-step dynamic continuous annealing procedure (750 °C for 1 h followed by 1200 °C for 1 h). The mechanical and magnetic properties of the 10-m long by 10-mm wide by 80-μm thick Ni–5 at.% W/Ni–9.3 at.% W/Ni–5 at.% W composite substrate were investigated.
Results and discussion
Short Ni–5 at.% W/Ni–9.3 at.% W/Ni–5 at.% W composite substrate
Composite Ni–5 at.% W/Ni–9.3 at.% W/Ni–5 at.% W ingot analysis
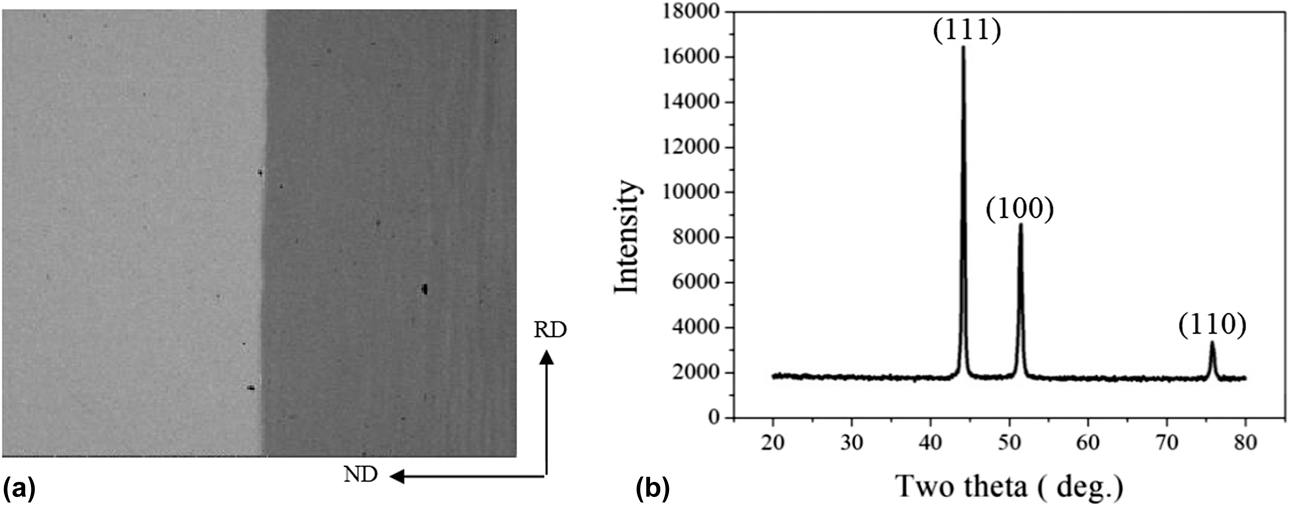
The back scattering electron (BSE) images for the cross-section of Ni–5 at.% W/Ni–9.3 at.% W/Ni–5 at.% W composite ingots are shown in Fig. 1(a). Compared with the Ni–W composite substrates prepared by SPS method [Reference Meng29], much less W-rich region (white spots) or Ni-rich region (deep gray area) can be seen in the composite ingot produced by the solid-clad-by-liquid method, indicating homogeneous elemental distribution of Ni and W was obtained by solid-clad-by-liquid method. It’s probably due to physical segregation happened during SPS method [Reference Meng29, Reference Ganesh Narayanan30], which doesn’t exist in solid-clad-by-liquid method. The X-ray diffraction (XRD) pattern of hot rolled Ni–5 at.% W/Ni–9.3 at.% W/Ni–5 at.% W composite substrate is shown in Fig. 1(b). The peaks of (111), (100), and (110) for Ni were displayed, while no evident aggregated W or Ni detected.
(a) BSE image of the cross-section of Ni–5 at.% W/Ni–9.3 at.% W/Ni–5 at.% W composite ingot and (b) XRD pattern of the Ni–5 at.% W/Ni–9.3 at.% W/Ni–5 at.% W composite substrates after hot rolling at 1150 °C.

Texture analysis after 1st procedure
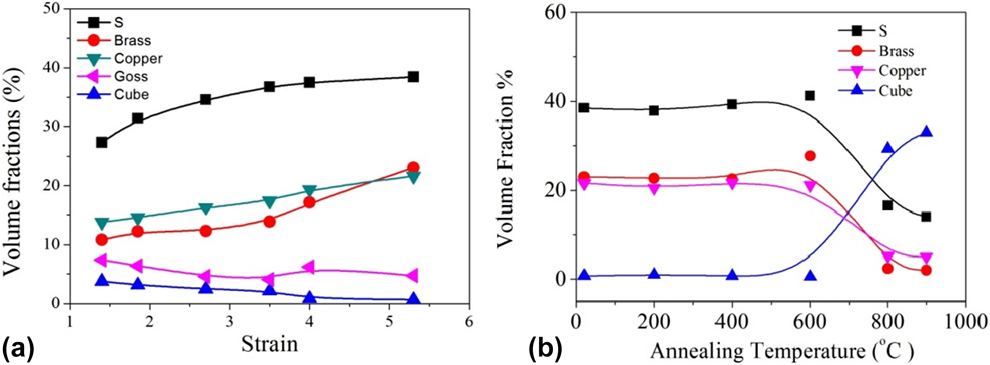
The volume fractions for s {123}〈634〉, brass {011}〈211〉, copper {112}〈111〉, goss {110}〈001〉, and cube {001}〈100〉 orientations in Ni–5 at.% W/Ni–9.3 at.% W/Ni–5 at.% W substrate with various strains (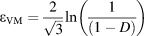 ${\varepsilon _{{\rm{VM}}}} = {2 \over {\sqrt 3 }}\ln \left( {{1 \over {\left( {1 - D} \right)}}} \right)$,
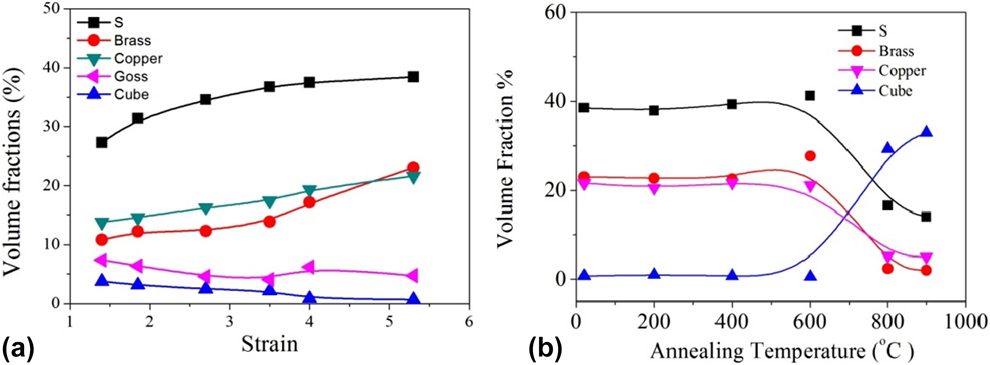
 $D = {{T - {T_0}} \over {{T_0}}}$, while T and T 0 means the thickness of substrates and the thickness of original ingot, respectively [Reference Tian31]) during 1st procedure are shown in Fig. 2(a). The fractions of s {123}〈634〉, brass {011}〈211〉, and copper {112}〈111〉 orientations were increased up to 38%, 23.18%, and 21%, respectively, from 0.4 strain (i.e., 7.5% deformation) to 5.3 strain (i.e., 99% deformation). After 3.5 strain, the volume fractions of s {123}〈634〉 and copper {112}〈111〉 orientations showed a slow increase, compared with brass {011}〈211〉 orientation, which considerably increased. At 5.3 strain, the volume fraction of copper {112}〈111〉 orientation was even overtaken by that of brass {011}〈211〉 orientation, due to the slow growth of s {123}〈634〉 and copper {112}〈111〉 orientation [Reference Sarma, Eickemeyer, Schultz and Holzapfel8]. The increasing fraction of brass {011}〈211〉 orientation by suppressing s {123}〈634〉 and copper {112}〈111〉 orientations may be attributed toward the low stacking fault energy of Ni–W alloy [Reference Sarma, Eickemeyer, Schultz and Holzapfel8, Reference Cui, Suo, Wang, Grivel, Ma, Li, Ji, Kausar, Liu and Wang32]. The volume fraction of goss {110}〈001〉 orientation remained stable as compared with other rolling orientations, whereas that of cube {001}〈100〉 orientation was slightly decreased during cold rolling. The volume fraction for total rolling orientation components [Reference Maurice and Driver33] (s {123}〈634〉, brass {011}〈211〉, copper {112}〈111〉, goss {110}〈001〉, and cube {001}〈100〉) was increased up to 80% at 5.3 strain. The volume fractions of s {123}〈634〉, brass {011}〈211〉, copper {112}〈111〉, and cube {001}〈100〉 orientations in Ni–5 at.% W/Ni–9.3 at.% W/Ni–5 at.% W substrate after annealing at 200, 400, 600, 800, and 900 °C for 1 h are shown in Fig. 2(b). Up to 600 °C all the textures remained constant. However, after annealing at 600 °C the fraction of cube {001}〈100〉 orientation was the highest, indicating the beginning of recrystallization process [Reference Wakeel, Huang, Wu, Mishin and Huang34] in Ni–5 at.% W/Ni–9.3 at.% W/Ni–5 at.% W substrate. The cube texture of 30%, similar fraction reported in Ni–7 at.% W substrate [Reference Liang, Tian, Suo, Wang, Meng, Ma and Liu35], was attained in the composite substrate annealed at 900 °C for 1 h.
Volume fractions of s, copper, brass, and goss, and cube orientations in the Ni–5 at.% W/Ni–9.3 at.% W/Ni–5 at.% W substrate (a) during 1st procedure and (b) with 5.3 strain after annealing at various temperatures for 1 h.
Texture analysis after 2nd procedure
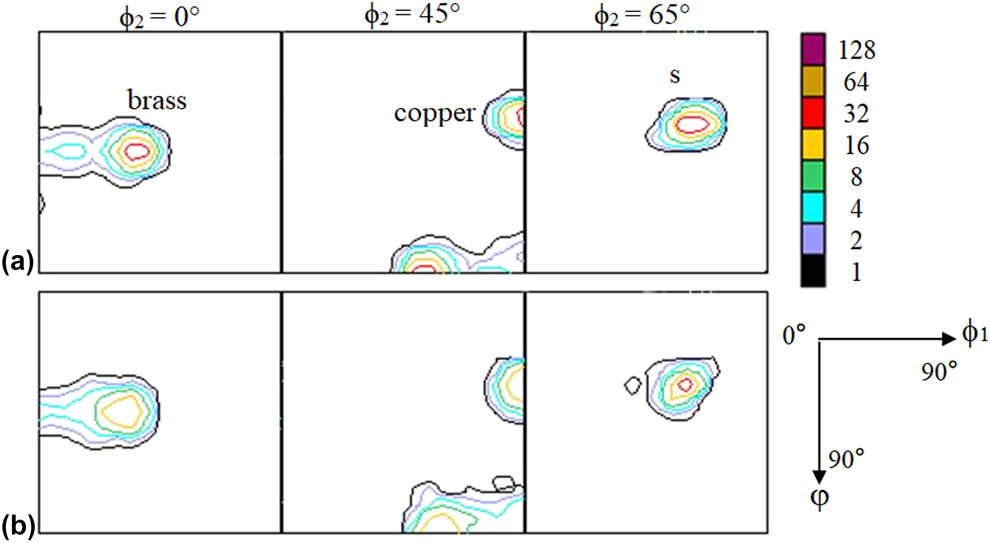
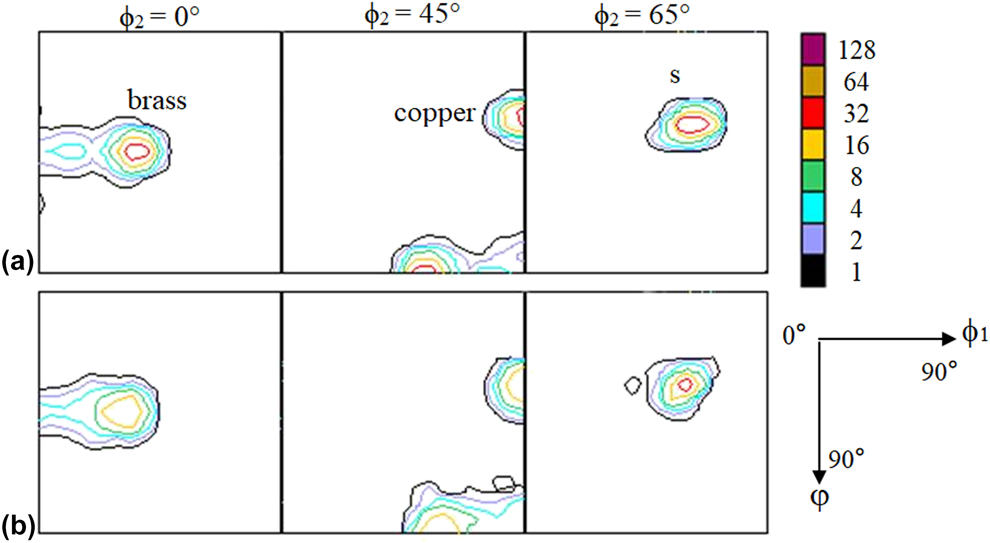
Based on annealing temperature, the recovery processes were categorized into three classes [Reference Wakeel, Huang, Wu, Mishin and Huang34]. The first-level recovery process (0.1 < T/T m < 0.3, where T and T m represent annealing temperature and melting point, respectively) consists of the shift between the point defects and vacancies. The second-level recovery process (0.3 < T/T m < 0.5) consists of the movement of vacancies and dislocations. The third-level recovery process (T/T m > 0.5) consists of the movement of vacancies and dislocations and the transformation of dislocation configuration. With increasing the annealing temperature from 400 to 600 °C, the fractions of s, brass, and copper orientations increased, maybe due to the dislocation configuration changed at 600 °C (the third-level recovery process). Thus, the temperature around 550 °C was specified as the intermediate annealing temperature (second recovery process) for Ni–5 at.% W/Ni–9.3 at.% W/Ni–5 at.% W. Stress was expected to be released because of restricted dislocations during the second recovery process. The orientation density functions (ODF) maps (ϕ2 = 0°, 45°, 65°) for Ni–5 at.% W/Ni–9.3 at.% W/Ni–5 at.% W substrate (with 0.24 mm thickness) before and after intermediate annealing are displayed in Fig. 3. The intermediate annealing at 550 °C was found slightly effective for the development of brass, copper, and s orientations as revealed by the intensities (35.3°, 45°, and 0°) (90°, 35.3°, and 45°), and (60°, 32°, and 65°) for brass, copper and s orientation, respectively. The microhardnesses of Ni–9.3 at.% W layer in 80 μm thick Ni–5 at.% W/Ni–9.3 at.% W/Ni–5 at.% W substrate after 1st and 2nd procedures are 495 HV and 459 HV, respectively. It can be seen that smaller microhardness on the Ni–9.3 at.% W layer of the composite substrates after 2nd procedure than that after 1st procedure indicates the effective stress release caused by the intermediate annealing at 550 °C.
ODF maps (ϕ2 = 0°, 45°, and 65°) of 0.24 mm thick Ni–5 at.% W/Ni–9.3 at.% W/Ni–5 at.% W substrates (a) before and (b) after the intermediate annealing during the 2nd procedure.
Texture analysis after 3rd procedure
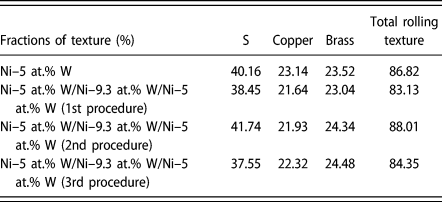
Since the lowest microhardness of 459 HV on the Ni–9.3 at.% W layer of the composite substrates was obtained by the 2nd procedure and a sight higher microhardness of 466 HV obtained by the 3rd procedure, both 2nd and 3rd procedures attained lower microhardness than that by the 1st procedure (495 HV). Fractions of s {123}〈634〉, copper {112}〈111〉, and brass {011}〈211〉 orientations in Ni–5 at.% W substrate after cold rolling procedure and in Ni–5 at.% W/Ni–9.3 at.% W/Ni–5 at.% W composite substrate after the 1st, 2nd, and 3rd procedures are summarized in Table I. The fractions of copper {112}〈111〉 orientation in Ni–5 at.% W/Ni–9.3 at.% W/Ni–5 at.% W substrate (1st, 2nd, and 3rd procedures) were lower than those in Ni–5 at.% W substrate. The lowest fraction of total rolling texture existed in Ni–5 at.% W/Ni–9.3 at.% W/Ni–5 at.% W substrate (1st procedure) should be related to the absence of stress release. Higher fractions of brass {011}〈211〉 and copper {112}〈111〉 orientations, responsible for the recrystallized cube {001}〈100〉 orientation [Reference Lee36], were found in Ni–5 at.% W/Ni–9.3 at.% W/Ni–5 at.% W substrate (3rd procedure) than that in 2nd procedure, whereas the s {123}〈634〉 orientation fraction prominently decreased by the 3rd procedure. This may be due to different texture forming mechanism between 3rd and 2nd procedures. Unlike the stress release during intermediate annealing, the dynamic recovery process [Reference Xu37] during warm rolling consists of elimination and formation of dislocations simultaneously.
Volume fractions of rolling texture in the prepared Ni–5 at.% W and in short Ni–5 at.% W/Ni–9.3 at.% W/Ni–5 at.% W composite substrates (1st, 2nd, and 3rd procedures).

Formation of cube texture in Ni–5 at.% W/Ni–9.3 at.% W/Ni–5 at.% W substrate
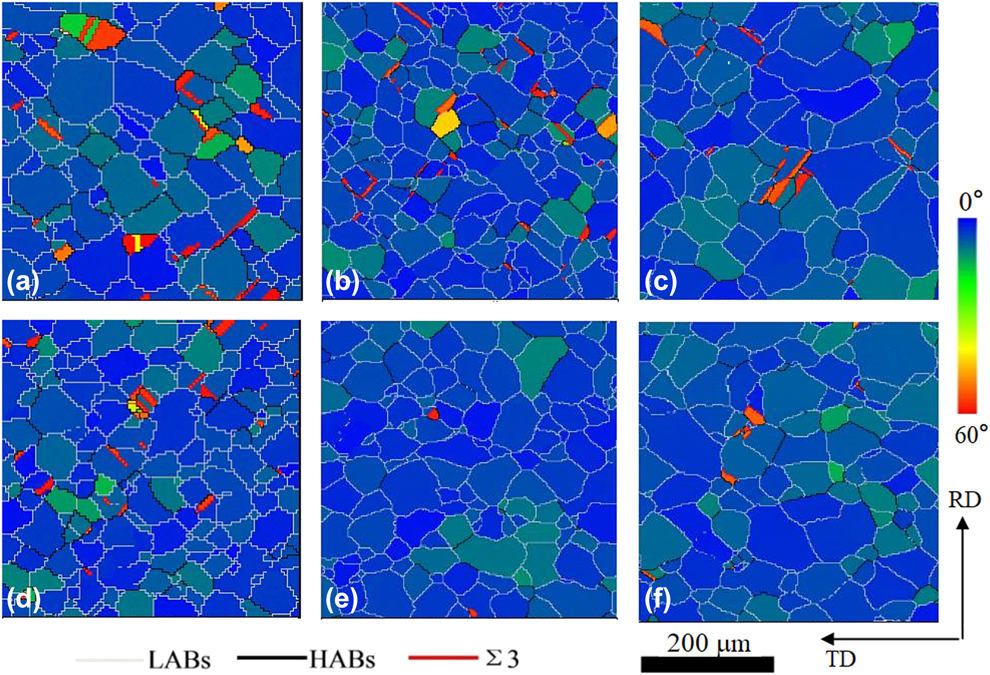
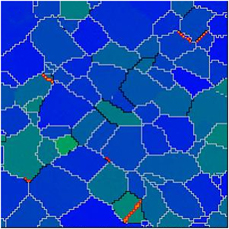
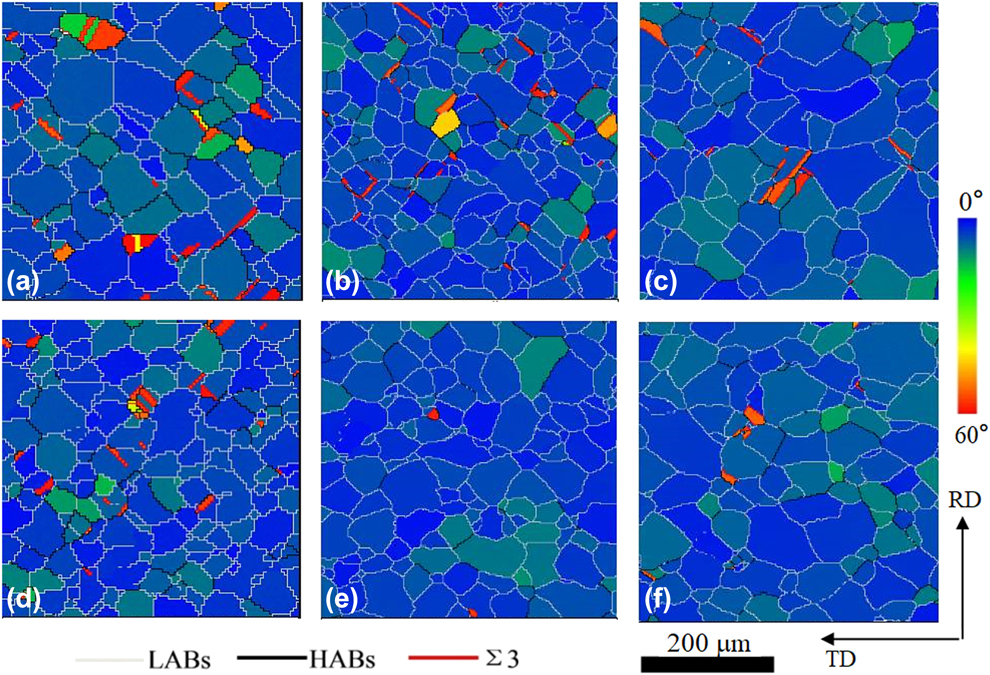
The electron back scattering diffraction (EBSD) maps of the 80-μm thick Ni–5 at.% W/Ni–9.3 at.% W/Ni–5 at.% W substrate (1st, 2nd, and 3rd procedures) after furnace-cooled annealing at 1100 and 1200 °C for 1 h are shown in Fig. 4. The corresponding fractions of cube texture, low-angle grain boundaries (LGBs), and Ʃ3 boundaries are listed in Table SI. Improved fractions of cube texture, LGBs, and Ʃ3 boundaries were observed at 1200 °C as compared with 1100 °C describing the effectiveness of higher annealing temperature on forming the recrystallized cube texture in the Ni–5 at.% W/Ni–9.3 at.% W/Ni–5 at.% W composite substrates, similar with Ref. Reference Specht, Goyal, Lee, List, Kroeger, Paranthaman, Williams and Christen38. Higher fraction of cube texture existed in the recrystallized Ni–5 at.% W/Ni–9.3 at.% W/Ni–5 at.% W composite substrates after 2nd or 3rd procedure as compared with that after the 1st procedure, while the most improved cube texture obtained by that after the 2nd procedure. This can’t be explained by the copper texture volume, which should be responsible for the recrystallized cube texture [Reference Lee36] since higher copper texture existed by 3rd procedure (Table I). Interestingly, it was found that the composite substrate with higher hardness on the Ni–9.3 at.% W layer obtained higher Ʃ3 boundary fraction and lower cube texture fraction during recrystallization process. Thus, the hardness of the Ni–9.3 at.% W layer is an indication of the possible reason—it suggests that it leads to higher Ʃ3 boundary fraction and lower cube texture fraction during forming recrystallized cube texture in the Ni–5 at.% W/Ni–9.3 at.% W/Ni–5 at.% W composite substrates. This may be due to the higher hardness, indicating [Reference Graca, Colaco, Carvalho and Vilar39] a higher internal energy in the composite substrates before annealing, which increased the fraction of random orientation during recrystallization of the composite substrates.
EBSD maps of short Ni–5 at.% W/Ni–9.3 at.% W/Ni–5 at.% W composite substrates after furnace-cooled annealing at (a) 1100 °C for 1 h (1st procedure), (b) 1100 °C for 1 h (2nd procedure), (c) 1100 °C for 1 h (3rd procedure), (d) 1200 °C for 1 h (1st procedure), (e) 1200 °C for 1 h (2nd procedure), and (f) 1200 °C for 1 h (3rd procedure).
Long Ni–5 at.% W/Ni–9.3 at.% W/Ni–5 at.% W composite substrate
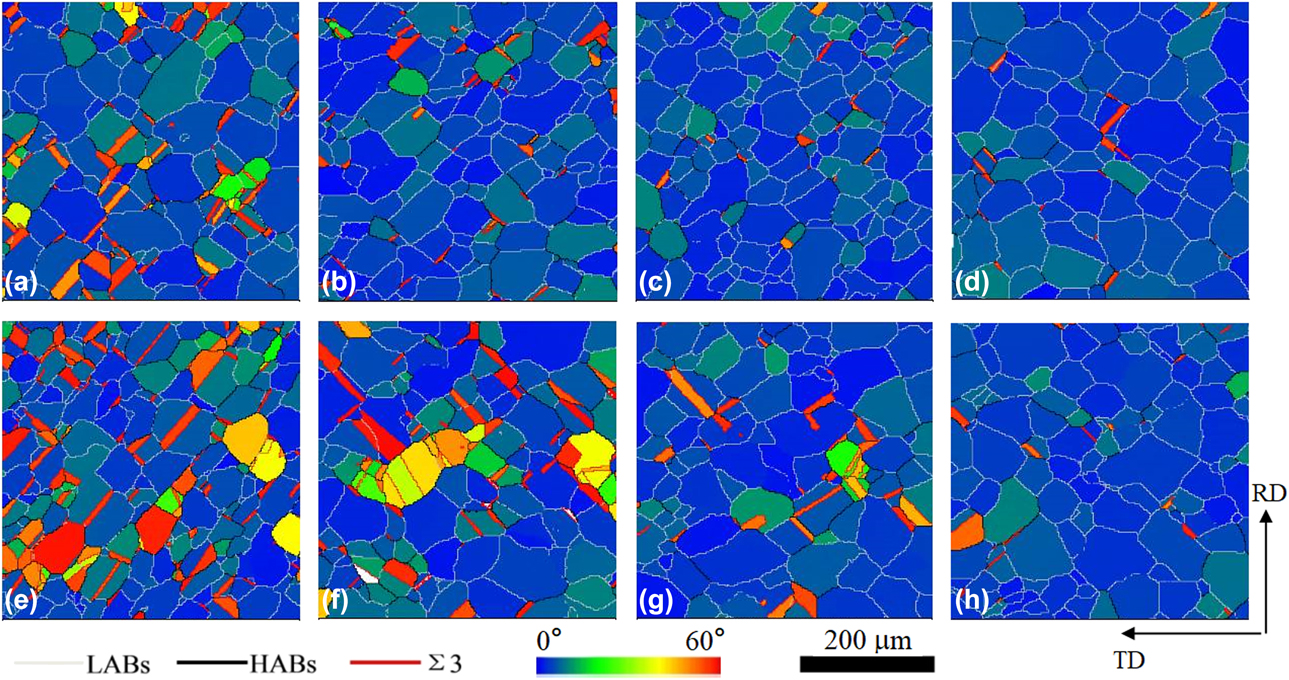
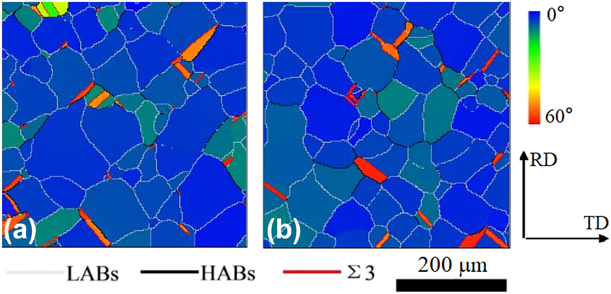
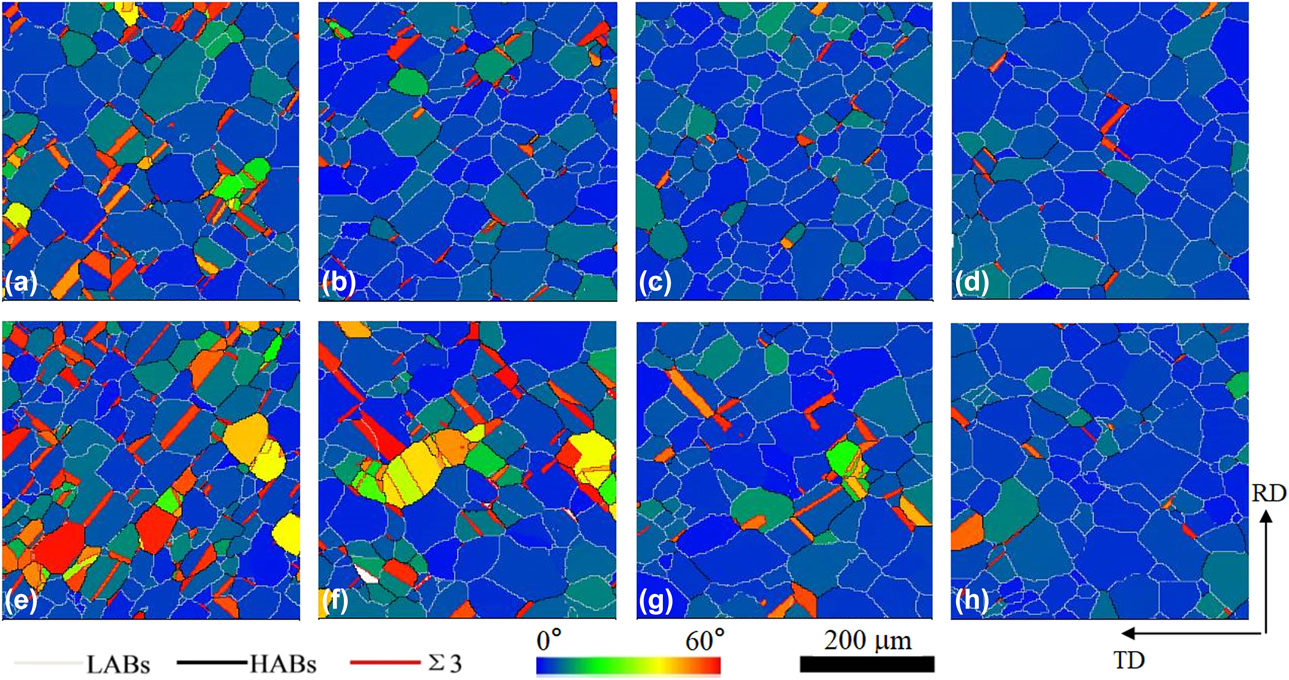
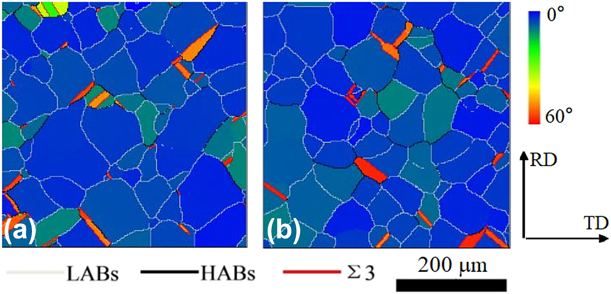
Because of the similar mechanism between dynamic continuous annealing [Reference Li40] and air-cooled annealing, the latter one was applied in short composite substrates to optimize the annealing time and temperature of dynamic continuous annealing in long composite substrates. The EBSD maps of the short Ni–5 at.% W/Ni–9.3 at.% W/Ni–5 at.% W composite substrate (2nd and 3rd procedures) after air-cooled annealing at 1100, 1150, and 1200 °C for 1 h, and at 750 °C for 1 h and 1200 °C for 1 h (two-step annealing process) are shown in Fig. 5. The corresponding fractions of cube texture, LGBs, and Ʃ3 boundaries are summarized in Table SII. The fractions of cube texture and LGBs in the composite substrates (2nd and 3rd procedures) were increased to 97.0% and 90.8%, respectively, with increasing the annealing temperature from 1100 to 1200 °C, whereas more improved cube texture existed in the composite substrate deformed by the 2nd procedure. This is in agreement with the results above in the furnace-cooled annealed substrates. Hence, it can be concluded that the higher annealing temperature and 2nd procedure are very effective for improving cube texture in the composite substrates via both furnace-cooled and air-cooled annealing processes. However, the fractions of cube texture, LGBs, and Ʃ3 boundary during air-cooled annealing decreased dramatically as compared with that during furnace-cooled annealing. It should be mentioned that the cooling rate during furnace-cooled and air-cooled annealing processes was around 5 h and 1 h, respectively. Thus, it is reasonable to say that a less recovery process existed during air-cooled annealing [Reference Bracke, Verbeken and Kestens41], which should be responsible for the lower cube texture. It was previously reported that two-step annealing process at ∼700 and ∼1100 °C attained stronger recrystallized cube texture in Ni–W and in Ni–W/Ni–Cr composite substrates [Reference Sarma, Eickemeyer, Schultz and Holzapfel8, Reference Sarma, Eickemeyer, Singh, Schultz and Holzapfel19]. After the two-step annealing process, the fractions of cube texture and LGBs in the recrystallized composite substrates (2nd and 3rd procedures) were successfully improved to 99.0% and 97.2%, respectively. Additionally, longer annealing time (2 h) and higher temperature (1250 °C) were also carried out to improve the recrystallized cube texture [Reference Sarma, Eickemeyer, Singh, Schultz and Holzapfel19] during air-cooled annealing in short composite substrate (3rd procedure). As shown in Fig. 6 and Table SIII, the longer annealing time and higher temperature improved the recrystallized cube texture to 94.6% and 97.2%, respectively, in short composite substrates (3rd procedure) during air-cooled annealing effectively, whereas no abnormal grain growth and secondary recrystallization happened. Even though higher annealing temperature (1250 °C) obtained similar strong cube texture as two-step air-cooled annealing, the fraction of Σ3 boundary was much higher than the latter one. Hence, the 3rd procedure and two-step air-cooled annealing (750 °C for 1 h and 1200 °C for 1 h) were chosen to optimize the deformation and dynamic continuous annealing parameters for long composite substrates.
EBSD maps of short Ni–5 at.% W/Ni–9.3 at.% W/Ni–5 at.% W composite substrates after air-cooled annealing at (a) 1100 °C for 1 h (2nd procedure), (b) 1150 °C for 1 h (2nd procedure), (c) 1200 °C for 1 h (2nd procedure), (d) 750 °C for 1 h followed by 1200 °C for 1 h (2nd procedure), (e) 1100 °C for 1 h (3rd procedure), (f) 1150 °C for 1 h (3rd procedure), (g) 1200 °C for 1 h (3rd procedure), and (h) 750 °C for 1 h followed by 1200 °C for 1 h (3rd procedure).
EBSD maps of short Ni–5 at.% W/Ni–9.3 at.% W/Ni–5 at.% W composite substrate (3rd procedure) after air-cooled annealing at (a) 1200 °C for 2 h and (b) 1250 °C for 1 h.
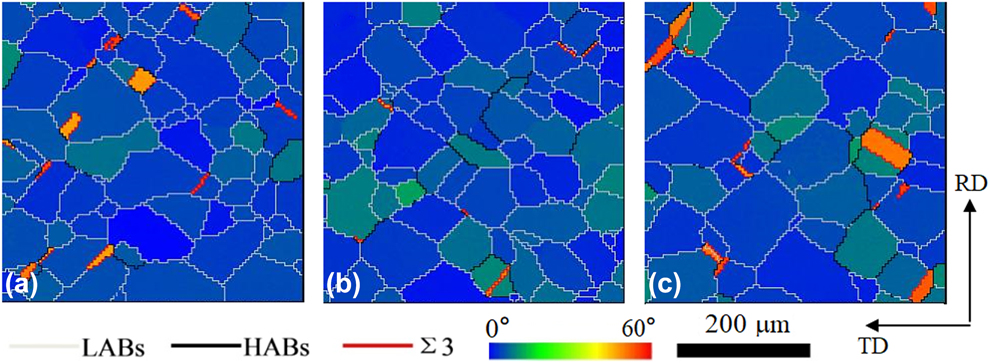
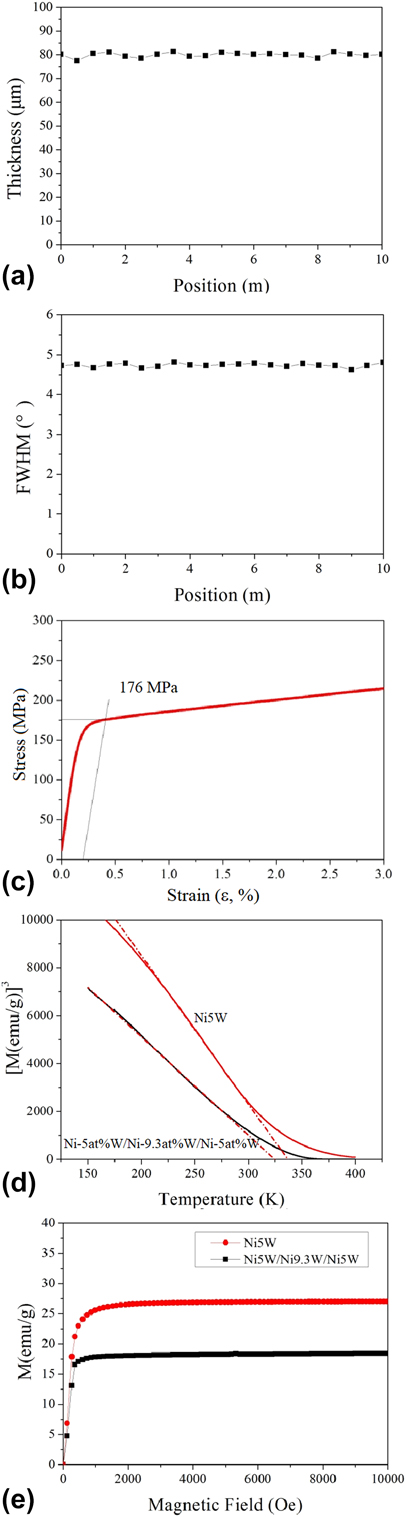
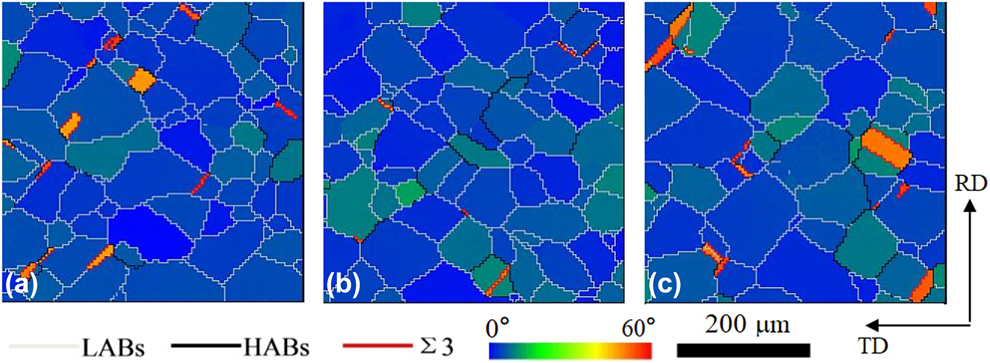
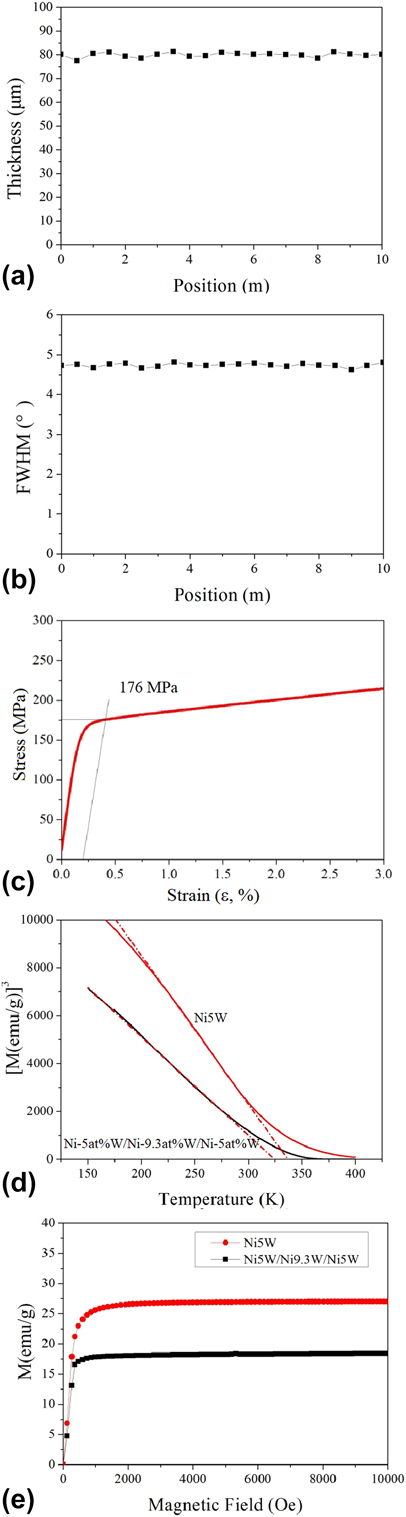
The EBSD maps of 10 m long Ni–5 at.% W/Ni–9.3 at.% W/Ni–5 at.% W composite substrates (3rd procedure, followed by two-step dynamic continuous annealing) at a position of 1, 5, and 10 m are shown in Figs. 7(a), 7(b), and 7(c), respectively. This deformation and treatment results in 97.6, 98.7, and 95.5% cube texture with less than 10° misorientation in the long composite substrates at a position of 1, 5, and 10 m. A great number of dislocations developed at the edge of two sides by the wire-electrode [Reference Peng, Song, Shen, Zheng, Zhou and Zhu42] should be responsible for the decreased cube texture in the long composite substrate at a position of 10 m. The thickness of 80 ± 2 μm and the average full width half maximum (FWHM) of around 4.7° were obtained for the 10 m long composite substrates, as shown in Figs. 8(a) and 8(b). The σ0.2 value of 176 MPa was determined by inducing 0.2% strain for the long composite substrates, as shown in Fig. 8(c). This value is higher than that of commercial Ni–5 at.% W alloy tape of 170 MPa [4]. The values of T C and M s, determined by inducing the lowest dM/dT value and by inducing dM/d (magnetic field) = 0, was about 324 K and 18 emu/g, respectively, as shown in Figs. 8(d) and 8(e). For comparison, the prepared Ni–5 at.% W show a T C value of 337 K and a M s value of 29 emu/g, indicating [Reference Ijaduola, Thompson, Goyal, Thieme and Marken43] decreases of 13 K and 11 emu/g for T C and M s caused by the Ni–9.3 at.% W layer.
EBSD maps of 10-m long Ni–5 at.% W/Ni–9.3 at.% W/Ni–5 at.% W composite substrates at a position of (a) 1 m (97.6% cube texture), (b) 5 m (98.7% cube texture), (c) 10 m and (95.5% cube texture).
(a) Thickness-position curve, (b) FWHM intensities–position curve, (c) strain–stress curve of 10 m long Ni–5 at.% W/Ni–9.3 at.% W/Ni–5 at.% W composite substrate, (d) Curie temperature transition curves, and (e) hysteresis loops of the prepared Ni–5 at.% W substrates and 10 m long Ni–5 at.% W/Ni–9.3 at.% W/Ni–5 at.% W composite substrates.
Conclusion
Composite Ni–5 at.% W/Ni–9.3 at.% W/Ni–5 at.% W ingots with more homogeneous elemental distribution of Ni and W elements were fabricated via a novel solid-clad-by-liquid method for forming short and long substrates. Three kinds of deformation were investigated on short Ni–5 at.% W/Ni–9.3 at.% W/Ni–5 at.% W composite substrates. The intermediate annealing and warm rolling process resulted in a stress release, related to the formation of recrystallized cube texture in short Ni–5 at.% W/Ni–9.3 at.% W/Ni–5 at.% W composite substrates. For comparison with furnace-cooled annealing, the air-cooled annealing in short Ni–5 at.% W/Ni–9.3 at.% W/Ni–5 at.% W composite substrate was investigated to optimize the parameters of the dynamic continuous annealing for the long Ni–5 at.% W/Ni–9.3 at.% W/Ni–5 at.% W composite substrates. Higher annealing temperature, longer annealing time, and using two-step annealing enhanced the recrystallized cube texture in the short Ni–5 at.% W/Ni–9.3 at.% W/Ni–5 at.% W composite substrate effectively. A 10 m long Ni–5 at.% W/Ni–9.3 at.% W/Ni–5 at.% W composite substrate with cube texture fraction of around 98% with less than 10° misorientation, σ0.2 value of 176 MPa, T C value of 324 K, and M s value of 18 emu/g was successfully fabricated from the Ni–5 at.% W/Ni–9.3 at.% W/Ni–5 at.% W composite ingot via 3rd procedure and two-step dynamic continuous annealing process. Thus, the solid-clad-by-liquid method, 3rd procedure, and the two-step dynamic continuous annealing can be considered as a suitable way to form commercial Ni–W composite substrates.
Experimental details
Sample preparation
Short Ni–5 at.% W/Ni–9.3 at.% W/Ni–5 at.% W composite substrates
A Ni–9.3 at.% W ingot was prepared by smelting in a vacuum induction melting furnace, starting with high-purity tungsten (99.99%) and electrolytic nickel (99.95%). The prepared ingot was hot forged into a rectangular shape of 10 × 30 × 50 mm3. After removing the oxide surface, it was placed in a graphite matrix. Then a liquid melt of Ni–5 at.% W alloy from high-purity 99.99% W and 99.95% electrolytic Ni was poured into a special matrix in an atmosphere of Ar + 4% H2 (solid clad by liquid method). The matrix fixed the inner layer with the ratio between the inner and outer space around 2:3, as shown in Fig. SI. The composite ingot was then annealed at 1150 °C for 24 h followed by hot rolling at 1150 °C for a 75% reduction in thickness. The reduction was 3–10% per pass, the ingot was annealed at 1150 °C for 10 min after each of three passes. After hot rolling, three kinds of deformation procedures were applied to the hot rolled substrates.
The first deformation procedure (1st procedure) was cold rolling to 80 µm thickness. Subsequently, the 80-µm thick composite substrates were annealed at 200, 400, 600, 800, and 900 °C for 1 h, respectively.
A second deformation procedure (2nd procedure) consisting of cold rolling to 0.24-mm thickness (97% total thickness reduction, i.e., 4.17 strain), intermediate annealing at 550 °C for 1 h in Ar + 4% H2 and then cold rolling to 80 µm thickness was studied.
A third deformation procedure (3rd procedure) consisting of warm rolling at 550 °C to 25% thickness reduction with about 5% per rolling pass, followed by cold rolling to 80 µm thickness. In the course of the 3rd procedure, the sample was annealed at 550 °C for 1 h before rolling, and heat treated at 550 °C for 10 min after each of two passes.
The recrystallization cube orientation textures (furnace-cooled annealing) were formed in the Ni–5 at.% W/Ni–9.3 at.% W/Ni–5 at.% W composite substrates deformed by the 1st, 2nd, and 3rd procedures at 1100 °C for 1 h, and 1200 °C for 1 h. A Ni–5 at.% W ingot was prepared from 99.99% W to 99.95% electrolytic Ni by the smelting technique, followed by cold rolling from 8 mm to 80 µm thickness.
Long Ni–5 at.% W/Ni–9.3 at.% W/Ni–5 at.% W composite substrates
As a quasi-dynamic continuous annealing in long composite substrates, the short composite substrates (2nd and 3rd procedures) were air-cooled annealed at 1100 °C, 1150 °C, and 1200 °C for 1 h, and at 750 °C for 1 h followed by 1200 °C for 1 h (two-step annealing), respectively. The short composite substrate (3rd procedure) was air-cooled annealed at 1200 °C for 2 h and 1250 °C for 1 h, respectively. As compared with furnace-cooled annealing, air-cooled annealing has rapid cooling rate because the tube containing samples was put in air after annealing.
Substrates of 10 m length by 10 mm width were fabricated from a Ni–5 at.% W/Ni–9.3 at.% W/Ni–5 at.% W ingot with initial dimensions of 9 × 100 × 20 mm3 by the 3rd procedure. A wire-electrode cutting machine (JW7S-DK7735, China) was used to remove cracked sections which occurred during the deformation procedure. The recrystallized cube texture was formed in a 10 m long Ni–5 at.% W/Ni–9.3 at.% W/Ni–5 at.% W composite substrate through an optimized deformation (3rd procedure) and two-step annealing procedure (750 °C for 1 h followed by 1200 °C for 1 h) via a vertical continuous annealing furnace (YB-XB) in Ar + 4% H2 atmosphere.
Analytical techniques
Short Ni–5 at.% W/Ni–9.3 at.% W/Ni–5 at.% W composite substrates
The microstructure of the composite ingot was characterized by scanning electron microscopy (SEM, Quantum Design, San Diego), equipped with BSE system. The XRD pattern of the composite Ni–5 at.% W/Ni–9.3 at.% W/Ni–5 at.% W ingot after hot rolling was characterized by XRD (Bruker D8, Germany).
The volumes of rolling texture components during cold rolling and annealing of the 1st procedure were calculated via ODF from XRD pole figures using the Textool software (India) (tolerance angle = 15°).
The textures of the 0.24 mm thick Ni–5 at.% W/Ni–9.3 at.% W/Ni–5 at.% W substrate before and after the intermediate annealing process during the 2nd procedure were characterized by ODF.
The volumes of the deformation texture components in the 80 µm thick composite substrates (deformed by 1st, 2nd, 3rd procedures) and the Ni–5 at.% W substrates were calculated by Textool software from pole figures obtained by XRD. The micro-hardness tests of the Ni–9.3 at.% W layer in the 80 µm thick composite substrates (deformed by 1st, 2nd, 3rd procedures) were carried out by means of a digital micro-hardness tester (HVS-1000, China) with 50 N loads and 10 s keeping time.
The textures of the short recrystallized composite substrates (deformed by 1st, 2nd, 3rd procedures) annealed at 1100 °C for 1 h, and 1200 °C for 1 h (furnace-cooled annealing) was characterized by EBSD with 600 × 400 μm2 regions.
Long Ni–5 at.% W/Ni–9.3 at.% W/Ni–5 at.% W composite tapes
The texture of the long recrystallized composite substrate at a position of 1, 5, and 10 m was characterized by EBSD. The thicknesses of the long composite tape were measured with a micrometer caliper (LINKS 0–25, China). The FWHM of the out-of-plane orientation in long recrystallized composite tapes was determined from ω-scans of (100) parallel to the rolling direction by XRD. The yield strength of the long recrystallized composite tapes was measured with a Zwick/Roell Z050 (Germany) testing machine with 4 cm extensometer and 5 mm/min loading rate along [100] direction at room temperature. The magnetization behavior of the recrystallized Ni–5 at.% W/Ni–9.3 at.% W/Ni–5 at.% W composite and Ni–5 at.% W substrates were measured by a Physical Property Measurement System (PPMS-14LH, Quantum Design, San Diego) at H = 3500 Oe, and T = 77 K.
Supplementary material
To view supplementary material for this article, please visit https://doi.org/10.1557/jmr.2019.259.
Acknowledgments
This work is financially supported by the National Natural Science Foundation of China (51571002), the General Program of Science and Technology Development Project of Beijing Municipal Education Commission of China (KM201810005010), the Beijing Municipal Natural Science Foundation (2172008), by the Evaluation Research for the Performance of MgB2 Tapes (GH-201809CG005), and 211 Program of Beijing City and Beijing University of Technology, by the Program of Top Disciplines Construction in Beijing (PXM2019_014204_500031).