1. Introduction
Most stellar objects from stars to galaxies are made of hot gas in an ionized state. The magnetohydrodynamic (MHD) equations give the simplest description of the dynamics involved (Goldstein, Roberts & Matthaeus Reference Goldstein, Roberts and Matthaeus1995; Battaner Reference Battaner1996; Biskamp Reference Biskamp2003; Verma Reference Verma2004; McKee & Ostriker Reference McKee and Ostriker2007; Bruno & Carbone Reference Bruno and Carbone2013; Galtier Reference Galtier2016) and give a general framework relevant for dynamo and many plasma phenomena (Davidson Reference Davidson2002; Brandenburg & Subramanian Reference Brandenburg and Subramanian2005; Landau et al. Reference Landau, Bell, Kearsley, Pitaevskii, Lifshitz and Sykes2013). At large Reynolds numbers (small dissipation parameters) the MHD turbulent dynamics becomes turbulent sharing many features with hydrodynamic turbulence. The key idea is the existence of cascade processes, meaning that inviscid invariants are transferred across scales so that they are efficiently dissipated at the smallest scales (Monin & Yaglom Reference Monin and Yaglom1975; Frisch Reference Frisch1995; Alexakis & Biferale Reference Alexakis and Biferale2018). This idea sketched by Richardson was at the basis of the phenomenological statistical theory by Kolmogorov (Reference Kolmogorov1941) and Kraichnan (Reference Kraichnan1971) and is the cornerstone of our understanding of turbulence. Different theories have been proposed that attempt to describe quantitatively the behaviour of MHD turbulence (Iroshnikov Reference Iroshnikov1964; Kraichnan Reference Kraichnan1965). Yet, MHD turbulence displays an even more complex behaviour than the hydrodynamic one with diverse regimes and recently new theories have been proposed (Goldreich & Sridhar Reference Goldreich and Sridhar1995; Boldyrev Reference Boldyrev2006; Beresnyak Reference Beresnyak2011). A variety of methods have been applied in MHD to test and constrain existing theories. Two-point correlation functions have led to some constraints on third-order structure functions (Politano & Pouquet Reference Politano and Pouquet1998; Galtier Reference Galtier2009). Scale-by-scale analysis in Fourier space that has been extensively used in hydrodynamics (Chen, Chen & Eyink Reference Chen, Chen and Eyink2003; Verma Reference Verma2004; Alexakis, Mininni & Pouquet Reference Alexakis, Mininni and Pouquet2007; Domaradzki, Teaca & Carati Reference Domaradzki, Teaca and Carati2009; Teaca, Carati & Andrzej Domaradzki Reference Teaca, Carati and Andrzej Domaradzki2011; Verma Reference Verma2019) has been applied with some success in MHD as well (Dar, Verma & Eswaran Reference Dar, Verma and Eswaran2001; Alexakis, Mininni & Pouquet Reference Alexakis, Mininni and Pouquet2005; Mininni, Alexakis & Pouquet Reference Mininni, Alexakis and Pouquet2005; Teaca et al. Reference Teaca, Verma, Knaepen and Carati2009; Verma Reference Verma2022).
New insights into cascade physics have been obtained by analysing the scale-by-scale budgets of energy of filtered fields, including the fluctuations of the flux (Eyink & Sreenivasan Reference Eyink and Sreenivasan2006; Dubrulle Reference Dubrulle2019). Notably, these kinds of complex tools have been used to get insights into the physical mechanisms in two- and three-dimensional fluid turbulence (Piomelli et al. Reference Piomelli, Cabot, Moin and Lee1991; Liu, Meneveau & Katz Reference Liu, Meneveau and Katz1994; Chen et al. Reference Chen, Eyink, Wan and Xiao2006; Eyink Reference Eyink2005; Eyink & Aluie Reference Eyink and Aluie2009) and, more recently, scale-by-scale filtering analysis has been started to be applied also to MHD turbulence to highlight and understand some specific processes (Eyink et al. Reference Eyink, Vishniac, Lalescu, Aluie, Kanov, Bürger, Burns, Meneveau and Szalay2013; Galtier Reference Galtier2018; Bian & Aluie Reference Bian and Aluie2019). The interest of such tools is witnessed by their use in many other problems such as two-fluid plasma models (Camporeale et al. Reference Camporeale, Sorriso-Valvo, Califano and Retinò2018), hybrid kinetic models (Cerri & Camporeale Reference Cerri and Camporeale2020), gyro-kinetics (Teaca et al. Reference Teaca, Gorbunov, Told, Navarro and Jenko2021) and full-kinetic systems (Eyink Reference Eyink2018; Yang et al. Reference Yang, Matthaeus, Roy, Roytershteyn, Parashar, Bandyopadhyay and Wan2022). More generally, this kind of approach seems promising to go beyond standard statistical information and to access energetic processes, which are usually the most important for applications, and are nowadays commonly used in a variety of cases (Danaila et al. Reference Danaila, Anselmet, Zhou and Antonia2001; Casciola et al. Reference Casciola, Gualtieri, Benzi and Piva2003; Sorriso-Valvo et al. Reference Sorriso-Valvo, Marino, Carbone, Noullez, Lepreti, Veltri, Bruno, Bavassano and Pietropaolo2007; Cimarelli, De Angelis & Casciola Reference Cimarelli, De Angelis and Casciola2013; Valori et al. Reference Valori, Innocenti, Dubrulle and Chibbaro2020; Innocenti et al. Reference Innocenti, Jaccod, Popinet and Chibbaro2021). Our work follows this path in order to get similar understanding for MHD turbulence.
Such an understanding of the cascade process is paramount for astrophysical and industrial applications for the following reason. While the numerical solution of the fundamental equations is in principle possible, the vast range of scales excited in such objects prohibits any direct numerical calculation that resolves all the scales down to the dissipation ones. However, if all scales are not properly resolved, the numerical approach is tantamount to applying a coarse-graining to the initial problem discarding a part of the information, related to the small scales not resolved. As a result all simulations of astrophysical flows require some modelling of smaller unresolved scales that are responsible for the energy dissipation. Such modelling will thus have to compensate the energy transfers between resolved and unresolved scales so that it correctly captures the energy dissipation of the flow. The construction of such models requires a deep and quantitative understanding of how turbulence transfers energy to small scales.
This practice of computing only large scales and to put forward approximate models at small scales is referred to as large-eddy simulation (LES), and has a long history in fluid turbulence in particular for practical applications (Leonard Reference Leonard1975; Germano Reference Germano1992; Meneveau & Katz Reference Meneveau and Katz2000; Pope Reference Pope2000; Sagaut Reference Sagaut2001; Lesieur, Métais & Comte Reference Lesieur and Métais2005). In hydrodynamic turbulence the development and testing of such models are thus well advanced. A particular class of hydrodynamic models quantify the dissipation energy by an eddy-viscosity term whose coefficient depends on the gradients of the resolved flow (Smagorinsky Reference Smagorinsky1963; Germano et al. Reference Germano, Piomelli, Moin and Cabot1991; Germano Reference Germano1992), and many studies have been devoted in quantifying this dependence (Vreman, Geurts & Kuerten Reference Vreman, Geurts and Kuerten1994, Reference Vreman, Geurts and Kuerten1997; Borue & Orszag Reference Borue and Orszag1998; Meneveau & Katz Reference Meneveau and Katz2000).
In MHD, LES is less developed and tested than in fluid turbulence. At the same time the complexity of MHD is increased as more channels exist for the energy to be transferred to smaller scales and since there are two fields involved there are more possibilities for the dependence of the eddy-viscosity term. A convenient way to assess subgrid models is through direct numerical simulation (DNS), which is, however, more difficult than in hydrodynamics and only recently have DNS been made available with sufficient resolution allowing for an inertial range to be present. Yet, Smagorinski-like models have been adapted through formal analogy in MHD since the 1990s (Theobald, Fox & Sofia Reference Theobald, Fox and Sofia1994; Müller & Carati Reference Müller and Carati2002; Verma & Kumar Reference Verma and Kumar2004; Bian et al. Reference Bian, Shang, Blackman, Collins and Aluie2021). These models still represent the only available strategy for subgrid modelling (Miesch et al. Reference Miesch, Matthaeus, Brandenburg, Petrosyan, Pouquet, Cambon, Jenko, Uzdensky, Stone and Tobias2015), and they have been recently generalized even to compressible (Chernyshov, Karelsky & Petrosyan Reference Chernyshov, Karelsky and Petrosyan2014; Vlaykov et al. Reference Vlaykov, Grete, Schmidt and Schleicher2016; Grete et al. Reference Grete, Vlaykov, Schmidt and Schleicher2017) and relativistic (Viganò, Aguilera-Miret & Palenzuela Reference Viganò, Aguilera-Miret and Palenzuela2019; Carrasco, Viganò & Palenzuela Reference Carrasco, Viganò and Palenzuela2020) MHD.
Although DNS has been used to partially assess the validity of such closures (Agullo et al. Reference Agullo, Müller, Knaepen and Carati2001; Miesch et al. Reference Miesch, Matthaeus, Brandenburg, Petrosyan, Pouquet, Cambon, Jenko, Uzdensky, Stone and Tobias2015; Kessar, Balarac & Plunian Reference Kessar, Balarac and Plunian2016), a thorough analysis is still needed, given the importance of the problem. Notably, in the last few years, new analysis of this kind of modelling has been made possible by the use of scale-by-scale analysis (Buzzicotti et al. Reference Buzzicotti, Linkmann, Aluie, Biferale, Brasseur and Meneveau2018; Linkmann, Buzzicotti & Biferale Reference Linkmann, Buzzicotti and Biferale2018; Biferale et al. Reference Biferale, Bonaccorso, Buzzicotti and Iyer2019; Alexakis & Chibbaro Reference Alexakis and Chibbaro2020). In these works, it has been pointed out that a deeper understanding of the cascade process, including fluctuations, is valuable also to improve modelling.
The purpose of this work is to shed some light in this direction by examining different MHD turbulence flows and the statistical properties of the local energy flux towards smaller scales, bringing to MHD this original approach already applied to hydrodynamic turbulence. In particular, we analyse the scale-by-scale budgets of kinetic and magnetic energy of highly resolved DNS. This allows one to provide new information on the cascade process, including fluctuations, and thus to go beyond usual investigation of the validity of subgrid models. As a final introductory comment, it is worth emphasizing that our goal is not to put forward and/or test some specific model but rather to get some insights into the modelling via DNS.
2. Theoretical formulation
2.1. Main equations
We begin by considering the MHD equations in the incompressible non-relativistic limit, given as (Biskamp Reference Biskamp2003)


where the modified pressure $p$ is given by $p=P/\rho +b^2/2$
 , ${\boldsymbol {b}}={\boldsymbol {B}}\sqrt {4{\rm \pi} \rho }$
 , where $\rho$
 is the mass density, $\boldsymbol {u}({\boldsymbol {x}}, t)$
 is the flow velocity, $P({\boldsymbol {x}}, t)$
 is the thermal pressure, ${\boldsymbol {B}}({\boldsymbol {x}}, t)$
 is the magnetic induction field, $\nu$
 is the viscosity and $\eta$
 is the magnetic diffusivity.
2.2. Scale-by-scale analysis
A considerable amount of work in analysing the transfer of energy among scales has been performed in Fourier space with significant results (Verma Reference Verma2004; Alexakis et al. Reference Alexakis, Mininni and Pouquet2005; Mininni et al. Reference Mininni, Alexakis and Pouquet2005; Alexakis et al. Reference Alexakis, Mininni and Pouquet2007; Domaradzki et al. Reference Domaradzki, Teaca and Carati2009; Teaca et al. Reference Teaca, Verma, Knaepen and Carati2009, Reference Teaca, Carati and Andrzej Domaradzki2011; Verma Reference Verma2019, Reference Verma2022). This kind of approach while useful in understanding and quantifying the scale-by-scale energy budget of turbulence, does not allow one to simply link the related energy transfers with local properties of the flow and thus limits the applicability to subgrid-scale models.
To analyse the local-in-space scale-by-scale dynamics, we use the local filtering approach (Germano Reference Germano1992). We introduce a filter such that

where $G({\boldsymbol {r}})$ is a smooth filtering function, spatially localized and such that $\int {\rm d}r^3 \,G({\boldsymbol {r}})=1$
 and $\int {\rm d}r^3 \,\vert {\boldsymbol {r}} \vert ^2 G({\boldsymbol {r}}) \approx 1$
 . The function $G_\ell$
 is rescaled with $\ell$
 as $G_\ell ({\boldsymbol {r}}) = \ell ^{-3}G({\boldsymbol {r}}/\ell )$
 . Applying this filter to the MHD equations, one obtains (Aluie Reference Aluie2017)


Here $\boldsymbol {\tau }^{uu}_\ell$ , $\boldsymbol {\tau }^{bb}_\ell$
 , $\boldsymbol {\tau }^{ub}_\ell$
 and $\boldsymbol {\tau }^{bu}_\ell$
 are the subscale stress tensors which describe the force exerted on scales larger than $\ell$
 by fluctuations at scales smaller than $\ell$
 . They are defined as

which are the subscale Reynolds stress and the subscale Maxwell stress, respectively, and finally

are cross-field tensors for which one is the transpose of the other, $\boldsymbol {\tau }^{bu}_\ell =[\boldsymbol {\tau }^{ub}_\ell ]^{\rm T}$ .
Using this notation we can write an equation for the large-scale energy densities $\tilde {\mathcal {E}}^u=\frac {1}{2}|\tilde {\boldsymbol {u}}|^2$ and $\tilde {\mathcal {E}}^b=\frac {1}{2}|\tilde {\boldsymbol {b}}|^2$
 as


where the currents $\mathcal {J}^u,\mathcal {J}^b$ are given by


and express the transport of energy in space. The rate of work done on the flow originating from the Lorentz force is given by

This term is responsible for the transfer of kinetic energy to magnetic energy in the large scales. The viscous and Ohmic energy dissipation rates are given by

and express the rate that energy is dissipated by viscous and Ohmic effects, respectively. These terms can be shown to be negligible if the filter scale is large and the viscous/resistive coefficients are small (Aluie Reference Aluie2017). Finally the four fluxes in scale space $\varPi _\ell ^{uu},\varPi _\ell ^{bb},\varPi _\ell ^{ub}$ and $\varPi _\ell ^{bu}$
 , explicitly given by


express the rate of gain (if $\varPi _\ell <0$ ) or loss (if $\varPi _\ell >0$
 ) of energy of the large scales to the small filtered-out scales. Their sum gives the total energy flux:

The fluxes are chosen so that they are invariant under Galilean transformations ${\boldsymbol {u}} \to {\boldsymbol {u}}+{\boldsymbol {U}}_0$ and also under ${\boldsymbol {b}} \to {\boldsymbol {b}}+{\boldsymbol {B}}_0$
 for any flow realization $\boldsymbol {u},\boldsymbol {b}$
 , where $\boldsymbol {U}_{\boldsymbol {0}},\boldsymbol {B}_{\boldsymbol {0}}$
 are constant in space vector fields. The importance of Galilean invariance has been noted in the past (Speziale Reference Speziale1985; Aluie & Eyink Reference Aluie and Eyink2009, Reference Aluie and Eyink2010). We note, however, that while the defined fluxes are invariant under ${\boldsymbol {b}} \to {\boldsymbol {b}}+{\boldsymbol {B}}_0$
 , the MHD equations are not. Therefore, the introduction of a constant ${\boldsymbol {B}}_0$
 in the dynamics of the MHD equations will alter the statistical behaviour of the fields $\boldsymbol {u},\boldsymbol {b}$
 and as a result of the fluxes as well.
The fluxes in (2.16)–(2.19) comprise the main object of the present work.
2.3. Filters
Although we formulate our filtering procedure in physical space, since we will be working in periodic domains it is useful to define the filters through their Fourier transforms:

where $q=1/\ell$ is the wavenumber corresponding to the filter length $\ell$
 , not to be confused with the Fourier wavenumber $k$
 . For the first filter we consider a Gaussian kernel:

For an infinite domain this filter corresponds to the Gaussian filter in real space $G_\ell (r) =\exp (-\frac {1}{2}r^2/\ell ^2) /(2{\rm \pi} \ell ^{2})^{3/2}$ . We note that this filtering is not a projection and in general $\widetilde {({\tilde {\boldsymbol {u}}_\ell })_\ell }\ne \tilde {\boldsymbol {u}}_\ell$
 . The second filter we consider is a sharp spectral filter such that

This filtering is a projector $\widetilde {({\tilde {\boldsymbol {u}}_\ell })_\ell }= \tilde {\boldsymbol {u}}_\ell$ and is based on a Galerkin truncation for all wavenumbers larger than the given cutoff $q=1/\ell$
 . With regard to the representation of energy fluxes, this filter has been shown in the past not to be optimal as it leads to wider fluctuations of the local energy flux (Buzzicotti et al. Reference Buzzicotti, Linkmann, Aluie, Biferale, Brasseur and Meneveau2018; Alexakis & Chibbaro Reference Alexakis and Chibbaro2020), something that as we show also holds in MHD.
3. Subscale stress modelling
In this section, we provide some information about typical modelling strategies. Our work focuses on fundamental issues, which allows us to build a precise framework and to point to possible applications. In a simulation for which only the large smoothed-out fields $\tilde {\boldsymbol {u}},\tilde {\boldsymbol {b}}$ are followed dynamically the effect of the small unresolved scales on the resolved scales needs to be captured by modelling the subscale stress tensors $\boldsymbol {\tau }_\ell ^{uu},\boldsymbol {\tau }_\ell ^{ub},\boldsymbol {\tau }_\ell ^{bu},\boldsymbol {\tau }_\ell ^{bb}$
 . In hydrodynamics, perhaps the simplest such model is formed by assuming that $\boldsymbol {\tau }^{uu}$
 takes the form

where the eddy-viscosity tensor ${\boldsymbol {\nu }}^e$ is a function of space and time and needs to be prescribed from the filtered field $\tilde {\boldsymbol {u}}$
 in order for the filtered equations to be closed. It needs to satisfy $\langle \boldsymbol {\nabla }_i \tilde {\boldsymbol {u}}_j\nu ^e_{\ell,ijkl} \boldsymbol {\nabla }_k \tilde {\boldsymbol {u}}_l\rangle =\epsilon > 0$
 and acts thus on average as a sink of energy. Furthermore, the divergence of $\boldsymbol {\nabla }\boldsymbol {\cdot } \boldsymbol {\tau }^{uu}_\ell$
 is not necessarily zero so its projection to divergence-free vector fields needs to be considered by adding $p'=\nabla ^{-2} \boldsymbol {\nabla }_i \boldsymbol {\nabla }_j \tau ^{uu}_{\ell,ij}$
 to the pressure. Since the system is Galilean invariant $\nu ^e$
 cannot depend on the values of $\tilde {\boldsymbol {u}}$
 but only on its gradients $\boldsymbol {\nabla } \tilde {\boldsymbol {u}}, \boldsymbol {\nabla }\boldsymbol {\nabla } \tilde {\boldsymbol {u}},\ldots$
 ; thus in the simplest case $\nu _\ell ^e$
 is just a function of $\boldsymbol {\nabla } \tilde {\boldsymbol {u}}$
 . If we further assume that isotropy is present at the small scales, $\nu ^e[\boldsymbol {\nabla } \tilde {\boldsymbol {u}}]$
 will only depend on the invariants (under rotations and reflections) of the strain tensor $\boldsymbol {\nabla } \tilde {\boldsymbol {u}}$
 . In the now classical Smagorinsky approach the subscale Reynolds stress tensor is modelled as (Smagorinsky Reference Smagorinsky1963)

where $\tilde {\boldsymbol {S}}$ is the symmetric part of the filtered strain tensor. Here $\nu ^e$
 is a scalar defined as (Smagorinsky Reference Smagorinsky1963)

where $\ell$ is the filtering length scale and $c$
 is the Smagorinsky constant, an order-one non-dimensional coefficient. Equation (3.3) gives the only combination of $\ell$
 and $|\tilde {\boldsymbol {S}}|$
 with dimensions of viscosity. We note that in general $\nu _\ell ^e$
 depends on space and needs to be taken into account for the pressure so that the divergence-free condition for $\tilde {\boldsymbol {u}}$
 is satisfied.
This model implies that the flux of energy to small scales is given by

After Smagorinsky's work other models that also take into account the antisymmetric part of the stress tensor

have been developed. Approximating the subscale stress with its extreme local expression, the nonlinear Clark model is obtained (Meneveau & Katz Reference Meneveau and Katz2000):

where both strain and vorticity participate in the dynamics (Tennekes & Lumley Reference Tennekes and Lumley1990; Misra & Pullin Reference Misra and Pullin1997; Borue & Orszag Reference Borue and Orszag1998), and leads to modelled local energy flux:

The development and assessment of such models have been often guided by a priori analysis (Piomelli et al. Reference Piomelli, Cabot, Moin and Lee1991; Meneveau Reference Meneveau1994; Borue & Orszag Reference Borue and Orszag1998; Meneveau & Katz Reference Meneveau and Katz2000), that is, studying the filtered DNS field properties rather than resorting to actual LES. Following this approach, in Alexakis & Chibbaro (Reference Alexakis and Chibbaro2020) we have demonstrated that there is indeed a strong correlation between $\varPi _\ell$ and $|\tilde {\boldsymbol {S}}|$
 verifying the Smagorinsky relation (3.4) for the mean value of $\varPi _\ell$
 , although strong fluctuations in $\varPi _\ell$
 were also measured making $\varPi _\ell$
 not a strictly positive quantity.
In MHD, a similar type of modelling is considerably more difficult. First of all there are three subscale turbulent stresses that need to be modelled: $\boldsymbol {\tau }_\ell ^{uu},\boldsymbol {\tau }_\ell ^{ub}$ and $\boldsymbol {\tau }_\ell ^{bb}$
 . In past literature these dependencies are modelled based on the symmetric and antisymmetric parts of the stress tensors of the two fields:


An in-depth discussion of different models used can be found in Müller & Carati (Reference Müller and Carati2002) and Miesch et al. (Reference Miesch, Matthaeus, Brandenburg, Petrosyan, Pouquet, Cambon, Jenko, Uzdensky, Stone and Tobias2015). Furthermore, although the system is still Galilean invariant, it is not invariant under transformation $\boldsymbol {b} \to \boldsymbol {b}+\boldsymbol {B}_{\boldsymbol {0}}$ , where $\boldsymbol {B}_{\boldsymbol {0}}$
 is a constant in space magnetic field. The statistics of the subfilter-scale fields can depend on the local value of $\tilde {\boldsymbol {b}}$
 and as a result so will the relevant eddy viscosities that attempt to model their effect. Finally, in the presence of helicity the small scales are known to transfer energy to the large scales in a mean way by the alpha dynamo mechanism that modelling needs to take into account.
Given the large number of the properties of the smoothed fields that the modelling of the subscale turbulent stresses can depend on, it is important to try to limit the possibilities identifying the parameters that play the most important role. This is what we attempt to do in the following sections using DNS for which the turbulent stresses can be directly measured. Thus, we need to stress that we do not test a posteriori any proposed model. Instead we are trying a priori to find relations that hold between the local energy flux and the gradients of the flow so that they can be used in the construction of new models.
4. Numerical simulations
4.1. Numerical set-up
To investigate the local energy fluxes described before, we use the results from DNS using the pseudo-spectral code ghost (Mininni et al. Reference Mininni, Rosenberg, Reddy and Pouquet2011) evolving the MHD equations (2.1)–(2.3a,b) in a cubic triple periodic domain of side $L=2{\rm \pi}$ so that $|\boldsymbol {k}|=\boldsymbol {1}$
 gives the smallest non-zero wavenumber. The forcing is limited only to wavenumbers with $|{\boldsymbol {k}}|\leqslant k_f=2$
 in all cases and is random and delta-correlated in time so that the mean energy injection rate $\epsilon = \langle {\boldsymbol {u} \boldsymbol {\cdot } \boldsymbol {f}_{\boldsymbol {u}}}\rangle + \langle {\boldsymbol {b} \boldsymbol {\cdot } \boldsymbol {f}_{\boldsymbol {b}}}\rangle =1$
 is independent of the flow state. All runs have the same energy injection rate and unit Prandtl number with $\nu =\mu =0.0001$
 . The involved Reynolds number based on the input parameters $\epsilon$
 , $L$
 and $\nu$
 is given by $Re=\epsilon ^{1/3}k_f^{4/3}/\nu$
 that is thus fixed to $Re=3968$
 . The resolution was fixed for all runs at $N=1024$
 grid points in each direction that was sufficient for the flow to be well resolved so that an exponential decrease of the energy spectrum is observed at large $k$
 . No artificial dissipation was used.
Four different cases were considered. In the first, no magnetic forcing was introduced and the magnetic field was set identically to zero $\boldsymbol {b}=\boldsymbol {0}$ so that the flow reduced to a hydrodynamic run, repeating essentially the results of Alexakis & Chibbaro (Reference Alexakis and Chibbaro2020). This run is used as a reference to identify the differences of MHD from hydrodynamic runs and is referred to in the subsequent figures as ‘hydro’. The remaining three runs were designed to have different levels of magnetic energy as in Alexakis (Reference Alexakis2013). The second run was thus a dynamo run. No magnetic forcing was used but an initial small magnetic field was introduced that was amplified by the turbulent motions until a steady state was reached where the magnetic energy fluctuated around a mean value. We note that the forcing was mirror-symmetric so no helicity is injected in the system. A result of the absence of helicity and the randomness of the flow is that magnetic energy is concentrated in the small scales. This run is referred to in the figures as ‘dynamo’. In the third run a magnetic forcing was also used of equal magnitude to the mechanical flow. The resulting flow at steady state has magnetic energy at equipartition with the kinetic energy at all scales. The helicity and magnetic helicity injection rate for this flow are also set to zero. Results from this run are referred to as ‘moderate’. Finally the fourth flow was also both mechanically and magnetically forced but in this case the magnetic helicity was weak but not zero. This leads to the formation of a slowly growing large-scale helical magnetic field. As a result this flow has magnetic energy that exceeds the kinetic energy of the flow. This run is referred to in the figures as ‘strong’.
It is worth noting that all the statistics we present in the following are obtained through time-averaging over a large amount of samples during the steady state to ensure statistical convergence. Whenever possible, several field realizations have been used also to average over space, because of spatial homogeneity.
4.2. Energy spectra and magnetic field
Figure 1 shows the resulting time-averaged energy spectra for the four runs at the steady state. For the dynamo run in particular, analysis is made at the state such that magnetic energy no longer grows. All runs show energy spectra compatible with a $k^{-5/3}$ power-law exponent. The magnetically forced runs moderate and strong have equipartition magnetic energy across wavenumbers except for $k=1$
 in the strong case for which magnetic energy is larger. For the dynamo run the magnetic energy is weaker than kinetic at small wavenumbers but the reverse is true for large wavenumbers. This behaviour is typical for randomly forced non-helical small-scale dynamos (Schekochihin et al. Reference Schekochihin, Cowley, Taylor, Maron and McWilliams2004; Moll et al. Reference Moll, Graham, Pratt, Cameron, Müller and Schüssler2011; Brandenburg, Sokoloff & Subramanian Reference Brandenburg, Sokoloff and Subramanian2012). Dynamo flows with steady non-helical forcing, like Taylor–Green flows for example (Ponty et al. Reference Ponty, Mininni, Laval, Alexakis, Baerenzung, Daviaud, Dubrulle, Pinton, Politano and Pouquet2008), produce spectra closer to those of the moderate run. This figure points out also that a quasi-inertial range is roughly displayed over about a decade between $k=4$
 and $k=64$
 , as standard with the present resolution.
Energy spectra for the four different cases examined.

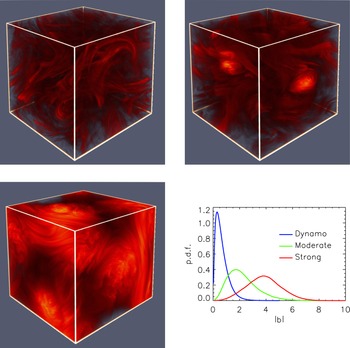
In figure 2, it is possible to get some qualitative insights into the different cases studied. Notably, the visualization of the magnetic energy permits one to observe the structure of the large scales, through its space distribution. The dynamo case displays very little dispersion of the magnetic field amplitude, and energy is concentrated in flux tubes. The moderate case shows a larger distribution and some regions of intense field. Finally the strong case shows a much more widely distributed energy, with some regions characterized by large values of the magnetic field, and in particular large-scale structures are visible. To give a quantitative picture, we also show in figure 2 the probability distribution of the magnetic amplitude $|\boldsymbol {b}|$ for the three MHD cases examined. In the dynamo case the maximum is at small $|{\boldsymbol {b}}|$
 , with a peaked distribution. The width of the distribution increases in the other two cases, with a broad distribution for the strong case. In this last case, the tails appear substantial.
Visualizations of the magnetic energy density for the dynamo case (top left), the moderate case (top right) and the strong case (bottom left). The bottom-right panel shows the p.d.f. of $|{\boldsymbol {b}}|$ for the three different MHD flows examined.

5. Statistics of the local energy flux
The local energy fluxes $\varPi _\ell ^{uu}(x)$ , $\varPi _\ell ^{ub}(x)$
 , $\varPi _\ell ^{bu}(x)$
 , $\varPi _\ell ^{bb}(x)$
 and $\varPi _\ell (x)$
 were calculated for the four different runs at their steady state. Figure 3 shows the probability density function (p.d.f.) for the four different runs using a sharp spectral filter and Gaussian filter for a filter length $q=32$
 , which corresponds to a value at around the end of the inertial range.
The p.d.f. of the total nonlinear flux $\varPi _\ell (x)$ at $q=32$
 for a sharp spectral filter on the left and a Gauss filter on the right, for the four different runs.

As in hydrodynamics, in MHD the sharp spectral filter leads to a wider and more symmetric p.d.f. of $\varPi _\ell$ . Interestingly, the pure hydro curve presents the strongest tails, while with the Gaussian filter the profiles were found always similar. Considering the representation of the fluxes, the sharp filter is thus found to enhance fluctuations displaying many negative events, making it more difficult to use directly in LES. The reason for this behaviour is the fact that the sharp filter is not localized in space and not positive-definite. For this reason, it appears less useful for the analysis of the energy fluxes and it is abandoned in the following. In this sense, the present analysis confirms previous results obtained in the pure hydrodynamic case (Buzzicotti et al. Reference Buzzicotti, Linkmann, Aluie, Biferale, Brasseur and Meneveau2018; Alexakis & Chibbaro Reference Alexakis and Chibbaro2020).
The Gaussian filter leads for all four cases to a skewed p.d.f. with non-Gaussian (stretched exponential) tails. The tails for all cases extend to values a hundred times more than the mean value $\langle \varPi _\ell \rangle =1$ , implying that, although rare, these events can play a significant role in the dynamics. The most notable result when comparing the four different cases is that the dynamo run has weaker tails than the other flows. It turns out hence that the dynamo dynamics suppresses efficiently extreme energy flux fluctuations. Small differences are experienced between the moderate and strong cases, indicating that fluid fluctuations are not affected by the large helical magnetic field, which is present only in the strong case. It is possible to observe just a slight increase in the probability of negative events with respect to positive ones. Still, not much difference is found either comparing the moderate or strong cases with the hydro case.
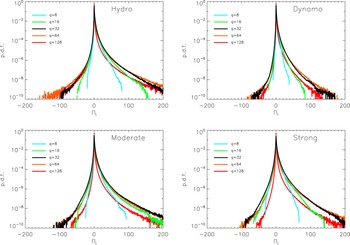
The statistical behaviour of the energy flux $\varPi _\ell$ is further studied in figure 4. Here we present the p.d.f. of the flux $\varPi _\ell$
 at different scales $\ell =1/q$
 , for the four different cases. The hydro results are given for comparison. The first remark is that, as said above, the dynamo case is quite different from the others, with more shrunken distributions, though the distribution remains tailed and skewed. All the cases display similar changes on going towards smaller scales. The profiles are much less wide in the large-scale range $q=8,16$
 , notably for $q=8$
 . Then, the distributions are basically indistinguishable for $q=32,64$
 , which are more or less in the far inertial range, and finally the tails are again reduced for $q=128$
 , which is in the dissipation range. As expected, intermittency is maximum at the end of the inertial range. Slight differences between the moderate case and the strong case can be detected, yet are not significant.
The p.d.f. of the energy flux for different $q$ for the three MHD cases. In the top-left panel, the hydro case is also plotted for comparison.

Now, we turn our attention to the four different components of the total energy flux $\varPi _\ell (x)$ . In figure 5 we compare all the terms $\varPi _\ell ^{uu}(x)$
 , $\varPi _\ell ^{ub}(x)$
 , $\varPi _\ell ^{bu}(x)$
 and $\varPi _\ell ^{bb}(x)$
 composing $\varPi _\ell$
 as given by (2.16)–(2.19). The fluxes show different behaviour in the three different cases examined. The first striking observation is that in all cases the pure hydrodynamic flux is the smallest one, resulting in less than 10 % of the total flux, something that has already been observed (Alexakis Reference Alexakis2013) in past simulations. Most notably, it shows the least important negative fluctuations. It was not possible to infer that from looking only at the total flux $\varPi _\ell$
 , which is found in figure 2 to be similar in the hydro and all the MHD cases. In the moderate and strong cases, the hydrodynamic flux $\varPi _\ell ^{uu}$
 is basically the same as the cross-magnetic hydro flux $\varPi _\ell ^{ub}$
 , while the two are different for the dynamo case. As a consequence, in all cases the terms found to be dominant are $\varPi ^{bu}_\ell$
 and $\varPi ^{bb}_\ell$
 , that is, the blue and red lines, and correspond to more than 70 % of the flux. Therefore, the coupling magnetic term contributing to the kinetic energy flux dominates the pure hydro term. Since the total flux in the hydro case is very similar, except for the dynamo case, it appears that the cascade readjusts to distribute much of the flux in this term, although the total kinetic flux remains unchanged. It is interesting to remark also that in the strong case, where both the velocity and the magnetic fields are fully developed, there is a nice symmetry between the two fluxes, with $\varPi _\ell ^{uu}\approx \varPi _\ell ^{ub}$
 and $\varPi _\ell ^{bu}\approx \varPi _\ell ^{bb}$
 . That points to two very similar cascade processes and could be related to the equipartition of the magnetic and kinetic energy cascade recently conjectured in Bian & Aluie (Reference Bian and Aluie2019). While for the moderate case this symmetry appears also holding apart from the extreme events, the dynamo case breaks it underlying different physics of the cascade process.
The different components of the energy flux for $q=32$ . The total flux is also plotted for comparison. The three MHD cases are considered.

Finally, it is useful to note that all the terms, and hence the total flux, are production terms, that is, the flux is on average positive towards smaller scales, even though there may be a significant local negative flux. We note also that in the dynamo case there is a mean transfer of kinetic energy to magnetic energy by both the $\varPi ^{bb}_\ell$ flux and the $\mathcal {W}_L$
 term in the large scales (that we do not examine here). This may alter the transfer balance between the different cases. Concerning the negative fluxes, it is important to remark that, unlike the positive tails, the negative parts of the p.d.f.s are basically the same for all components. This is most notably true for the strong case, but also in the other two cases the differences are limited to the region of extremely rare events, where statistical errors may be substantial. This shows that a change in large-scale amplitude of the magnetic field can affect the smaller-scale forward cascade process.
6. Joint p.d.f.s
6.1. Field gradients
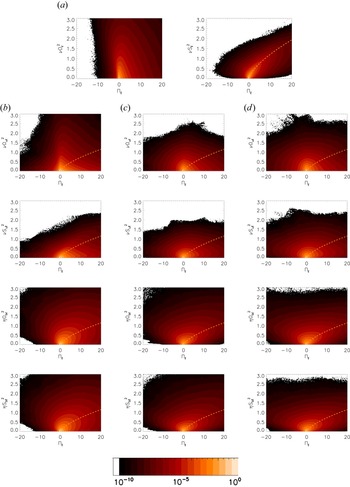
In order to help the construction of subgrid-scale models that are based on the gradients of the resolved fields, we need to reveal what correlation exists between the gradients and the local energy flux. In figure 6 we present the joint p.d.f.s between $\varPi _\ell$ and the modulus squared of the symmetric and antisymmetric stress tensors $\varOmega _{u,\ell }^2$
 , $\varOmega _{b,\ell }^2$
 , $S_{u,\ell }^2$
 and $S_{b,\ell }^2$
 . The results are for a given wavenumber in the inertial range $q=32$
 .
Joint p.d.f.s of $\varPi _\ell$ (for $q=32$
 ) with the modulus of the different strain rates for (a) hydrodynamic case, (b) dynamo case, (c) moderate case and (d) strong case. From top to bottom the examined strain is $\varOmega _{u,\ell }^2$
 , $S_{u,\ell }^2$
 , $\varOmega _{b,\ell }^2$
 and $S_{b,\ell }^2$
 . The colour map is logarithmic covering ten orders of magnitude with bright colours indicating high probability. The yellow dashed line indicates the Smagorinsky scaling $\varPi _\ell \propto \varOmega _\ell ^{3/2}$
 and $\varPi _\ell \propto S_\ell ^{3/2}$
 .

The results obtained for the pure hydrodynamic configuration are shown for comparison in figure 6(a). In this case, the energy flux is essentially uncorrelated with the antisymmetric part of the strain $\varOmega _\ell$ with high-probability events for a given $\varOmega _\ell$
 concentrated around $\varPi _\ell =0$
 . On the other hand, a visible correlation is observed with the modulus of the symmetric part of the strain tensor $S_{\ell }$
 , with high-probability events for a given $S_\ell$
 concentrated around a non-zero value of $\varPi _\ell$
 that increases with $S_\ell$
 . The yellow line corresponds to the Smagorinsky scaling of (3.4). The flux $\varPi _\ell$
 is concentrated around this line giving support to the Smagorinsky model.
Such correlations are less clear for the MHD results. For the dynamo case in the $\varPi _\ell$ –$\varOmega _{u\ell }$
 diagram, high-probability events are concentrated around $\varPi _\ell =0$
 again. For the $\varPi _\ell$
 –$S_{u\ell }$
 diagram, a much weaker correlation is observed compared with the hydro case. The probability density shows long tails with large $\varPi _\ell$
 for small $S_{u\ell }$
 indicating that $S_{u\ell }$
 is not dominant in driving the cascade. A stronger correlation is observed with $\varOmega _{b,\ell }^2$
 and $S_{b,\ell }^2$
 . High-probability events are aligned with the Smagorinsky scaling (yellow dashed line) but the spread is much higher than in the hydro case. The fact that the correlations with $\varOmega _{b,\ell }^2$
 and $S_{b,\ell }^2$
 look very similar indicates that neither of the two alone is an optimal proxy to estimate the energy flux to the small scales.
The lack of correlation of $\varPi _\ell$ with the velocity gradients is even more clear for the moderate and strong cases. For these cases no correlation is seen either with $\varOmega _{u,\ell }^2$
 or with $S_{u,\ell }^2$
 . Although there is some correlation with the magnetic field gradients $\varOmega _{b,\ell }^2$
 and $S_{b,\ell }^2$
 with the maximum of probability (for fixed $\varOmega _{b,\ell }^2$
 or $S_{b,\ell }^2$
 ) following the Smagorinsky scaling (yellow dashed line), the spread is very large with highly probable negative flux events that become more frequent for the strong field case. This indicates that although there is some correlation with the magnetic field gradients, modelling the subscale stresses with $\varOmega _{b,\ell }^2$
 and $S_{b,\ell }^2$
 alone is still missing important ingredients.
6.2. Local magnetic field
We pursue the analysis of the statistical phenomenology of the cascade process looking at correlations between the flux and the magnetic field. Figure 7 shows the joint p.d.f. of $\varPi _\ell$ and $\tilde {\boldsymbol {b}}$
 for the different cases examined. The three cases display different distributions, yet with similar characteristics. Generally speaking, the maximum probability of the flux as well as most extreme values of it are obtained in the region around the average value of the magnetic field. Furthermore, the larger the average magnetic field, the wider the distribution. In this concern, it is interesting to note that the isolines are almost flat over a large range, indicating that in such a large region the flux distribution, and therefore the cascade process, is basically independent of the value of the magnetic field. That is particularly true for the strong case.
Joint p.d.f. of the local flux $\varPi$ and the local amplitude of the magnetic field $b$
 for the three cases: dynamo (left), moderate (centre) and strong (right).

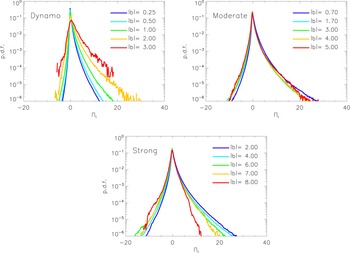
More insight is gained by looking at the p.d.f. of the energy flux conditioned on the knowledge of the magnetic field amplitude. This corresponds at looking at ‘slices’ of figure 7 for fixed values of $\tilde {\boldsymbol {b}}$ and allows a more clear look at the extreme events. The results are displayed in figure 8. Seen this way some differences can be noted between the three different cases. For the dynamo case there is a monotonic increase of the tails of the distribution with respect to increasing magnetic field. Both negative and positive tails are wider when related to a larger magnetic field amplitude. In this case large values of $\tilde {\boldsymbol {b}}$
 indicate more extreme events.
Conditioned p.d.f., i.e. probability of having flux $\varPi _\ell$ given the magnetic field amplitude $|{\boldsymbol {b}}|$
 . In the dynamo case, large $|{\boldsymbol {b}}|$
 enhances large fluctuations.

In the moderate case, the probability distribution seems to be almost insensitive to changes in the magnetic field amplitude. The distribution would point to an energy cascade somewhat independent of the magnetic field amplitude. Some small differences are actually present in the distributions, but they are not much more important than statistical errors.
For the strong case, the negative tails increase monotonically with the amplitude of the magnetic field. The positive tails, on the other hand, are monotonically decreased by increasing the magnetic field. Therefore, in strongly magnetized flows, large $|{\boldsymbol {b}}|$ reduces extreme direct cascade fluctuations, while increasing inverse cascade fluctuations. In this sense, the skewness of the distribution seems to be affected by the amplitude of the magnetic field. It appears that in regions of very large magnetic field the distribution is made symmetric. Possibly this behaviour occurs because locally in regions of large $\tilde {\boldsymbol {b}}$
 turbulence transitions to a wave turbulence regime that has weaker forward energy flux or by rendering the flow locally quasi-two-dimensional. This effect, however, would require further investigation to be fully understood, and to assess possible finite-size effects.
7. Conclusions
In this work we have analysed the statistics of the local energy flux for three different MHD flows. A scale-by-scale analysis in physical space has been carried out that allows us to access relevant information on the energy cascade process that could help the construction of subgrid-scale models.
First, we have found that a Gaussian filter should be preferred to a spectral one with regard to the representation of the energy fluxes, a result previously obtained for fluid turbulence. Then, the results of the total energy flux showed some similarities with the hydrodynamic case with $\varPi _\ell$ showing a skewed distribution with large tails. However, the dynamo case displays clear differences with respect to the other two cases. This is actually a general feature detected for all observables. On the other hand, moderate and strong cases display overall similar trends and profiles, as revealed by the fluxes computed at different scales.
The analysis of the different components of the energy flux has highlighted that the magnetic field plays a dominant role in the forward cascade. Specifically, the term related to the work made against the subscale Reynolds stress is negligible. This is a key information for modelling. The negative part of the flux, that is, the backscatter flux, is instead basically the same for all components. Moreover, the study of the correlation between the energy flux and the different strain and rotation tensors has indicated that: (i) while results give some support to Smagorinski-like closure, at variance with pure hydrodynamic turbulence, MHD energy flux cannot be globally recovered with a simple formula and several eddy viscosities should be used; (ii) as pointed out in previous works, the vorticity tensor has little correlation and can be omitted from modelling, at least as a first approximation; (iii) contrarily to what is commonly used, we have found that the magnetic strain tensor $S_{b,\ell }$ contribution is not negligible with respect to the antisymmetric rotation $\varOmega _{b,\ell }$
 one, with regard to the entire flux, so both $S_{b,\ell }$
 and $\varOmega _{b,\ell }$
 need to be used to model subscale stresses; and finally (iv) we have found that the presence of a large magnetic field has an impact on the local shape of the energy flux, and the flux in regions of very high magnetic field has reduced forward fluctuations. New thorough studies would be needed to confirm this result, notably with different magnetic field strength.
Present results indicate new directions for optimizing subgrid-scale models in MHD turbulent flows. Many open questions still remain that future research should address. In particular the correlation between the local energy flux $\varPi _\ell$ and physically motivated combinations of the tensors $\varOmega _{u,\ell },\varOmega _{b,\ell },S_{u,\ell },S_{b,\ell }$
 would be a next step. Theoretical work in the same spirit as in the Clark model (Meneveau & Katz Reference Meneveau and Katz2000) can also help in this direction. We plan to address these issues in our future work.
Acknowledgements
This work was granted access to the HPC resources of MesoPSL financed by the Région Ile de France and the project Equip@Meso (reference ANR-10-EQPX-29-01) of the programme Investissements d'Avenir supervised by the Agence Nationale pour la Recherche and the HPC resources of TGCC & CINES (allocation nos. A0090506421, A0110506421 and A0062B10759) attributed by GENCI (Grand Equipement National de Calcul Intensif) where the present numerical simulations were performed.
Editor Thierry Passot thanks the referees for their advice in evaluating this article.
Funding
This work was supported by the Agence Nationale de la Recherche (ANR DYSTURB project no. ANR-17-CE30-0004).
Declarations of interests
The authors report no conflict of interest.