
1. Introduction
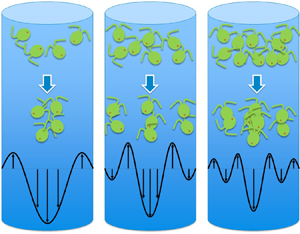
Gyrotaxis describes the biased swimming of bottom-heavy micro-organisms, such as Chlamydomonas and Dunaliela, under the combined influence of ambient vorticity and gravity. It is a result of the balancing between the viscous torque originating from the vorticity and the gravitational restoring torque from the bottom heaviness of the cell. Gyrotaxis has been shown to be an important mechanism responsible for phenomena such as bioconvection (Pedley, Hill & Kessler Reference Pedley, Hill and Kessler1988; Bees Reference Bees2020) and gyrotactic trapping of algal species in the ocean (Durham, Kessler & Stocker Reference Durham, Kessler and Stocker2009).
The term ‘gyrotaxis’ was first coined by Kessler (Reference Kessler and Velarde1984, Reference Kessler1985a,Reference Kesslerb, Reference Kessler1986). In a series of experiments, he was able to single out the gyrotactic mechanism by observing an initially uniform suspension of bottom-heavy motile cells, which undergoes gyrotactic focusing along the axis of a long downflowing pipe. Kessler (Reference Kessler1986) proposed a simple deterministic model to describe the gyrotactic plume, in which he assumed that the net flux of cells swimming towards the centre is proportional to the local shear rate and that the diffusivity is constant and isotropic. Using the same model, Pedley et al. (Reference Pedley, Hill and Kessler1988) analysed the linear stability of a uniform and stationary suspension of gyrotactic swimmers in an infinite spatial domain. In the uniform suspension, where the mechanism of gravitational overturning in thermal convection (Childress, Levandowsky & Spiegel Reference Childress, Levandowsky and Spiegel1975) is absent, they found that gyrotaxis itself causes an instability (i.e. gyrotactic instability), which is likely to be responsible for the plume formation in deep suspensions (Kessler Reference Kessler1985b). Pedley et al. (Reference Pedley, Hill and Kessler1988) further compared the wavelength of the plume structures predicted by the linear stability analysis with that observed in experiments, but failed to obtain a good agreement. They proposed three potential origins for the discrepancy: (i) finite-depth effect; (ii) poor estimation of diffusivity; and (iii) nonlinear evolution of the plumes. The first issue was tackled by Hill, Pedley & Kessler (Reference Hill, Pedley and Kessler1989), and later by Bees & Hill (Reference Bees and Hill1998), where the linear stability of shallow suspensions was examined. The second has previously been discussed extensively (e.g. Bearon, Bees & Croze Reference Bearon, Bees and Croze2012; Croze et al. Reference Croze, Sardina, Ahmed, Bees and Brandt2013; Croze, Bearon & Bees Reference Croze, Bearon and Bees2017), and more recently by Fung, Bearon & Hwang (Reference Fung, Bearon and Hwang2020) and Jiang & Chen (Reference Jiang and Chen2020). In particular, these works demonstrated that the generalised Taylor dispersion (GTD) model provides a more accurate description for the dispersion and instability of the suspension.
The objective of this work is to address the third issue, i.e. the role of nonlinearity in the plume formation. In particular, we shall consider a vertical pipe with both upward and downward flow and exhaustively seek the nonlinear solutions. For simplicity, here an infinitely long pipe is considered and the solution is assumed to be uniform in the axial and azimuthal directions. Several previous studies have considered the steady solutions for the nonlinear axially uniform gyrotactic plume in a downflowing pipe. Kessler (Reference Kessler1986) first derived an analytical solution, but it was limited to the case where the pressure gradient is zero. Bees & Croze (Reference Bees and Croze2010) obtained the solution asymptotically and found that there can be more than one solution for a given set of parameters. More recently, Bearon et al. (Reference Bearon, Bees and Croze2012) and Croze et al. (Reference Croze, Sardina, Ahmed, Bees and Brandt2013, Reference Croze, Bearon and Bees2017) have computed the solution numerically using the GTD model to demonstrate its outperformance against the earlier model by Pedley & Kessler (Reference Pedley and Kessler1990).
Despite these advances made over the years, little attention has been paid to the role of nonlinearity in the existence of the solutions itself. Indeed, it has only been very recently discovered that the solution for a uniform and stationary suspension undergoes a transcritical bifurcation, through which a non-trivial solution emerges in the form of a single vertically uniform plume (Fung et al. Reference Fung, Bearon and Hwang2020). In particular, the latter solution was found to be essentially an extension to that of Kessler (Reference Kessler1986). With the addition of a small downflow, these two solutions are connected through an imperfect bifurcation, in which the transcritical bifurcation point subsequently evolves into a saddle-node point. Furthermore, in Fung et al. (Reference Fung, Bearon and Hwang2020), the existence of a steady solution was found to be limited within a certain range of the parameters. Indeed, for a sufficiently large downflow, the solution obtained with the GTD model does not exist when the Richardson number, which would depict the averaged cell number density (see (2.2a–d)), is greater than a critical value.
In this study, we will extend the finding of Fung et al. (Reference Fung, Bearon and Hwang2020) by seeking solutions at sufficiently low flow rate. In contrast to Fung et al. (Reference Fung, Bearon and Hwang2020), here we seek solutions at Richardson number higher than the threshold. In particular, we will report that countably infinitely many solutions exist due to the coupling between the flow and cell number density equations. We will show that all these solutions emerge through a sequence of transcritical bifurcations, as the Richardson number increases.
2. Problem formulation
Following the same assumptions as Bearon et al. (Reference Bearon, Bees and Croze2012), Croze et al. (Reference Croze, Sardina, Ahmed, Bees and Brandt2013, Reference Croze, Bearon and Bees2017) and Fung et al. (Reference Fung, Bearon and Hwang2020), in the present study, we are only concerned with the axisymmetric and axially uniform solution of the suspension in an infinitely long vertical pipe. The flow variables, therefore, consist of the streamwise (downward) velocity  $U(r;t)$ and cell concentration
 $N(r;t)$ as functions of the radial position
 $r$ and the time
 $t$. Following Fung et al. (Reference Fung, Bearon and Hwang2020), the equations of motion are given by
 \begin{gather} \frac{\partial U}{\partial t}=- G+\frac{1}{Re}\frac{1}{r}\frac{\partial }{\partial r} {\left(r \frac{\partial U}{\partial r} \right)}+Ri (N-1), \end{gather}
 \begin{gather} \frac{\partial N}{\partial t}=-\frac{1}{r}\frac{\partial }{\partial r}(r N \langle e_{r} \rangle)+\frac{1}{D_R}\frac{1}{r}\frac{\partial }{\partial r}\left(r {D}_{rr} \frac{\partial N}{\partial r}\right), \end{gather}
with the boundary conditions and compatibility conditions:
 \begin{equation} U(1) = 0, \quad \left. \left[\langle e_{r} \rangle N-\frac{{D}_{rr}}{D_R}\frac{\partial N}{\partial r} \right] \right|_{r=1} = 0, \quad \left. \frac{\partial U}{\partial r} \right|_{r=0} = 0, \left. \quad \frac{\partial N}{\partial r} \right|_{r=0} = 0. \end{equation}
Here, the equations have been non-dimensionalised by the radius of the pipe  $h^*$, the cell swimming speed
 $V_s^*$ and the averaged cell concentration
 $N^*$. The dimensionless parameters of interest are
 \begin{equation} Ri= \frac{\displaystyle N^* v^* g'^*h^*}{\displaystyle V_c^{*2}}, \quad Re=\frac{\displaystyle V_c^*h^*}{\displaystyle \nu^*}, \quad \lambda=\frac{\displaystyle 1}{\displaystyle 2 B^* D_R^*}, \quad D_R=\frac{D_R^* h^*}{V_c^*}, \end{equation}
where  $Re$ is the Reynolds number,
 $Ri$ the Richardson number,
 $\lambda$ the inverse of the gyrotactic time scale normalised by rotational diffusivity and
 $D_R$ the dimensionless rotational diffusivity, sometimes also known as the swimming Péclet number. Here,
 $\nu ^*$ is the kinematic viscosity of the fluid,
 $v^*$ the cell volume,
 $g'^*$ the reduced gravity,
 $B^*$ the gyrotactic time scale and
 $D_R^*$ the isotropic rotational diffusivity, which models the randomness in the rotational motion of swimmers. Also,
 $G={\partial p/\partial z -Ri}$ is the dimensionless driving pressure gradient that excludes the hydrostatic pressure from the negative buoyant cells. As mentioned in § 1, the net cell swimming
 $\langle e_{r} \rangle$ and effective cell diffusivity
 $D_{rr}$ in the radial direction are modelled using the GTD theory. Hence,
 $\langle e_{r} \rangle$ and
 $D_{rr}$ are functions of the local shear rate
 $S=-\partial _r U /D_R$, the strength of gyrotaxis (
 $\lambda$) and rotational diffusion (
 $D_R$). The shear rate
 $S$ is sometimes known as the rotary Péclet number (Hinch & Leal Reference Hinch and Leal1972). Since the total number of cells is preserved over the given control volume, we impose the normalisation condition for the cell concentration,
 \begin{equation} \int_0^1 N(r;t) r\,\textrm{d}r=\tfrac{1}{2}. \end{equation}
Unlike a stationary suspension, the current set-up allows for a net axial flow rate. Therefore, there is an extra degree of freedom, which can be specified either by the pressure gradient  $G$ or by the flow rate
 $Q$ given by
 \begin{equation} \int_0^1 U(r;t) r\,\textrm{d}r=\frac{Q}{2 {\rm \pi}}. \end{equation}
If  $Q$ is prescribed, then the pressure gradient is obtained as
 $G=(2/Re) \partial _r U|_{r=1}$.
Lastly, the steady version of (2.1) can be further simplified into
 \begin{equation} N(r)= N(0) \exp \left(D_R \int_0^r \frac{\langle e_{r} \rangle}{D_{rr}}\,\textrm{d}r\right) \end{equation}
and
 \begin{equation} -\frac{1}{Re}\mathcal{D}^2{U}= Ri \left(N(0) \exp \left(D_R \int_0^r \frac{\langle e_{r} \rangle}{D_{rr}} \,\textrm{d}r\right)-1\right)- G, \end{equation}
where  $N(0)$ is determined by (2.3) and
 $G$ is determined by (2.4). Here, we denote the radial Laplace operator by
 $\mathcal {D}^2=(1/r) \partial _r (r \partial _r)$.
3. Numerical solutions
Following the same approach as Fung et al. (Reference Fung, Bearon and Hwang2020, § 2.6), we solve for the steady solution to (2.1) numerically, where the  $r$ dependence is discretised using a Chebyshev collocation method. After that, the resulting algebraic equations are solved using a Newton–Raphson method. The computation is performed with the number of nodes
 $N_r=250$. Numerical convergence is achieved, as the numerical results only differ from those of
 $N_r=175$ by
 $0.2\,\%$ on average. We then perform a pseudo-arclength continuation of the solutions by varying
 $Ri$ but at a fixed flow rate
 $Q$. The values of all parameters are taken from table 2 of Fung et al. (Reference Fung, Bearon and Hwang2020), which will not be repeated here for brevity. In Fung et al. (Reference Fung, Bearon and Hwang2020, § 3.1 and figure 2), we have briefly shown that there exist multiple branches of solutions at each
 $Q$ as long as
 $Q$ is near zero. Here, the same bifurcation diagram, but with a larger range of
 $Ri$ and
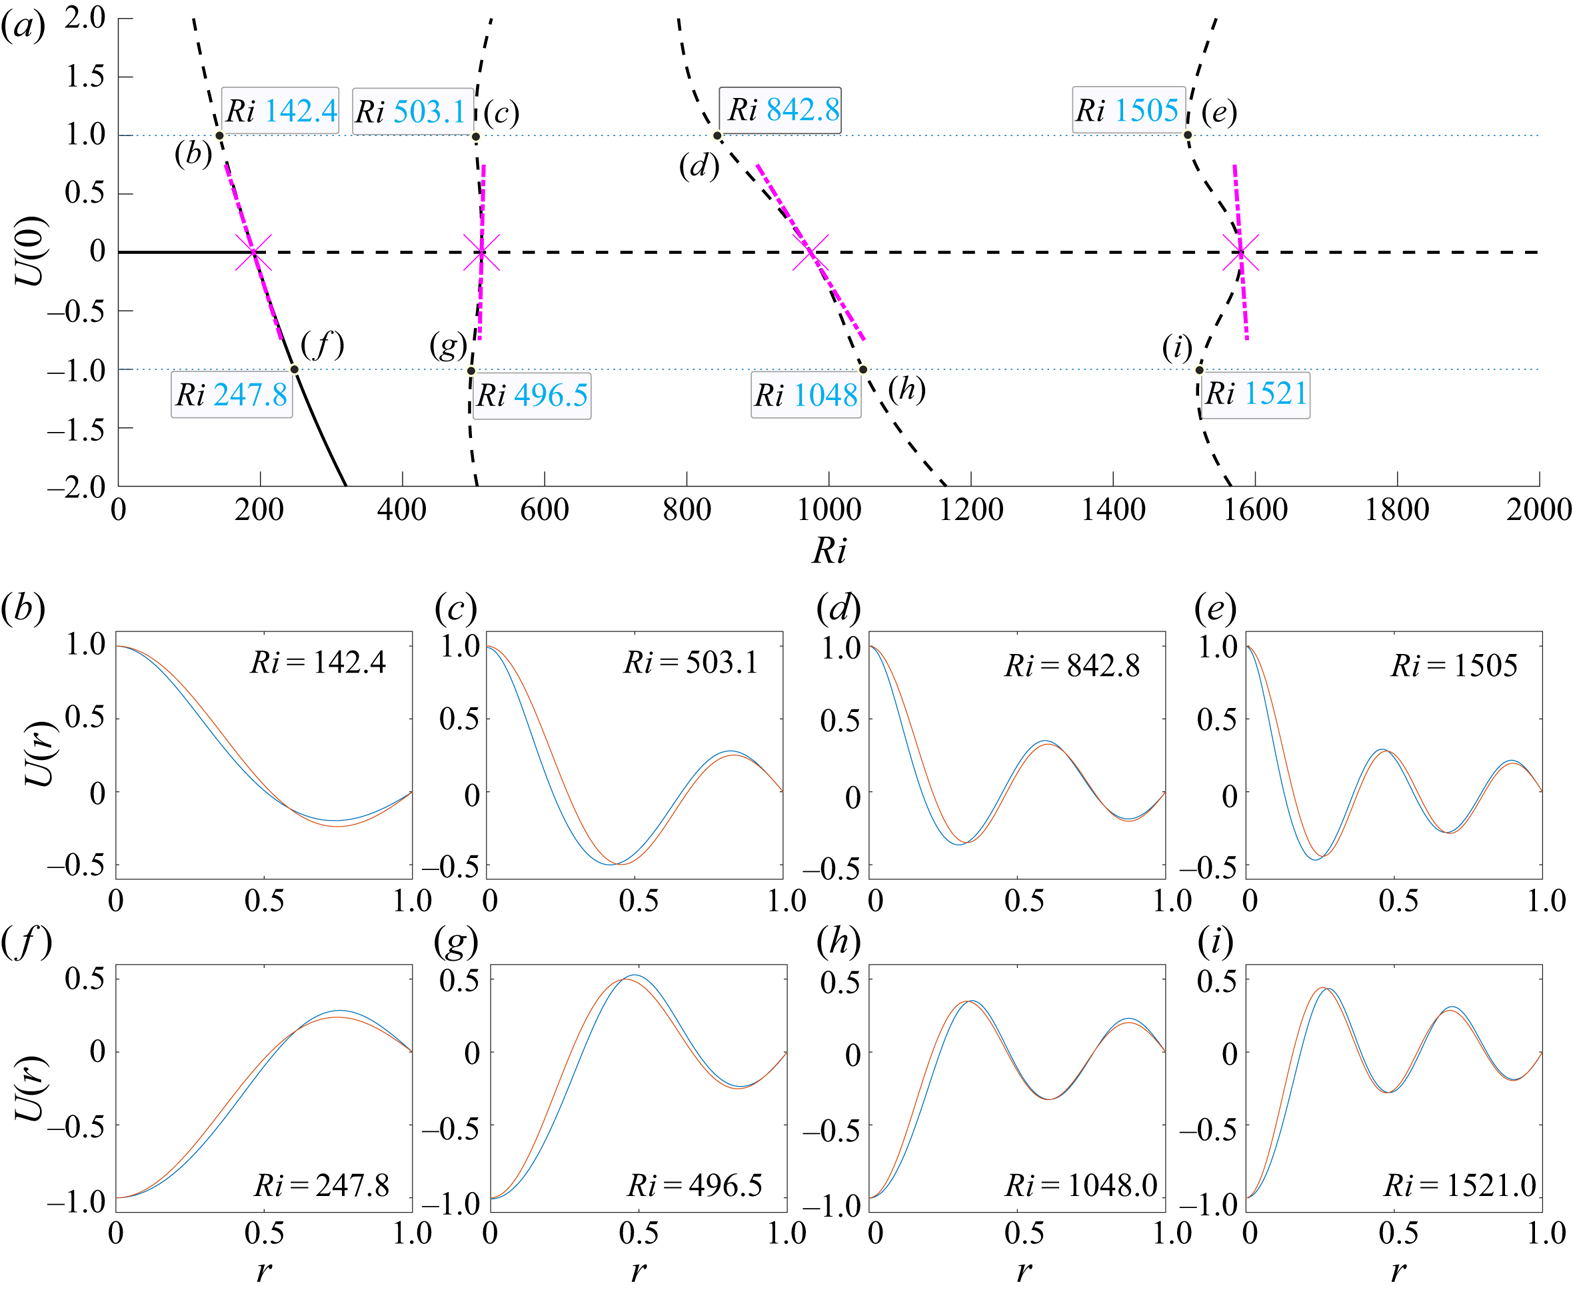
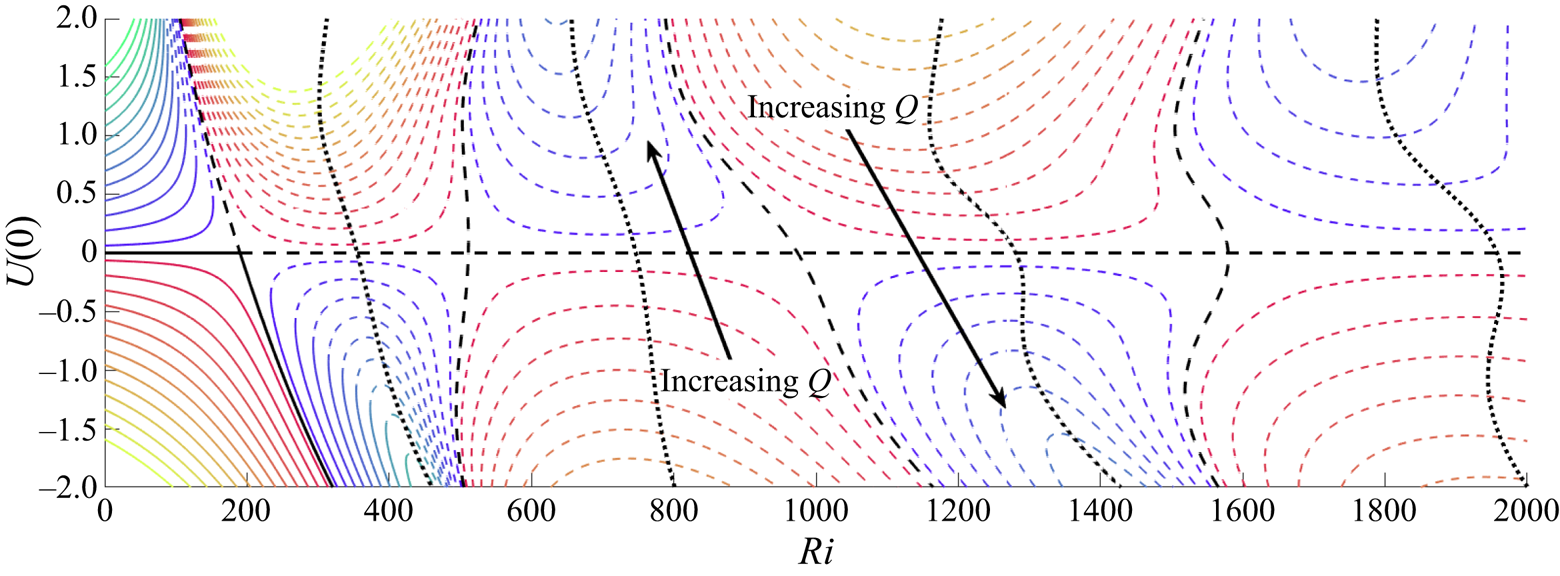
 $Q$, is presented. In figures 1(a) and 2, the axial velocity
 $U(0)$ is used to represent the state of the steady solutions. Figure 1(a) shows how the solution from (2.5) changes with
 $Ri$ at
 $Q=0$, while figure 2 shows the same at other
 $Q$ in the range
 $[-2.5,2.5]$. We have also plotted some of the steady solutions
 $U(r)$ when
 $|U(0)|=1$ and
 $Q=0$ in figure 1(
 $b$–
 $i$, blue lines), for reasons that will become apparent later in § 4.1. The respective value of
 $Ri$ for each
 $U(r)$ can be found in each panel of figure 1(
 $b$–
 $i$), as well as figure 1(a).
Comparison between numerical solutions of (2.5) and the linear and weakly nonlinear analysis in § 4.  $(a)$ Bifurcation diagram (
 $U(0)$ against
 $Ri$) of the
 $Q=0$ solutions from (2.5). Here, the line type represents the stability of the solution:
 , stable;
 , unstable. The bifurcation point (
 $Ri_{c,n}$) from (4.5) is denoted by magenta crosses (
 $\times$), while the slope of the bifurcation curve calculated from (4.8) is indicated by the short magenta dot-dashed segment (
 ). The dotted blue lines (
 ), representing
 $U(0)=\pm 1$, are added to locate the
 $Ri$ values for (
 $b$–
 $i$). (
 $b$–
 $i$) Comparisons between the nonlinear steady solution (blue lines) and the corresponding (appropriately normalised) linear instability mode
 $\hat {u}(r)$ at
 $Q=0$ and
 $Ri$ as indicated in
 $(a)$.

Contours of  $U(0)$ against
 $Ri$ at each given
 $Q \in [-2.5,2.5]$. Here, each contour line in the
 $U(0)$–
 $Ri$ plane indicates the value of
 $Q$: black,
 $Q=0$; blue to green,
 $Q \in [0.1,2.5]$ with
 $0.2$ increment; red to yellow,
 $Q \in [-2.5,-0.1]$ with
 $-0.2$ increment. The line type represents the stability of the solution:
 , stable;
 , unstable. The thick dotted black lines (
 ) show the bifurcation by varying
 $Q$ for given
 $G=0$ (see § 5).

Focusing on  $Q=0$, from figure 1(a), it is apparent that there exist multiple branches of steady solutions other than the uniform-suspension solution represented by
 $U(0)=0$. In fact, as we increase
 $Ri$, there seems to be a countable but infinite number of branches emerging via a sequence of transcritical bifurcations. Each branch coincides with the uniform suspension at a certain
 $Ri$, which forms the bifurcation point. We shall define
 $Ri_{c,n}$ as the Richardson number of each bifurcation point from the left in figure 1(a), where
 $n$ is the index. For convenience, we shall also index the
 $Q=0$ branches accordingly too. For example, the first bifurcation at
 $Ri\ (=Ri_{c,1} \approx 190)$ is connected to the first
 $Q=0$ branch (see the black line crossing the leftmost
 $Ri_c$ in figure 1a). At each bifurcation point, there is also an exchange of stability, as we examine the stability of the solution near each bifurcation (see § 4.1). However, except for the first bifurcation, the stability exchange takes place not with the most unstable mode but with a less unstable one. When a small downflow or upflow is applied (i.e.
 $Q \neq 0$), each transcritical bifurcation point turns into a saddle-node point via an imperfect bifurcation. This is similar to the finding of Fung et al. (Reference Fung, Bearon and Hwang2020) for the first branch solution, but the same happens to all the other branches.
4. The origin of an infinite number of solution branches
In this section, we will examine the linear stability of a uniform suspension in the vertical pipe. We will further restrict the perturbation to be axisymmetric, parallel and axially uniform, given the nature of the solutions of interest. To be consistent with our numerical results in § 3 and figure 1(a), in this section we will fix the flow rate when adding the perturbation, i.e.  $Q=0$. We will demonstrate that the multiple transcritical bifurcations of the computed solutions are the result of the pipe geometry, which also confines the suspension in a domain with finite horizontal extent. We will then extend it to the weakly nonlinear regime, similarly to previous work by Bees & Hill (Reference Bees and Hill1999). The resulting amplitude equation demonstrates that all the bifurcations in figure 1(a) are indeed transcritical.
4.1. Linear stability analysis
We first consider a perturbation to the stationary uniform suspension in a cylindrical pipe with infinite depth, i.e.  $U=\epsilon u_1(r,t)+\epsilon ^2 u_2(r,t)+O(\epsilon ^3)$ and
 $N=1+\epsilon n_1(r,t)+\epsilon ^2 n_2(r,t)+O(\epsilon ^3)$. Given that
 $\langle e_{r} \rangle (S)$ is odd and
 $D_{rr}(S)$ is even with respect to the radial shear rate
 $S$, this yields
 \begin{align} \langle e_{r} \rangle=\epsilon\beta \frac{\partial u_1}{\partial r}+\epsilon^2\beta \frac{\partial u_2}{\partial r}+{\textit{O}}(\epsilon^3) \quad \!\text{and}\! \quad \frac{D_{rr}}{D_R}=D+\left.\frac{\epsilon^2}{2 D_R^3}\frac{\partial^2 D_{rr}}{\partial S^2}\right|_{S=0} \left(\frac{\partial u_1}{\partial r}\right)^2+{\textit{O}}(\epsilon^3), \end{align}
where  $\beta =-(\partial _S \langle e_{r} \rangle |_{S=0})/D_R$ and
 $D=D_{rr}|_{S=0}/D_R$ are constants that depend only on
 $D_R$ and
 $\lambda$. We also note that
 $\beta /D=\lambda /2$ (see Bearon et al. Reference Bearon, Bees and Croze2012). At
 $\textit{O}(\epsilon )$, the perturbed equations for linear stability are then obtained as
 \begin{equation} \frac{\partial u_1}{\partial t}=\frac{1}{Re}\mathcal{D}^2 u_1+Ri\ n_1- {G_1} \end{equation}
and
 \begin{equation} \frac{\partial n_1}{\partial t}=-\beta \mathcal{D}^2 u_1+D \mathcal{D}^2 n_1, \end{equation}
with boundary conditions
 \begin{equation} u_1(1) = 0, \quad \left. \left[\beta \frac{\partial u_1}{\partial r}-D\frac{\partial n_1}{\partial r} \right] \right|_{r=1} = 0. \end{equation}
Because we have fixed  $Q=0$, the perturbed pressure gradient
 $G_1$ is found such that the flow rate is not altered by the perturbation, i.e.
 \begin{equation} \int_0^1 u_1 r\,\textrm{d}r=0. \end{equation}
While (4.2) can be solved numerically, we shall proceed to focus on the special case when one of the stability modes is neutrally stable. Introducing a neutrally stable and stationary normal mode (i.e.  $u_1(r,t)=\hat {u}(r)$ and
 $n_1(r,t)=\hat {n}(r)$), (4.2) is then simplified into a single equation:
 \begin{equation} \mathcal{D}^2 \hat{u} +\kappa^2 \hat{u}=G_1, \end{equation}
where  $\kappa ^2= Ri\,Re\,\beta /D= Ri\,Re\,\lambda /2$. The left-hand side of (4.3) is the Bessel differential equation, which admits the Fourier–Bessel series as solutions. Substituting the boundary conditions, the mode shapes of
 $\hat {u}(r)$ should take the form
 \begin{equation} \hat{u}(r)=\frac{G_1}{\kappa^2}\left( 1- \frac{{\rm J}_0(\kappa r)}{{\rm J}_0(\kappa)} \right), \end{equation}
where  ${\rm J}_m(r)$ is the
 $m$th Bessel function of the first kind. Enforcement of (4.2d) into (4.4) subsequently leads to an infinite number of discrete values of
 $\kappa \ (=\kappa _{c{,n}})$ satisfying
 ${\rm J}_2(\kappa _{c,n})=0$, at which (4.4) becomes a neutrally stable solution to (4.2). Here,
 $n$ indicates the
 $n$th zeros of
 ${\rm J}_2(r)$. In this case,
 $G_1$ in (4.4) becomes an arbitrary real constant, as (4.2d) is satisfied for any
 $G_1$. The values of
 $\kappa _{c{,n}}$ also yield the critical values of
 \begin{equation} Ri_{c{,n}}=2\kappa_{c{,n}}^2/(Re\,\lambda) \end{equation}
for the neutral stability of each mode. These values of  $Ri_{c{,n}}$ calculated from
 $\kappa _{c,n}$ match perfectly with the bifurcation points computed numerically in the previous section, as shown in figure 1(a). Finally, it should be mentioned that (4.5) is equivalent to (3.14) in Pedley et al. (Reference Pedley, Hill and Kessler1988) and (31) in Bees & Hill (Reference Bees and Hill1999), where a continuous set of the critical values of the parameters equivalent to
 $Ri$ and
 $\kappa$ are obtained from linear stability analysis. However, in the present study, the introduction of a finite domain in the radial direction results in discrete values of
 $\kappa _{c{,n}}$ and
 $Ri_{c{,n}}$ with the corresponding eigenmode in the form of a cylindrical harmonic (i.e. Bessel functions) that satisfies the given boundary conditions.
4.2. Weakly nonlinear analysis
We further proceed to perform a weakly nonlinear analysis close to  $Ri_{c{,n}}$. In the previous study by Bees & Hill (Reference Bees and Hill1999), where a uniform suspension is considered in an unbounded domain, it was assumed that the leading nonlinear term would appear at the third order due to translational invariance of the suspension in the horizontal direction. However, in the present study, such invariance is broken due to the pipe's cylindrical geometry. Hence, there is no reason that the leading nonlinear term would emerge at the third order. In this study, we therefore start by assuming
 $Ri-Ri_{c{,n}}=\epsilon {\rm \Delta} Ri$ (
 ${\rm \Delta} Ri$ is the normalised distance from the bifurcation point) with a slow time scale
 $T=\epsilon t$. Given the perturbation form introduced in § 4.1, at
 $\textit{O}(\epsilon ^2)$, we get
 \begin{equation} \partial_T u_1-{\rm \Delta} Ri \, n_1 = -\partial_t u_2-G_2 + \frac{1}{Re} \mathcal{D}^2 u_2 +Ri_{c{,n}} \, n_2, \end{equation}
where  $G_2=(2/Re) u_2'(1)$ and
 \begin{equation} \partial_T n_1+\beta \frac{1}{r}\partial_r ( r(\partial_r u_1) n_1 ) = -\partial_t n_2-\beta \mathcal{D}^2 u_2 + D \mathcal{D}^2n_2. \end{equation}
We also introduce amplitude  $A(T)$ for the linear perturbation:
 \begin{equation} u_1(r,t,T)=A(T)\hat{u}(r),\quad n_1(r,t,T)=A(T)\hat{n}(r), \end{equation}
where the linear instability mode is normalised to be  $\hat {u}(0)=1$. Following the procedure of a weakly nonlinear analysis (e.g. Drazin Reference Drazin2002), we apply the solvability condition to (4.6) using the adjoint of (4.2). After some simplifications, we arrive at the amplitude equation
 \begin{equation} \left(C-\frac{F}{D\, Re} \right)\partial_T A- \frac{\lambda}{2} C {\rm \Delta} Ri\,A -\frac{\lambda E}{2 Re} A^2=0, \end{equation}
where  $C$,
 $E$ and
 $F$ are defined in appendix A. Now, given the quadratic nonlinearity in (4.8), it is clear that all the bifurcations in figure 1(a) are transcritical. We have also computed the slopes of the non-trivial branches in figure 1(a), which are given by
 $-C\, Re/E$, when they cross each bifurcation point. As shown by the dot-dashed lines in figure 1(a), the computed slopes match with those of the numerically computed nonlinear solutions perfectly at the bifurcation points.
Finally, the neutrally stable eigenmodes (4.4) used for the weakly nonlinear analysis (red line, with appropriate sign) are compared with the numerical solutions (blue line) around each bifurcation point (at  $U(0)={\pm }1$) in figure 1. As expected, there is excellent agreement between them.
5. Existence of steady solution
As previously noted by Hwang & Pedley (Reference Hwang and Pedley2014) and Fung et al. (Reference Fung, Bearon and Hwang2020), there are three parameters  $Q$,
 $G$ and
 $Ri$ that control the bifurcation of (2.1). Here,
 $Q$ and
 $G$ are dependent on each other, providing only two degrees of freedom in total. Now, without loss of generality, we shall vary the three parameters
 $Q$,
 $G$ and
 $Ri$ in a controlled manner to explore the existence of the steady solutions reported in § 3. We first prescribe
 $G$ and continue the steady solutions to (2.1) by changing
 $Q$ – the related bifurcation diagrams for
 $G=0$ are also shown in figure 2 (dotted lines). Here, we note that the change of
 $Q$ for a given
 $G$ requires a change of
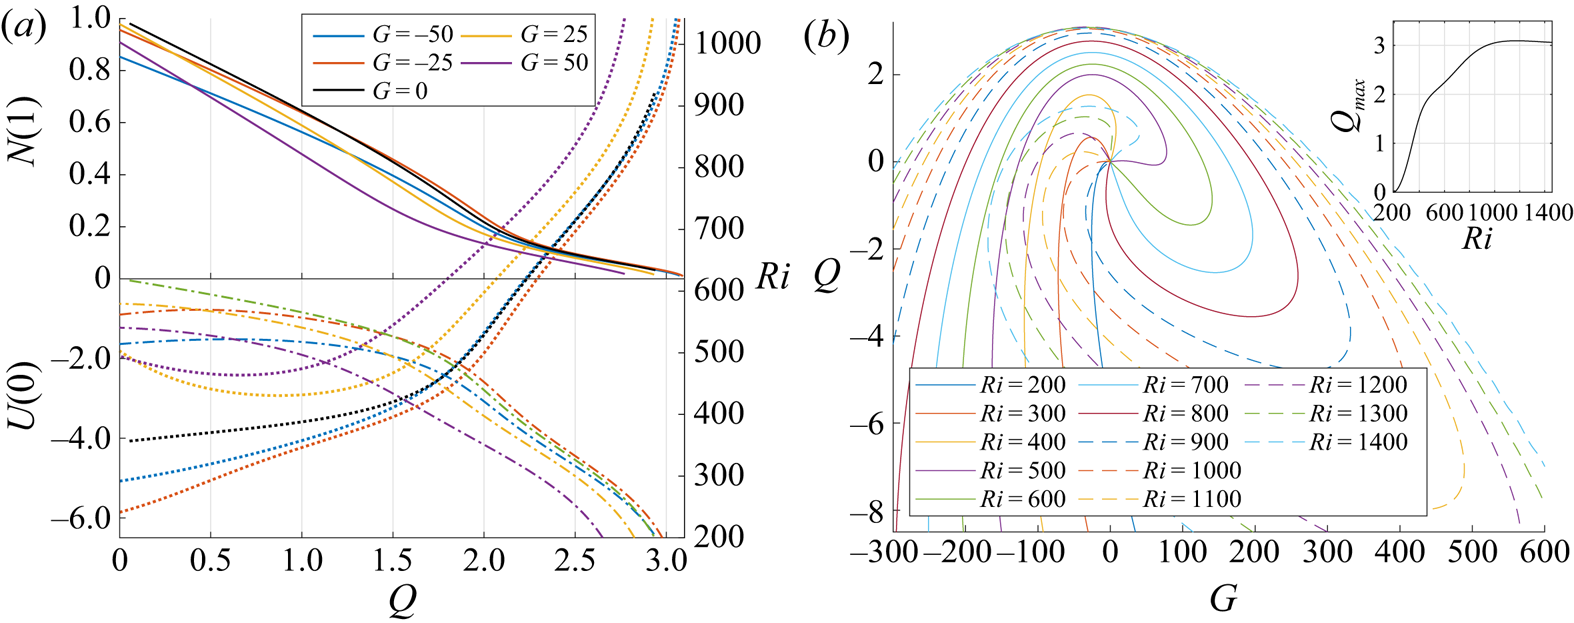
 $Ri$, given the relation of the three parameters. Figure 3(a) shows how
 $U(0)$,
 $Ri$ and
 $N(1)$ change with
 $Q$ for several prescribed
 $G$. It is found that all the solutions blow up at a certain respective threshold of
 $Q$ (say
 $Q_{c,G}(G)$): as
 $Q \rightarrow Q_{c,G}(G)$,
 $U(0)$ and
 $Ri$ blow up and
 $N(1)$ approaches zero (i.e. depletion of the cell number density at the wall).
Continuations of the steady solution emerged from the first bifurcation point with  $U(0)<0$.
 $(a)$ Plots of
 $U(0)$ (
 ),
 $Ri$ (
 ) and
 $N(1)$ (
 ) for several
 $G$ on increasing
 $Q$ from
 $0$.
 $(b)$ The relation between
 $G$ and
 $Q$ for several fixed
 $Ri$. Inset: the maximum achievable flow rate
 $Q_{max}$ plotted for each
 $Ri$.

To further explain the existence of a threshold value of  $Q$, we also perform continuation by changing
 $G$ for prescribed
 $Ri$. Figure 3(b) shows the continuation of the first two steady solution branches reported in figure 1(a) for fixed
 $Ri\in [200,1400]$. Now, it becomes apparent that there exists a maximum achievable
 $Q\ (\equiv Q_{max,Ri}(Ri))$ at each
 $Ri$. Plotting
 $Q_{max,Ri}(Ri)$ against
 $Ri$ (inset in figure 3b) shows that
 $Q_{max,Ri}$ reaches its maximum at
 $Q_{max} \approx 3.1$ and
 $Ri \approx 1174$. The maximum downward flow rate
 $Q_{max}\ (>0)$ is typically achieved with a downward pressure gradient (
 $G<0$) (i.e.
 $Q_{max}=\max (Q_{c,G}(G))$ in figure 3a). However, any further decrease of
 $G$ counter-intuitively decreases, rather than increases, the flow rate of the steady solution.
Lastly, we note that figure 3 is only for the first and second solution branches that emerge from  $Q=0$ in figure 1(a). However, the same qualitative behaviours have been found from all the other solution branches: for example, the relation between
 $N(1)$ and
 $Q$, the blow-up of
 $U(0)$ and
 $Ri$ as
 $Q\rightarrow Q_{c,G}$, and the existence of
 $Q_{max}$.
6. Conclusion and discussion
In this study, we have sought the nonlinear, steady and axisymmetric solutions for a suspension of gyrotactic swimmers in an infinitely long pipe. An infinite number of steady solutions have been found. Each of them stems from a transcritical bifurcation on the uniform solution. The exact values of the bifurcation points have also been found by solving the linearised equations for neutral stability.
Comparing the present study with Bees & Hill (Reference Bees and Hill1999), who showed the existence of an uncountably infinite number of solutions to a similar set of equations in an unbounded domain, we can conclude that the countably infinite number of transcritical bifurcations originates from the finite horizontal domain and the flow geometry (i.e. pipe). Firstly, the finite horizontal domain yields discrete eigenvalues from the equations for the linear stability (4.2), making  $(\kappa _{c{,n}},Ri_{c{,n}})$ a discrete set rather than a continuous curve. Hence we have a countably infinite number of bifurcation points. Secondly, the cylindrical geometry of the pipe breaks the translational invariance in the horizontal direction. In an unbounded domain, such invariance of uniform suspension is broken by the primary bifurcation (i.e. pitchfork bifurcation (see Bees & Hill Reference Bees and Hill1999)). However, in the pipe, the primary bifurcation takes place in a circumstance where the translational invariance is already broken by the flow geometry, which leads the primary bifurcation to be transcritical instead.
The existence of many steady solutions has also hinted at the possible dynamical route from a uniform suspension to the gyrotactic pattern. Except for the first branch, all the other steady solution branches found in figure 1(a) are saddles in the state space. In other words, if a stationary and uniform suspension at  $Ri>Ri_{c{,n}}$ is perturbed with the
 $n$th most linearly unstable mode from (4.4), the system would first evolve towards the corresponding nonlinear steady solution. Therefore, the flow patterns related to the unstable solutions in the present study may well be observed at least transiently, before further development of the flow state or its breakdown in the axial and/or azimuthal directions. Indeed, early numerical simulations by Ghorai & Hill (Reference Ghorai and Hill1999, Reference Ghorai and Hill2000) found such a transient dynamics, which strongly hinted at the dynamical importance of the initial perturbation. Furthermore, the increasing number of nonlinear steady solutions and linearly unstable mode as
 $Ri$ increases strongly hinted at the increasing complexity of the system as
 $Ri$ increases.
Finally, the emergence of multiple axisymmetric steady solutions with increasing  $Ri$ implies that similar solutions may well exist for non-axisymmetric case. This implies that the route to the final flow pattern would be a highly complicated process, involving competition between the axisymmetric and non-axisymmetric states. Furthermore, it should also be pointed out that all these axially uniform steady solutions are unstable to axially varying perturbations (Fung et al. Reference Fung, Bearon and Hwang2020). To this end, there is an ongoing investigation to address these issues.
Acknowledgements
This work is funded by the President's PhD Scholarship of Imperial College London.
Declaration of interests
The authors report no conflict of interest.
Appendix A. Weakly nonlinear analysis
Here, the full expressions for  $C$,
 $E$ and
 $F$ in § 4.2 are derived. We define
 \begin{equation} f(r)=\left.\left(1-\frac{{\rm J}_0(\kappa_c r)}{{\rm J}_0(\kappa_c)} \right) \right/ \left( 1-\frac{1}{{\rm J}_0(\kappa_c)}\right), \end{equation}
such that the normalised first-order velocity profile is  $\hat {u}=f(r)$. The adjoint of
 $\hat {u}$ is the same as
 $\hat {u}$. Now,
 $\hat {n}=\lambda \hat {u}/2$, but the adjoint of
 $\hat {n}$ is
 $-(\beta \,Re)^{-1}g(r)$, where
 $g(r)$ is
 \begin{equation} g(r)= \left.\left({\rm J}_0(\kappa_c r)-{\rm J}_0(\kappa_c) +\frac{r^2-1}{2}\kappa_c {\rm J}_1(\kappa_c) \right) \right/ \left( {\rm J}_0(\kappa_c)-1\right). \end{equation}
From the solvability condition, we arrive at (4.8), in which the constants  $C$,
 $E$ and
 $F$ are dependent on
 $\kappa _c$ and are defined by
 \begin{gather} C=\int_0^1f(r)^2r\,\textrm{d}r=\frac{\kappa_c^2}{8}\left( 1-\frac{1}{{\rm J}_0(\kappa_c)}\right)^{-2}, \end{gather}
 \begin{gather} E = \int_0^1 g(r) \partial_r\left[rf'(r)f(r)\right]\,\textrm{d}r, \end{gather}
 \begin{gather} F=\int_0^1f(r)g(r)r\,\textrm{d}r=-\frac{-3 \kappa_c^2}{16} \left( 1-\frac{1}{{\rm J}_0(\kappa_c)}\right)^{-2}. \end{gather}
While  $C$ and
 $F$ are found analytically,
 $E$ is numerically integrated owing to the complexity of the Bessel function. The numerical values of
 $-C\,Re/E$ are plotted as the local slopes of the corresponding branch at each bifurcation point in figure 1(a).