





1. Introduction
Phoretic mechanisms are widely used to actuate transport, be it externally mediated, e.g. by chemo- or electrophoresis, or self-generated: at macroscopic scales, phoresis can drive living organisms and culinary Marangoni cocktails (Mathijssen et al. Reference Mathijssen, Lisicki, Prakash and Mossige2022), and in microfluidic environments it can power self-propelled microswimmers like active colloids or droplets (Peddireddy et al. Reference Peddireddy, Kumar, Thutupalli, Herminghaus and Bahr2012; Herminghaus et al. Reference Herminghaus, Maass, Krüger, Thutupalli, Goehring and Bahr2014; Izri et al. Reference Izri, van der Linden, Michelin and Dauchot2014; Maass et al. Reference Maass, Krüger, Herminghaus and Bahr2016; Babu et al. Reference Babu, Katsonis, Lancia, Plamont and Ryabchun2022; Birrer, Cheon & Zarzar Reference Birrer, Cheon and Zarzar2022; Dwivedi, Pillai & Mangal Reference Dwivedi, Pillai and Mangal2022; Michelin Reference Michelin2023), or self-driven micropumps for nutrient or fuel mixing and advection in artificial and biological systems (Gilpin, Prakash & Prakash Reference Gilpin, Prakash and Prakash2017b; Yu et al. Reference Yu, Athanassiadis, Popescu, Chikkadi, Güth, Singh, Qiu and Fischer2020; Antunes et al. Reference Antunes, Malgaretti, Harting and Dietrich2022). In self-actuated systems, fluid transport is induced through non-equilibrium processes at the interface between the particle and the surrounding fluid where a slip velocity and/or tangential stresses are generated (Anderson Reference Anderson1989). Various phoretic mechanisms have been reported based on the type of interactions between the particle and the ambient fluid. Regardless of the type of activity, all mechanisms rely on the inhomogeneity of a surrounding field such as gradients in solute concentration (Golestanian, Liverpool & Ajdari Reference Golestanian, Liverpool and Ajdari2005), temperature (Young, Goldstein & Block Reference Young, Goldstein and Block1959) and electric fields (Bazant & Squires Reference Bazant and Squires2004).
In the specific case of a self-driven chemically active particle or droplet, the net motion is achieved by converting chemical free energy released by the agent into mechanical work through two distinct mechanisms: the diffusiophoretic effect, introducing a finite slip velocity at the agent interface, and the Marangoni effect, creating interfacial tangential stresses. In this context, we define activity as the conversion of undirected, chemical kinetics into mesoscopic advective flow, either driving pumping motion or a translation of the particle itself.
Reactivity gradients can be implemented by design, i.e. a built-in asymmetry, for instance by variation of the coating thickness for Janus particles (Ebbens et al. Reference Ebbens, Gregory, Dunderdale, Howse, Ibrahim, Liverpool and Golestanian2014; Campbell et al. Reference Campbell, Ebbens, Illien and Golestanian2019), in binary systems of interacting particle pairs (Reigh & Kapral Reference Reigh and Kapral2015; Reigh et al. Reference Reigh, Chuphal, Thakur and Kapral2018) or in droplets with adsorbed colloidal caps (Ik Cheon et al. Reference Ik Cheon, Capaverde Silva, Khair and Zarzar2021). However, starting from a spherically isotropic particle, the only viable route to generate an interfacial reactivity gradient is by interaction with the chemical products. Chemically active droplets are among the prime model systems studied in this context. Here, an advection–diffusion instability in the chemical field around the droplet interface causes interfacial flow modes, ranging, with increasing Péclet number  $Pe$ and mode number
 $n$, from an inactive isotropic (
 $n=0$) base state over a dipolar state that is propulsive in motile droplets (
 $n=1$), to higher-order extensile modes, most importantly a non-propulsive quadrupolar mode for
 $n=2$ (Michelin, Lauga & Bartolo Reference Michelin, Lauga and Bartolo2013; Izri et al. Reference Izri, van der Linden, Michelin and Dauchot2014; Morozov & Michelin Reference Morozov and Michelin2019). This emergence of higher interfacial modes and increasingly complex mesoscopic droplet motion with increasing
 $Pe$ has been found to be quite general in experiments, irrespective of whether
 $Pe$ is varied by way of chemical activity, droplet size or viscosity (Izzet et al. Reference Izzet, Moerman, Gross, Groenewold, Hollingsworth, Bibette and Brujic2020; Hokmabad et al. Reference Hokmabad, Dey, Jalaal, Mohanty, Almukambetova, Baldwin, Lohse and Maass2021, Reference Hokmabad, Nishide, Ramesh, Krüger and Maass2022b; Suda et al. Reference Suda, Suda, Ohmura and Ichikawa2021).
It was shown in the canonical model of Michelin et al. (Reference Michelin, Lauga and Bartolo2013) and subsequent works that the most general prerequisite to set this advection–diffusion activity into motion is simply the consumption of a single chemical species at a constant rate at the interface. However, experimental realisations typically require more complicated chemical pathways. A popular model system consists of oil-in-water (alternatively, water-in-oil) emulsions in which the outer phase contains fuel supplied by a surfactant at supramicellar concentrations (Herminghaus et al. Reference Herminghaus, Maass, Krüger, Thutupalli, Goehring and Bahr2014; Izri et al. Reference Izri, van der Linden, Michelin and Dauchot2014; Izzet et al. Reference Izzet, Moerman, Gross, Groenewold, Hollingsworth, Bibette and Brujic2020; Meredith et al. Reference Meredith, Moerman, Groenewold, Chiu, Kegel, van Blaaderen and Zarzar2020; Suda et al. Reference Suda, Suda, Ohmura and Ichikawa2021). Here, the oil phase continuously solubilises by migrating from the bulk droplet into empty or partially saturated surfactant micelles, leading to an interfacial Marangoni gradient that powers a self-supporting active interface (figure 1a).
(a) Schematic of droplet propulsion mechanism and a zoomed in region around the droplet interface showing surfactant monomers, empty micelles and oil-filled micelles. (b) Schematic of the dual-channel microscopy set-up simultaneously visualising flow fields (camera 1) using fluorescent tracers and filled micelle concentration (camera 2) using Nile red dye in the oil droplet. (c) Illustration of a small, spherical self-propelling droplet vs a larger droplet immobilised by squeezing it between the glass top and bottom of the cell. (d) Emission from fluorescent tracers (top) and Nile red (bottom). Scale bar: 50  $\mathrm {\mu }$m.

Surfactant micelles and monomers constitute distinct species that diffuse at significantly different time scales, and these complex kinetics have been found to affect the details of the observed dynamics. Experimental examples include the emergence of bimodal motility through micellar accumulation at hydrodynamic stagnation points (Hokmabad et al. Reference Hokmabad, Dey, Jalaal, Mohanty, Almukambetova, Baldwin, Lohse and Maass2021), or trail avoidance stemming from chemotactic repulsion by long-lived chemical traces of other droplets (Jin, Krüger & Maass Reference Jin, Krüger and Maass2017; Moerman et al. Reference Moerman, Moyses, van der Wee, Grier, van Blaaderen, Kegel, Groenewold and Brujic2017; Izzet et al. Reference Izzet, Moerman, Gross, Groenewold, Hollingsworth, Bibette and Brujic2020; Lippera, Benzaquen & Michelin Reference Lippera, Benzaquen and Michelin2020a; Lippera et al. Reference Lippera, Morozov, Benzaquen and Michelin2020b; Hokmabad et al. Reference Hokmabad, Agudo-Canalejo, Saha, Golestanian and Maass2022a). Current analytical and numerical work is looking beyond the one-species approximation, e.g. considering inhibitory effects of oil-filled micelles (Morozov Reference Morozov2020), necessitating coupled advection–diffusion equations for species (large micelles vs monomers) with different individual diffusion time scales and  $Pe$. At the current state of the art, such studies are necessarily constrained by best guesses at the currently unknown molecular dynamics like aggregation kinetics, as well as computational constraints that e.g. limit micellar aggregation numbers below typical values from the experimental literature. Thus, while we see intriguing predictions, e.g. regarding multi-stable states (coexisting different vortex patterns), there is no one-to-one comparison between theory and experiment yet. We therefore require well-controlled experimental paradigms to suggest testable geometries and provide realistic feedback to the assumptions of theory. We propose such a system in the present study on immobilised droplets, or micropumps. Here, one does not have to account for the displacements caused by the often chaotic mesoscopic motion of a motile system. Specifically, immobilisation gives access to steady state experimental conditions that allow for precise, simultaneous measurements of hydrodynamic and chemical fields.
In the experiments presented below, we measure the flow and chemical fields generated by immobilised active droplets. We then perform a hydrodynamic mode decomposition by fitting these flow structures to a version of the squirmer model in a Brinkman medium, which allows for a qualitative analysis of the interfacial flows. We explore  $Pe$ space via changing the droplet radius, analyse steady state and long-term time dependent flow patterns around these immobilised droplets with respect to anterior/posterior symmetry and multistable states and posit hypotheses on how these patterns are shaped by the multispecies chemodynamics of the droplet solubilisation.
2. Methods
2.1. Materials and experimental protocol
Our experimental system consists of (S)-4-Cyano-4’-(2-methylbutyl)biphenyl (CB15, Synthon Chemicals) oil droplets immersed in an aqueous solution of the cationic surfactant tetradecyltrimethylammonium bromide (TTAB, Sigma-Aldrich). We note that, while we have used the nematogen 5CB in some of our previous studies (Krüger et al. Reference Krüger, Bahr, Herminghaus and Maass2016a,Reference Krüger, Klös, Bahr and Maassb), here we are using its branched isomer CB15 (or 5*CB) which is, while being a widely used chiral dopant, isotropic in its pure form at room temperature (Mayer et al. Reference Mayer, Witko, Massalska-Arodz, Williams and Dabrowski1999). The CB15 droplets of different sizes were obtained by shaking. The TTAB surfactant concentration was fixed at 5 wt.% (critical micelle concentration,  $CMC = 0.13$ wt.%). Our experimental reservoir consisted of a SU-8 photoresist spacer layer spin coated on glass, framing a rectangular cell of area
 $13 \times 8\ {\rm mm}^2$ and height of 50
 $\mathrm {\mu }$m fabricated via UV photolithography. We filled the cell with a dilute droplet emulsion and sealed it with a glass cover slip. In our analysis we included droplets with typical radii larger than 50
 $\mathrm {\mu }$m, which were compressed into flat disks of radius
 $a \gtrsim 60\ \mathrm {\mu }$m. These disks were squeezed between the top and bottom of the reservoir and exhibited only non-moving, pumping motion. This immotile state was only stable at relatively low surfactant concentrations (here, 5 wt%), and might either be caused by oil/water/glass contact line pinning, or by short range no-slip interactions in a boundary layer of surfactant and water molecules between oil and the oleophobic glass surface. The droplet shape we observed is a flat cylinder with a convex oil–water interface, as sketched in figure 1(c).
2.2. Double-channel fluorescent microscopy
To simultaneously image chemical and hydrodynamic fields, we have adapted an Olympus IX-83 microscope for dual-channel fluorescent microscopy, as shown in the light path schematic in figure 1(b). The fluorophores were excited using a fluorescence mercury lamp which is passed through a dual band excitation filter  $482/21+563/14$ nm. The oil phase was doped with the co-moving Nile red (Sigma-Aldrich) dye to label oil-filled filled micelles, with an emission peak of 630 nm. The tracer particles (FluoSpheres, yellow–green fluorescent, 0.5
 $\mathrm {\mu }$m in diameter), visualising the fluid flow around the droplet, emit light at a maximum of
 ${\sim }510$ nm. The emission was separated into two channels using a beam splitter and appropriate filters for each emission maximum, and recorded by two 4MP cameras (FLIR Grasshopper 3, GS3-U3-41C6M-C), at 24 fps for the green (tracers) and the red channel (dye) for short-time measurements. Figure 1(d) shows emission from fluorescent tracers (top) and Nile red (bottom). For long-time measurements, we recorded the slowly changing chemical field continuously at a reduced frame rate of 4 fps. To record tracer colloids, a higher frame rate of 24 fps was required. Due to data storage limitations, we did not record continuously for the entire experiment, but recorded 5 s sequences at 30 s intervals. Using 10
 $\times$ and 20
 $\times$ objectives focused on the cell mid-plane, the region of observation spanned 1113
 $\mathrm {\mu }{\rm m}^{2}$ and 557
 $\mathrm {\mu }{\rm m}^{2}$, with a focal depth of 3.06
 $\mathrm {\mu }$m and 1.10
 $\mathrm {\mu }$m, respectively. We therefore assume all extracted flow data to represent the mid-plane values in (
 $x,y$) to good accuracy.
2.3. Image processing and data analysis
We extracted the droplet position and radius  $a$ in ImageJ using the time-averaged signal from the colloidal tracer channel, where the immotile droplet appears as a dark area,
 $A$. We estimate the errors in extracted contour roundness and radius,
 $\Delta a/a$ to be
 $<1\,\%$.
We extracted the flow field around the droplet by particle image velocimetry (PIV) of the tracer particles using the MATLAB-based PIVlab interface (Thielicke & Stamhuis Reference Thielicke and Stamhuis2014), with the droplet area  $A$ used as a mask. For the PIV analysis, we chose a
 $48 \times 48$ pixel interrogation window with
 $67\,\%$ overlap, at a spatial resolution of 0.28
 $\mathrm {\mu }$m px
 $^{-1}$. We then fit the two-dimensional (2-D) flow data generated by this procedure to a hydrodynamic model described below in § 2.4 within the microscope's field of view, using a least-squares fit algorithm. As PIV is unreliable near boundaries, we exclude an expanded area around the droplet, using
 $\rho >1.1a$. We illustrate flow fields in figures 2 and 6, via streak images using a flowtrace algorithm (Gilpin, Prakash & Prakash Reference Gilpin, Prakash and Prakash2017a).
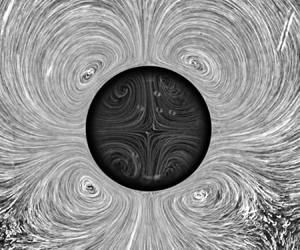
Streak visualisation of flow fields generated by pumping active droplets for increasing droplet radius  $a$, with superimposed streamlines from PIV analysis. We observe a shift of the vortex pair from the droplet posterior to the anterior in the top row, corresponding to
 $a={61}\ \mathrm {\mu }$m,
 $a={80}\ \mathrm {\mu }$m and
 $a={102}\ \mathrm {\mu }$m, and on further increase of
 $a$, a bistable regime between a dipolar (
 $a={185}\ \mathrm {\mu }$m) and a quadrupolar flow mode (
 $a={148}\ \mathrm {\mu }$m). For larger radii, we only see the quadrupolar mode (
 $a={243}\ \mathrm {\mu }$m). See also supplementary material and movies S1 and S2.

For further analysis we required time-dependent chemical and tangential flow fields around the droplet perimeter  $a\theta$ with the polar angle
 $\theta$ taken counter-clockwise from the droplet anterior (see dashed circles in figure 5a,b). The flow data were taken from PIV as close to the droplet as possible, i.e. at
 $\rho =1.1a$. For the chemical field, we used the channel recording the Nile red fluorescence and extracted the intensity from an annular region around
 $A$. Since the chemical signal was oversaturated around
 $A$ due to the high concentration of dye in the droplet itself, we collected fluorescence data at a distance from the interface being
 $\rho =1.22a$. We separately investigated the effects of varying the droplet size on the short-time steady state flow (§ 3.1), as well as time-dependent saturation effects over long-time measurements of the order of 20 min (§ 3.4). During these long-time measurements the droplet radius reduced by approximately 7 % due to solubilisation. We made sure to only include data from the first 1–2 min of experiments in the investigation of size effects shown in § 3.1.
2.4. Flow decomposition in a 2-D Brinkman medium
To characterise the flow in the aqueous phase, we consider a cylindrical squirmer of radius  $a$ at low Reynolds number confined between two parallel plates separated by height
 $h$. Because confinement strongly affects the flows generated by microswimmers (Mathijssen et al. Reference Mathijssen, Doostmohammadi, Yeomans and Shendruk2016; Jeanneret, Pushkin & Polin Reference Jeanneret, Pushkin and Polin2019; Mondal et al. Reference Mondal, Prabhune, Ramaswamy and Sharma2021), we follow the framework used in Jin et al. (Reference Jin, Chen, Maass and Mathijssen2021) to evaluate the flow field
 $\boldsymbol {u}(x,y)$ in the mid-plane between the plates. Specifically, we approximate the 3-D Stokes equations by the 2-D Brinkman equations (Brinkman Reference Brinkman1947; Tsay & Weinbaum Reference Tsay and Weinbaum1991; Pepper et al. Reference Pepper, Roper, Ryu, Matsudaira and Stone2010; Gallaire et al. Reference Gallaire, Meliga, Laure and Baroud2014):
 \begin{equation} \boldsymbol{\nabla} p = \mu (\nabla^2 - k) \boldsymbol{u}, \quad \boldsymbol{\nabla} \boldsymbol{\cdot} \boldsymbol{u} = 0. \end{equation}
Here, the permeability is defined as  $k = 12/h^2 = 1/\lambda ^2$, in direct analogy with Darcy's law (Whitaker Reference Whitaker1986), and
 $\lambda$ is the slip length.
For an immotile droplet, the oil–water interface corresponds to a circle around the coordinate origin with radius  $\rho = a$ in polar coordinates
 $(\rho,\theta )$. Assuming that this interface is impermeable, the flow field is determined by the tangential velocity. This boundary condition can be written as a harmonic expansion
 \begin{equation} u_{\rho}(\rho=a)=0 \quad \text{and} \quad u_{\theta}(\rho=a)=-\frac{a}{\lambda} \sum_{n=1}^\infty \frac{K_{n-1}(a/\lambda)}{K_{n}(a/\lambda)}b_n \sin(n\theta), \end{equation}
where the coefficients  $b_n$ are multiplied by a constant in terms of the Bessel functions of the second kind,
 $K_n$, to simplify the functional form of the following solution. The flow field
 $\boldsymbol {u}$ in the 2-D domain around the droplet, corresponding, in the Hele-Shaw cell, to the
 $z$-averaged flow in (
 $x,y$), is then given by the pumping solution (Pepper et al. Reference Pepper, Roper, Ryu, Matsudaira and Stone2010; Gallaire et al. Reference Gallaire, Meliga, Laure and Baroud2014; Nganguia & Pak Reference Nganguia and Pak2018)
 $$\begin{gather} u_{\rho}^{n} = b_n \left[ n \left(\frac{a}{\rho}\right)^{n+1} -n\frac{a}{\rho}\frac{K_n(\rho/\lambda)}{K_n(a/\lambda)} \right]\cos(n\theta), \end{gather}$$
 $$\begin{gather}{u_{\theta}}^{n}=b_n \left[ n \left(\frac{a}{\rho}\right)^{n+1} +\frac{a}{\lambda} \frac{K'_n(\rho/\lambda)}{K_n(a/\lambda)} \right]\sin(n\theta). \end{gather}$$
Henceforth, we will identify this mode decomposition of the flow as the ‘Brinkman approximation’.
The flow patterns around the droplet are characterised by the first two coefficients  $b_1,b_2$: first, their weights determine the dominant flow mode, which is dipolar for
 $|b_2/b_1|<1$ and quadrupolar for
 $|b_2/b_1|>1$ (Nganguia & Pak Reference Nganguia and Pak2018; Jin et al. Reference Jin, Chen, Maass and Mathijssen2021). To illustrate this, supplementary material and movies are available at https://doi.org/10.1017/jfm.2023.411, where figure S1 shows the streamlines for increasing
 $b_2/b_1$ values. Second, for a primarily dipolar flow pattern, the sign of
 $b_2$ determines the location of the dominant vortex pair:
 $b_2>0$ results in an anterior and
 $b_2<0$ in a posterior location, with the droplet anterior defined at
 $\theta =0$. In our fits of the experimental velocity field to this model, we use
 $b_1,b_2$ as fit parameters with
 $b_n=0$ for
 $n>2$ and, figure 6 excepted, all (
 $x,y$) data plots have been rotated to have the droplet's anterior or
 $\theta =0$ axis pointing to the right, in positive
 $x$. We note that, using the Brinkman approximation, we assume that
 $u(z)\approx 0$: all monopolar flow modes like a gravitational force monopole (cf. de Blois et al. (Reference de Blois, Reyssat, Michelin and Dauchot2019) and Hokmabad et al. (Reference Hokmabad, Nishide, Ramesh, Krüger and Maass2022b) for sedimenting droplets) should be suppressed by the strong
 $z$ confinement of the Hele-Shaw geometry.
3. Results
For droplets driven by micellar solubilisation, self-sustaining propulsive or pumping flows develop when the Péclet number  $Pe$ exceeds a critical threshold (Michelin et al. Reference Michelin, Lauga and Bartolo2013);
 $Pe$ is given by the ratio of advective to diffusive transport of surfactant monomers from the droplet interface to oil-filling micelles (Herminghaus et al. Reference Herminghaus, Maass, Krüger, Thutupalli, Goehring and Bahr2014), and can be estimated in the single-species picture as follows (cf. (1) and Appendix B.2 in Hokmabad et al. (Reference Hokmabad, Dey, Jalaal, Mohanty, Almukambetova, Baldwin, Lohse and Maass2021), following Anderson Reference Anderson1989; Izri et al. Reference Izri, van der Linden, Michelin and Dauchot2014; Morozov & Michelin Reference Morozov and Michelin2019):
 \begin{equation} Pe \approx \frac{18 {\rm \pi}^2}{k_BT} q_s r_s^2 \zeta a^2 \mu^i \left[\mu \left(\frac{2\mu+3 \zeta/a}{2 \mu+3}\right)\right]. \end{equation}
Here,  $a$ is the droplet radius,
 $\mu =\mu ^o/\mu ^i$ the viscosity ratio between the outer and inner media,
 $\zeta \sim 10~{\rm nm}$ is the characteristic length scale over which surfactant monomers interact with the droplet,
 $r_s \sim 10 \times 10^{-10}\ {\rm m}$ is the length of a monomer and
 $q_s = D \boldsymbol {n} \boldsymbol{\cdot} \boldsymbol {\nabla } c$ is the isotropic interfacial surfactant desorption rate per area. We use this definition of
 $Pe$ for the present geometry as well, since the underlying chemical processes are identical: qualitatively, an increase in the droplet radius
 $a$ corresponds to an increase of
 $Pe$.
3.1. Flow field characterisation and comparison with the Brinkman approximation
We begin with a classification of the observed flow patterns around pumping flat droplets, as shown in figure 2, and the supporting supplementary material and movies S1 and S2. For small radii,  $a={61}\ \mathrm {\mu }$m, or
 $Pe=26$, we find one posterior droplet pair. With increasing droplet radius,
 $a={80}\ \mathrm{\mu }$m or
 $Pe =38$, the vortex pair shifts towards the midline (‘neutral’ position) and finally to the droplet anterior, for
 $a={102}\ \mathrm{\mu }$m with
 $Pe =62$. On further increasing the droplet radius, we observe a bistable regime, featuring either a vortex pair displaced further towards the droplet anterior (
 $a={185}\ \mathrm {\mu }$m,
 $Pe =204$) or a symmetric extensile or quadrupolar flow field (
 $a={148}\ \mathrm {\mu }$m,
 $Pe =130$). For even bigger droplet radii we find only the quadrupolar mode, with an increasing asymmetry in the vortex positions which shift towards the anterior (
 $a={243}\ \mathrm {\mu }$m,
 $Pe =350$).
For a quantitative evaluation of the interfacial modes, we measure the flow fields by PIV and compare them with the Brinkman approximation. This decomposition gives the mode coefficients  $b_1, b_2$ (defined in (2.2a,b)), which are shown in figure 3. Here, in the top part of panels (a)–(e) we analyse the data presented in figure 2. The streamlines show a good quantitative agreement between experimental data (top half) and the Brinkman approximation (bottom half). The mode decomposition successfully locates the vortex positions in the bulk medium, as shown by the comparison of measured and fitted streamlines in the top row; and by the small and unstructured residual flow fields in the far field (bottom row).
Top row: comparison between the experimental flow fields  $v_{exp}$ (top half of each panel) and fits to the Brinkman approximation
 $v_{fit}$ (bottom half) for different
 $Pe$, with fit parameters
 $b_1,b_2$: (a)
 $Pe =26$ (
 $b_2/b_1=-0.529$), (b)
 $Pe =38$ (
 $b_2/b_1=-0.001$), (c)
 $Pe =62$ (
 $b_2/b_1=0.191$), (d)
 $Pe =130$ (
 $b_2/b_1=4.915$) and (e)
 $Pe =204$ (
 $b_2/b_1=0.175$). Depending on the
 $b_2/b_1$ ratio, we note a shift of the vortex pair towards the droplet anterior, and a bistability of dipolar and quadrupolar patterns for large droplets. Bottom row: residual flow fields,
 $|v_{exp}- v_{fit}|$.

In analogy to the squirmer model for motile droplets (Ishikawa, Simmonds & Pedley Reference Ishikawa, Simmonds and Pedley2006; Downton & Stark Reference Downton and Stark2009), we can define a parameter  $\beta =b_2/b_1$ that indicates the vortex centre position. A posterior vortex pair corresponds to
 $b_2/b_1<0$, neutral vortices to
 $b_2/b_1=0$ and anterior vortices to
 $b_2/b_1>0$. A quadrupolar configuration is caused by a dominant second mode with
 $|b_2/b_1|>1$. However, for dipolar anterior vortices (figure 3e), the fit to the Brinkman approximation up to second order somewhat under-predicts
 $\theta _v$, which leads to distinct vortex structures in the residual field.
3.2. Squirmer parameter and phase diagram
Using the data obtained by fitting the Brinkman approximation to the experimental data, we plot the change of the squirmer parameter  $b_2/b_1$ with the droplet radius
 $a$ in figure 4(a). With increasing radius,
 $b_2/b_1$ increases from negative to zero and then to positive values, but still remains smaller than one, which indicates a dominant first mode. This
 $b_2/b_1$ transition reflects the vortex shift from the droplet posterior to a neutral and then an anterior position. We further evaluate the vortex angle
 $\theta _v$, defined as the polar angle of the line between
 $\rho =0$ and the location of
 $\boldsymbol {u}(x,y)=0$ at the centre of the respective vortex (figure 4e). Finally, we evaluate the vortex angles in the Brinkman approximation,
 $\theta _v^{model}$, and compare them with the experimentally determined values,
 $\theta _v^{exp}$, vs the radius in figure 4(b). We observe an excellent agreement up to large radii of
 $a\gtrsim {150}\ \mathrm{\mu }$m. Here, with a strong anterior shift, the experimentally determined vortex centre position is underpredicted by the Brinkman approximation.
At larger radii, we predominantly find quadrupolar flow fields, i.e. a dominant second mode. For classification, we plot the different modes in the space spanned by  $|b_2/b_1|$ and
 $a$ as shown in figure 4(c). The phase diagram is divided into three regions, namely, (i) ‘vortex pair’, (ii) ‘bistable’, featuring either a strong anterior vortex pair or a symmetric extensile flow and (iii) ‘asymmetric extensile’, where the anterior vortex pairs are displaced inwards. The dashed horizontal line,
 $|b_2/b_1|=1$, separates dipolar (below) and quadrupolar (above) flow fields. For large droplets, the quadrupolar state also loses fourfold symmetry, as the vortices move towards the anterior and posterior stagnation points. To characterise this asymmetry, we plot the vortex angles for both anterior,
 $\theta _{v1}$, and posterior,
 $\theta _{v2}$, vortex pairs in figure 4(d). For the symmetric quadrupolar state, the vortex angle is
 $\theta _v\approx {\rm \pi}/4$ (grey region), whereas in the asymmetric configuration,
 $\theta _v < {\rm \pi}/4$ (pink region). We note that for both dipolar and quadrupolar asymmetric states, the vortices are pulled towards stagnation points with radial influx.
(a,c) Variations of squirmer parameter  $b_2/b_1$ vs
 $Pe$. (b,d) Variations of angle between front stagnation point and vortex centre
 $\theta _v$ vs
 $Pe$. (e) Schematic defining the vortex angle.

3.3. Simultaneous chemical and flow field characterisation
For a deeper analysis, we simultaneously measure the droplet flow fields and the chemical concentration fields using dual channel fluorescent microscopy as described above in § 2.2. Previous studies have shown that oil-filled micelles are considerably larger than the reactive species, i.e. surfactant monomers and will therefore diffuse much more slowly (Hokmabad et al. Reference Hokmabad, Dey, Jalaal, Mohanty, Almukambetova, Baldwin, Lohse and Maass2021), such that we can expect them to aggregate at stagnation points and cause secondary inhibition effects as proposed in Morozov (Reference Morozov2020). Here, oil-filled micelles are labelled by Nile red dye co-moving with the oil phase.
In figure 5(a–e), we set out the relation between the chemical and flow fields for a close to neutral dipolar droplet. Panel (a) maps the field of the tangential velocity  $u_\theta$, with superimposed streamlines, while panel (b) displays a contour plot of the Nile red emission
 $I$. We further extract the profiles
 $u_\theta$ and
 $I(\theta )$ around the droplet along the dashed lines, as displayed in panels (c) and (d), with the gradient of the intensity profile in panel (e). If the interfacial surfactant density is depleted in the presence of filled micelles, an extremum of the gradient in the chemical field
 $\partial _\theta I^{max}$ correlates to a Marangoni gradient in the interface and therefore to an extremum
 $u_\theta ^{max}$ of the tangential velocity. We have plotted the respective angles of
 $\theta _v$,
 $\theta (u_\theta ^{max})$ and
 $\theta (\partial _\theta I^{max})$ in panel (f).
(a) Flow around a pumping droplet at  $Pe =65$, streamlines and tangential velocity
 $u_\theta$ (colour coded) from PIV data. Here,
 $u_{\theta }$ is extracted along the green dashed circle around the droplet interface; the black dash-dotted line marks the droplet axis. (b) Corresponding contour plot of discretised levels of fluorescent emission by a Nile red doped oil droplet and the filled micelles in the ambient medium. In the non-discretised raw data, the fluorescence profile around the droplet interface is extracted along the red circle to yield the profile in (d). Scale bar: 50
 $\mathrm {\mu }$m. (c) Tangential velocity profile at the interface. (d) Intensity profile of the filled micelle concentration around the droplet. (e) Intensity gradient profile corresponding to (d). (f) Variations of vortex angle
 $\theta _v$ (black), angle of maximum tangential velocity
 $\theta (u_{\theta }^{max})$ (green) and angle of maximum chemical gradient around the droplet
 $\theta (\partial _\theta I^{max})$ (red) vs
 $Pe$. We have added representative error bars to
 $\theta (u_{\theta }^{max})$ and
 $\theta (\partial _\theta I^{max})$ that estimate the systematic error from the measurement being taken at a distance from the droplet interface. All three observables decrease with increasing
 $Pe$.

As the droplet radius  $a$ increases, the vortex position shifts from the posterior at
 $\theta _v>{\rm \pi} /2$ to the anterior at
 $\theta _v<{\rm \pi} /2$. We observe that
 $\theta (u_{\theta }^{max})$ coincides with
 $\theta _v$, and
 $\theta (\partial _\theta I^{max})$ shows a similar shift with increasing droplet radius, but with an offset towards higher
 $\theta$ values compared with
 $\theta _v$ and
 $\theta (u_\theta ^{max})$. This may be due to a systematic overestimation – as noted in § 2.3, the fluorescence has to be measured away from the interface, where the micelles have already been advected further towards the droplet posterior. We propose that this displacement of
 $\theta (u_{\theta }^{max})$ and
 $\theta _v$ with increasing droplet radius is caused by the saturation of micelles with oil. To demonstrate saturation effects in general, we first investigate the long-term dynamics of the pumping droplet.
3.4. Long-time evolution of the pumping droplet
Until now, we have looked at quasi-stationary short-time dynamics. In long-term dynamics, self-interactions become more important: we expect reaction products to recirculate and interact with the droplet again after time scales longer than the advective one. This buildup of oil-filled micelles should now influence the long-term interfacial activity dynamics. To quantify this, we recorded dual-channel microvideographs of flow and chemical fields around a droplet with a dipolar flow field, and analysed the long-time interfacial dynamics (see also supplementary material and movie S3).
Figure 6(a) shows, for increasing time, colloidal tracer images with selected streamlines that illustrate the extracted flow field. We have plotted the tangential velocity at the interface, using the diverging colour map from panel (c) below, such that green corresponds to positive (counter-clockwise) and purple to negative flow, while yellow regions mark negligible flow with  $|u_\theta | < 1\ \mathrm {\mu }{\rm m}\ {\rm s}^{-1}$, as expected for both the anterior and posterior stagnation points. At
 $t=0$, the entire remaining droplet perimeter is active. With increasing time, as the droplet solubilises, oil-filled micelles build up and accumulate around the posterior stagnation point
 $\theta =\pm {\rm \pi}$. In this area, the tangential flow speed decreases. The inactive region grows over time, as shown in the broadening yellow section of the tangential velocity map, while the vortices shift towards the anterior. At long times,
 $t={22}$ min, only a very small region at the droplet anterior is active and soon the entire droplet is rendered inactive.
(a) Time evolution of streamlines around a pumping droplet at  $Pe =241$ and
 $a={201}\ \mathrm {\mu }$m. As time increases, the inactive region starting from the rear stagnation point grows around the interface due to saturation by filled micelles. This leads to droplet inactivity at long time. Scale bar: 100
 $\mathrm {\mu }$m. (b) Time evolution of filled micelle concentration around the droplet interface. Here,
 $\theta =0$ indicates the anterior stagnation point. (c) Time evolution of the tangential velocity around the droplet interface. The colour bar also applies to the interfacial speeds plotted in (a). See also supplementary material and movie S3.

There is a noticeable depletion of tracer particles in the inactive region, as shown by the dark ‘tail’ in (a). This might be due to a chemo- or electrophoretic drift caused by the inhomogeneous distribution of chemical species around the posterior stagnation point (Warren, Shin & Stone Reference Warren, Shin and Stone2019; Katuri et al. Reference Katuri, Uspal, Popescu and Sánchez2021), see also figure 1(d). If present, these flows lie below the experimental resolution of our PIV analysis and the tracer depletion is not so strong that it precludes analysis. However, over a time of 20 min, even a flow of the order of  $0.1\ \mathrm {\mu }{\rm m}\ {\rm s}^{-1}$ would displace a colloid by 120
 $\mathrm {\mu }$m, which is comparable to the size of the depletion region.
To track the continuous evolution of filled micelle concentration and tangential velocity at the droplet interface, we have mapped them onto kymographs in  $t,\theta$ space in figures 6(b) and 6(c). At
 $t=0$, the red fluorescence from oil-filled micelles is centred around the posterior stagnation point at
 $\theta =\pm {\rm \pi}$; the dark region around the anterior stagnation point indicates mostly empty micelles. With increasing time, as the number of oil-filled micelles increases, the red region at the posterior broadens until it fills almost the entire droplet perimeter. This is also evident from figure 6(c), where the green and purple bands of tangential flow corresponding to the two vortices narrow over time and recede towards
 $\theta =0$, while the yellow region broadens, indicating inactivity with
 $|u_{\theta }|< 1\ \mathrm {\mu }{\rm m}\ {\rm s}^{-1}$. For long times, this gradual saturation renders the droplet entirely inactive. We note that, in motile droplets, one would not expect this type of saturation buildup, as they can escape their own chemical exhaust (Hokmabad et al. Reference Hokmabad, Dey, Jalaal, Mohanty, Almukambetova, Baldwin, Lohse and Maass2021).
3.5. The effect of micelle saturation
Finally, we want to discuss two observations. First, with increasing droplet size and  $Pe$, we have seen a displacement trend from posterior to anterior for both the vortex-pair location, and maximum concentration gradient location. Second, long-time measurements showed a saturation effect by filled micelles which leads to similar vortex location displacement, and eventually the stopping of activity. This observation is different from numerical studies on models assuming a constant interfacial activity by interaction with a single chemical species: a good example is provided in figure 3 of Morozov & Michelin (Reference Morozov and Michelin2019), where, with increasing
 $Pe$, the dipolar vortex centre changes from midline symmetry, to a pusher-type posterior location, to a quadrupolar state with front–back symmetry.
We note that the idealised canonical model in Michelin et al. (Reference Michelin, Lauga and Bartolo2013), Morozov & Michelin (Reference Morozov and Michelin2019) and Izri et al. (Reference Izri, van der Linden, Michelin and Dauchot2014) differs from our experiments on two counts. First, it uses a spherical 3-D boundary with an axisymmetric constraint and no external forces: we are not aware of studies on a quasi-2-D geometry with a pinning force which we could use for a more direct comparison. Second, it is based on the chemodynamics of a single chemical species with a well-defined motility. It is therefore agnostic to the molecular kinetics of solubilisation, where monomers and empty or filled micelles have significantly different mobilities (Morozov Reference Morozov2020). We will now discuss how the differences between the evolution of vortex patterns we observe and the aforementioned numerical studies might be explained by the solubilisation kinetics alone.
Micelles will not absorb an infinite number of oil molecules (otherwise the solubilisation would create new droplets, which defies thermodynamics). Assuming, to first order, a constant flux of absorbing micelles along an active interface, and a constant rate at which they absorb oil from the boundary layer, it follows that there should be a fixed saturation time  $t_s$, and associated length beyond which micelles will not fill any further. This length scale limits the size of the vortex patterns around the droplet, and since it is independent of the droplet size, it follows that, for a larger droplet, the vortex centre would be located closer to the droplet anterior. This is consistent with the trend we observe in the dipolar patterns in figure 2.
To extract this length scale, we analyse the steady state flow fields around droplets of different sizes (§ 3.1) with respect to two quantities. First, the length  $a\theta _{v}$, which measures the arc length from the anterior stagnation point to the vortex centre. We assume
 $a\theta _{v}$ to scale with the saturation length, as
 $\theta _{v}$ marks the angle where the vortex streamlines begin to reorient away from the interface. Second, the average tangential velocity at the droplet interface
 $\bar {u}_\theta =\langle u_{\theta }(\rho =a,\theta )\rangle _{\theta =0.001}^{\theta =\theta _{v}}$. Due to the challenges of obtaining correct PIV results arbitrarily close to the interface, using the Brinkman approximation is an important tool to evaluate
 $u_{\theta }$ using the full 2-D PIV data around the droplet. The saturation time
 $t_s$ defined above should now scale with
 $t_s=a\theta _{v}/\bar {u}_\theta$. We have plotted
 $a\theta _v$,
 $\bar {u}_\theta$ and
 $t_s$ vs
 $a$ in figure 7. We find that while both
 $a\theta _v$ and
 $\bar {u}_\theta$ increase with the droplet radius
 $a$, the saturation time
 $t_s=0.92(17)$ s is constant. This indicates that for a fixed surfactant concentration the time for the micelles to become saturated is independent of the size of the droplet, and that this time scale sets the region of interfacial activity and thereby the anterior/posterior vortex configuration. This also motivates why the vortex shift with increasing
 $Pe$ should be different from the neutral-to-pusher transition shown in Morozov & Michelin (Reference Morozov and Michelin2019), where this time scale is absent. We note that this argument does not hold for small droplets where the vortices are displaced beyond the posterior stagnation point, as
 $a$ needs to be sufficiently large for the micelles to saturate while they are passing the interface.
(a) Vortex arc length  $a\theta _{v}$ and averaged tangential velocity
 $\bar {u}_\theta$ vs droplet radius
 $a$. (b) Saturation time
 $a\theta _{v}/\bar {u}_\theta$ vs droplet radius
 $a$, as extracted from the quantities plotted in (a).

Based on the above assumptions, we can now argue that for long times, i.e. beyond the time scale of the steady state analysed above, the continuous recirculation of filled micelles advects fewer empty micelles at the droplet anterior, which fill up faster. This leads to a gradual decrease of the saturation times and length scales, which is what we observe in figure 6 and supplementary material and movie S3.
Intuitively, this length limit might also motivate the coexistence of dipolar and quadrupolar patterns in the same  $Pe$ range shown in figure 2. If
 $\theta _v\lesssim {\rm \pi}/2$, the entire posterior side of the droplet would not solubilise and become unstable towards forming a second vortex pair, as we illustrate in the top and bottom row of figure 2. Here, we note with interest a recent numerical study (Morozov Reference Morozov2020) which extends the canonical model to multi-species kinetics. The author assumes that slowly diffusing oil-filled micelles inhibit the adsorption of surfactant monomers onto the interface and identifies a region of Péclet numbers where indeed both dipolar and quadrupolar solutions exist simultaneously.
4. Discussion and outlook
Chemically active droplets produce the flow fields that make them self-propelling microswimmers or immotile micropumps, primarily via Marangoni gradients caused by chemical reactions at the interface. In the experiments detailed above, we have studied chemical and flow fields around immobilised droplets depending on both size and activity duration and performed a hydrodynamic mode decomposition using a Brinkman approximation to account for quasi-2-D confinement and a Péclet number  $Pe$ adapted to the specific chemical system. This allows us to compare our findings with recent developments in numerical and analytical models using similar
 $Pe$ based mode stability approaches.
We confirm experimentally that the extrema in interfacial flow, and thereby the structure of the vortex field around the droplet, are correlated to gradients in the local concentration of reactivity products. Vortices and gradients shift around the perimeter with both increasing droplet size and progressing time: we have seen multistability of dipolar and quadrupolar modes, and an overall tendency of posterior-to-anterior displacement with increasing droplet size or experimental progress, which, during long-time experiments, leads eventually to an inactive droplet, where the interface is fully fouled up by chemical build-up. The analysis of our size-dependent data strongly suggests that the vortex structure is determined by the time scale of fuel conversion, as evidenced by a time-independent micellar saturation time.
Our findings provide an illustration of recent developments in analytical advection– diffusion models. Historically, minimal models assumed an uniform interfacial reaction rate (Michelin et al. Reference Michelin, Lauga and Bartolo2013; Izri et al. Reference Izri, van der Linden, Michelin and Dauchot2014), which already yields higher-order propulsive and extensile (e.g. dipolar to quadrupolar) modes with increasing  $Pe$ with good semi-quantitative experimental agreement. However, open questions remain for further investigation. Notably, simulations (Morozov & Michelin Reference Morozov and Michelin2019) found a transition from neutral squirmer
 $\beta =0$ to pusher,
 $\beta <0$ with a posterior vortex pair, to quadrupolar extensile with increasing
 $Pe$, while our experiments show an increase of
 $\beta$ with increasing
 $Pe$, albeit in a different geometry featuring flattened and immobilised droplets. However, in experiments on motile droplets driven by micellar solubilisation, sufficiently small swimmers are commonly found to be weak pushers as well (de Blois et al. Reference de Blois, Reyssat, Michelin and Dauchot2019; Jin et al. Reference Jin, Chen, Maass and Mathijssen2021; Suda et al. Reference Suda, Suda, Ohmura and Ichikawa2021). Pusher-to-neutral tendencies, i.e. an increase of
 $\beta$, with increasing droplet radius have also been reported for moving, spherical droplets (Suda et al. Reference Suda, Suda, Ohmura and Ichikawa2021), suggesting that the divergent behaviour we found in this study is not a consequence of the different geometry, but of multi-species effects. This encourages a more in-depth investigation of the specific solubilisation kinetics in both experiment and theory.
Regarding our observation of bistable states, we note two recent studies: Bistability of dipolar and quadrupolar states was found numerically for a 3-D swimmer held stationary near a wall (Desai & Michelin Reference Desai and Michelin2021), thus using a single-species approach, but more complex boundary conditions than a force-free bulk. However, bistability was also found in a multi-species model of a droplet in a bulk fluid where the interfacial reactivity was assumed to be inhibited by oil-filled micelles (Morozov Reference Morozov2020). Interestingly, in the latter case, the region of multistability increased with the inhibition parameter.
The flow field of a Brinkman squirmer with a localised interfacial gradient, corresponding to our assumption of a predominantly inactivated interface for long times, has been evaluated as well (Gallaire et al. Reference Gallaire, Meliga, Laure and Baroud2014), yielding very similar vortex patterns. We note, however, that these calculations were based on an preimposed interfacial tension gradient (or, experimentally, localised heating), such that the underlying physical mechanism is different from the one causing our self-evolving profile.
Beyond the implications for individual motility, multistable and higher mode flow patterns matter in the collective dynamics of active matter, and in their interactions with confined geometries. Tan et al. (Reference Tan, Mietke, Li, Chen, Higinbotham, Foster, Gokhale, Dunkel and Fakhri2022) showed that developing starfish embryos generate different flow patterns during its development process, which determine their self-organisation (formation, dynamics and dissolution) into living crystals. Analogously, in artificial autophoretic systems, rotational instabilities on the individual scale (Hokmabad et al. Reference Hokmabad, Dey, Jalaal, Mohanty, Almukambetova, Baldwin, Lohse and Maass2021; Suda et al. Reference Suda, Suda, Ohmura and Ichikawa2021) can carry through to the collective dynamics, where we have recently found  $Pe$-dependent stability and collective rotation in self-assembled planar clusters (Hokmabad et al. Reference Hokmabad, Nishide, Ramesh, Krüger and Maass2022b). Here, the superposition of self-generated chemical fields might well provide a mechanism for the emergence of stable collective rotational states. Our analysis of interfacial activity dynamics is also directly relevant to the study of active carpets (Mathijssen et al. Reference Mathijssen, Guzmán-Lastra, Kaiser and Löwen2018; Guzmán-Lastra, Löwen & Mathijssen Reference Guzmán-Lastra, Löwen and Mathijssen2021).
Impermeable boundaries like walls will also affect the spreading of inhibitory chemical products and affect the stability of hydrodynamic modes, as recently demonstrated for a droplet near a wall (Desai & Michelin Reference Desai and Michelin2021). Experimentally, such inhibitory effects in confinement can immobilise consecutive droplets in an active Bretherton scenario (de Blois et al. Reference de Blois, Bertin, Suda, Ichikawa, Reyssat and Dauchot2021) or cause reorientation up to self-trapping (Jin et al. Reference Jin, Krüger and Maass2017; Lippera et al. Reference Lippera, Benzaquen and Michelin2020a; Hokmabad et al. Reference Hokmabad, Agudo-Canalejo, Saha, Golestanian and Maass2022a).
Understanding and modelling such phenomena from the molecular scale upwards is a daunting task, given the manifold species one has to keep track of and that the complex multistable dynamics is likely initiated by the competing time scales of slow micellar diffusion governing the chemical buildup and faster molecular diffusion powering the underlying advection–diffusion mechanism. We therefore propose the tools and experimental geometry in this study as a well-defined and quantifiable testing case to investigate in matching theoretical modelling.
Supplementary material and movies
Supplementary material and movies are available at https://doi.org/10.1017/jfm.2023.411.
Acknowledgements
We gratefully acknowledge fruitful discussions with Professor J. Dunkel at MIT and experimental optics support by Dr K. Hantke at MPI-DS. We expressly acknowledge the contribution of experimental data by M. Rahalia, whom we were unable to contact at the time of submission.
Declaration of interests
The authors report no conflict of interest.


 Open access

