INTRODUCTION
The orbitofrontal cortex (OFC), implicated in mood regulation and emotion-related learning (Price, Reference Price1999), modulates an individual's emotional response to stimuli (O'Doherty et al. Reference O'Doherty, Kringelbach, Rolls, Hornak and Andrews2001). OFC damage is characterized by disinhibition, mood lability, social deficits, and impaired responses to negative feedback (Rolls et al. Reference Rolls, Hornak, Wade and McGrath1994; Tekin & Cummings, Reference Tekin and Cummings2002). Functional magnetic resonance imaging (MRI) shows that OFC blood flow and metabolism is reduced in depression (Biver et al. Reference Biver, Goldman, Delvenne, Luxen, De Maertelaer, Hubain, Mendlewicz and Lotstra1994; Lesser et al. Reference Lesser, Mena, Boone, Miller, Mehringer and Wohl1994), and induction of depressive symptoms results in decreased metabolic activity in the OFC (Bremner et al. Reference Bremner, Vythilingam, Ng, Vermetten, Nazeer, Oren, Berman and Charney2003).
Structural neuroimaging studies have reported volumetric OFC differences in depression. Studies examining depressed elderly populations have consistently found smaller OFC volumes (Lai et al. Reference Lai, Payne, Byrum, Steffens and Krishnan2000; Ballmaier et al. Reference Ballmaier, Sowell, Thompson, Kumar, Narr, Lavretsky, Welcome, DeLuca and Toga2004a, Reference Ballmaier, Sowell, Thompson, Kumar, Narr, Lavretsky, Welcome, DeLuca and Togab). Studies not limited to geriatric populations have reported positive (Bremner et al. Reference Bremner, Vythilingam, Vermetten, Nazeer, Adil, Khan, Staib and Charney2002; Lacerda et al. Reference Lacerda, Keshavan, Hardan, Yorbik, Brambilla, Sassi, Nicoletti, Mallinger, Frank, Kupfer and Soares2004) and negative results (Hastings et al. Reference Hastings, Parsey, Oquendo, Arango and Mann2004; Janssen et al. Reference Janssen, Pol, Lampe, Schnack, de Leeuw, Kahn and Heeren2004). Differences in OFC volume are further associated with functional disability (Taylor et al. Reference Taylor, Steffens, McQuoid, Payne, Lee, Lai and Krishnan2003) and cognitive deficits (Steffens et al. Reference Steffens, McQuoid, Welsh-Bohmer and Krishnan2003a).
Despite these reports, it is not clear what factors may contribute to these differences in OFC volume. One contributor may be genetic polymorphisms that increase the risk for either depression or dementia. The serotonin transporter promoter region (5HTTLPR) polymorphism is associated with an increased risk of depression in the context of stress (Caspi et al. Reference Caspi, Sugden, Moffitt, Taylor, Craig, Harrington, McClay, Mill, Martin, Braithwaite and Poulton2003; Eley et al. Reference Eley, Sugden, Corsico, Gregory, Sham, McGuffin, Plomin and Craig2004; Lenze et al. Reference Lenze, Munin, Ferrell, Pollock, Skidmore, Lotrich, Rogers, Quear, Houck and Reynolds2005) and is also associated with structural alterations of other brain regions involved in mood regulation (Frodl et al. Reference Frodl, Meisenzahl, Zill, Baghai, Rujescu, Leinsinger, Bottlender, Schule, Zwanzger, Engel, Rupprecht, Bondy, Reiser and Moller2004; Pezawas et al. Reference Pezawas, Meyer-Lindenberg, Drabant, Verchinski, Munoz, Kolachana, Egan, Mattay, Hariri and Weinberger2005; Taylor et al. Reference Taylor, MacFall, Payne, McQuoid, Steffens, Provenzale and Krishnan2005b). Another possible influence is the apolipoprotein E (APOE) ε4 polymorphism, which is associated with Alzheimer's disease (Saunders et al. Reference Saunders, Strittmatter, Schmechel, George-Hyslop, Pericak-Vance, Joo, Rosi, Gusella, Crapper-MacLachlan and Alberts1993; Strittmatter et al. Reference Strittmatter, Saunders, Schmechel, Pericak-Vance, Enghild, Salvesen and Roses1993). The characteristic Alzheimer neuropathology in the OFC is extensive (Van Hoesen et al. Reference Van Hoesen, Parvizi and Chu2000), and neuroimaging studies support OFC atrophy in Alzheimer's disease (Janke et al. Reference Janke, de Zubicaray, Rose, Griffin, Chalk and Galloway2001; Matsuda et al. Reference Matsuda, Kitayama, Ohnishi, Asada, Nakano, Sakamoto, Imabayashi and Katoh2002). Although APOE genotype is generally not associated with geriatric depression (Forsell et al. Reference Forsell, Corder, Basun, Lannfelt, Viitanen and Winblad1997; Steffens et al. Reference Steffens, McQuoid, Welsh-Bohmer and Krishnan2003b), it is possible that a subset of older depressed individuals may exhibit APOE-related OFC deficits with depression being a prodrome of Alzheimer's disease.
Another contributing factor may be hyperintense lesions, which are commonly seen in older depressed populations (Coffey et al. Reference Coffey, Figiel, Djang, Cress, Saunders and Weiner1988; Fujikawa et al. Reference Fujikawa, Yamawaki and Touhouda1993; O'Brien et al. Reference O'Brien, Desmond, Ames, Schweitzer, Harrigan and Tress1996; Krishnan et al. Reference Krishnan, Hays and Blazer1997; Kumar et al. Reference Kumar, Bilker, Jin and Udupa2000; Taylor et al. Reference Taylor, MacFall, Payne, McQuoid, Steffens, Provenzale and Krishnan2005a). These lesions may damage the broader mood regulatory circuit, either subcortical gray-matter regions or the connecting white-matter fiber tracts, which could result in denervation and OFC atrophy. We have previously reported that greater severity of subcortical gray-matter hyperintense lesions is negatively associated with OFC volume (Lee et al. Reference Lee, Payne, Steffens, McQuoid, Lai, Provenzale and Krishnan2003).
This cross-sectional study examined the relationship between OFC volumes, depression, polymorphisms of 5HTTLPR and APOE, and hyperintense lesions in a large sample of depressed and non-depressed subjects. We sought to replicate in a larger sample our previous finding (Lai et al. Reference Lai, Payne, Byrum, Steffens and Krishnan2000; Lee et al. Reference Lee, Payne, Steffens, McQuoid, Lai, Provenzale and Krishnan2003) of smaller OFC volumes in depressed subjects. We also tested the hypotheses that the presence of the short (s) allele of 5HTTLPR or the presence of one or more APOE ε4 alleles would be associated with smaller OFC volume. Finally, we examined the relationship between OFC volume and white-matter and subcortical gray-matter hyperintense lesion severity. The purpose of these analyses was to determine whether we could replicate our previous results (Lee et al. Reference Lee, Payne, Steffens, McQuoid, Lai, Provenzale and Krishnan2003) in a larger sample, while also using more objective methods of measuring lesion volume. Given the inclusion of more objective methods of measuring lesion volume, we hypothesized a negative relationship between OFC volume and both white and gray-matter lesions, despite our previous inability to demonstrate a relationship between OFC volume and white-matter lesion severity.
METHOD
Sample
Subjects with depression were participants in the National Institute of Mental Health (NIMH) Conte Center for the Neuroscience of Depression in Late Life, located at Duke University. Eligibility was limited to patients aged 60 years or older with a DSM-IV diagnosis of unipolar major depression. Exclusion criteria included (1) another major psychiatric illness, although co-morbid anxiety symptoms were allowed; (2) history of alcohol or drug abuse or dependence; (3) primary neurological illness, including dementia; and (4) metallic objects within the body precluding MRI. Depressed subjects were recruited for the study primarily through clinical referrals from both in-patient and out-patient services, and also through limited advertising at Duke University Medical Center. Depressed individuals both on and off antidepressant medications were enrolled.
Control subjects were recruited from a larger group of individuals enrolled in the Aging Center Subject Registry at Duke University. These are community-dwelling older individuals who have expressed an interest in participating in aging-related research. Eligible control subjects had a non-focal neurological examination, no self-report of neurological or psychiatric illness, and no evidence of a psychiatric disorder based on the NIMH Diagnostic Interview Schedule (Robins et al. Reference Robins, Helzer, Croughan and Ratcliff1981).
Both depressed and non-depressed subjects completed the Duke Depression Evaluation Schedule (Landerman et al. Reference Landerman, George, Campbell and Blazer1989) to establish the presence or absence of a major depression diagnosis and to ensure that no other psychiatric disorders were present. This composite diagnostic interview instrument includes sections of the NIMH Diagnostic Interview Schedule assessing depression and is enriched with items assessing sleep problems and the clinical features of melancholia and psychosis, dysthymia, mania, and alcohol abuse or dependence. Depressed subjects were also interviewed by a geriatric psychiatrist who confirmed they met diagnostic eligibility criteria. Information from other sources, such as family members or treating clinicians, were obtained as needed. Depression severity was assessed using the Montgomery–Asberg Depression Rating Scale (MADRS; Montgomery & Asberg, Reference Montgomery and Asberg1979).
Both depressed and non-depressed comparison subjects were excluded if they had a diagnosis of dementia, or if the geriatric psychiatrist suspected dementia on evaluation. The majority of subjects had a Mini-Mental State Examination (MMSE; Folstein et al. Reference Folstein, Folstein and McHugh1975) score of 25 or above. Those subjects scoring 24 or below were followed through an acute 12-week treatment phase; if the scores remained below 25, they were not included in this study.
The study protocol was approved by the Duke University Medical Center Institutional Review Board. All subjects provided written informed consent before beginning study procedures. This study includes data from a previously published sample examining differences in OFC volume in a smaller sample of subjects with and without depression (Lai et al. Reference Lai, Payne, Byrum, Steffens and Krishnan2000).
MRI acquisition
Subjects were screened for any MRI contraindications and were imaged using a 1·5 T whole-body MRI system (Signa, GE Medical Systems, Milwaukee, WI, USA) using the standard head (volumetric) radiofrequency coil. The scanner alignment light was used to adjust the head tilt and rotation so that the axial plane lights passed across the cantho-meatal line and the sagittal lights were aligned with the center of the nose. A rapid sagittal localizer scan confirmed the alignment.
Two sets of images were utilized for lesion severity ratings. The first set of images was obtained with an axial, multi-section, T1-weighted pulse sequence (TR=500 ms, TE=15 ms) with a 256×192 data acquisition matrix, 5-mm section thickness, a 20-cm field of view (FOV), 1 excitation per phase-encoding increment (1 NEX) and a 32 kHz (±16 kHz) full imaging bandwidth. This was followed by a long TR (2500 ms), double-echo (TE=30 and 80 ms) spin–echo data acquisition sequence using the same FOV, section thickness, bandwidth and spacing, 256×192 data acquisition matrix, and 1 NEX. Saturation of spins outside the imaging volume (standard gap 15 mm) and flow compensation (gradient moment nulling) was used to eliminate artifacts due to flowing blood and cerebrospinal fluid. These images were obtained in two separate acquisitions with a 5-mm gap between sections for each acquisition. The second acquisition was offset by 5 mm from the first so that the resulting data set consisted of contiguous sections.
A dual-echo fast spin–echo (FSE) acquisition was obtained in the axial plane for morphometric analysis of cerebral structures, including lesion volumes. The pulse sequence parameters are TR=4000 ms, TE=30, 135 ms, 32 kHz (±16 kHz) full imaging bandwidth, echo train length=16, a 256×256 matrix, 3-mm section thickness, 1 excitation and a 20-cm field of view. The images were acquired in two separate acquisitions with a 3-mm gap between sections for each acquisition. The second acquisition was offset by 3 mm from the first so that the resulting data set consisted of contiguous sections with no gap.
MR image processing for quantitative brain volumes
The segmentation protocol has been described previously (Byrum et al. Reference Byrum, MacFall, Charles, Chitilla, Boyko, Upchurch, Smith, Rajagopalan, Passe, Kim, Xanthakos and Krishnan1996; Payne et al. Reference Payne, Fetzer, MacFall, Provenzale, Byrum and Krishnan2002) and uses a modified version of MrX software created by GE Corporate Research and Development (Schenectady, NY, USA), originally modified by Brigham and Women's Hospital (Boston) for image segmentation (Kikinis et al. Reference Kikinis, Shenton, Gerig, Martin, Anderson, Metcalf, Guttman, McCarley, Lorensen, Cline and Jolesz1992). This semi-automated method uses the multiple MR contrasts to identify different tissue classifications through a ‘seeding’ process wherein a trained analyst manually selected pixels in each tissue type to be identified [such as gray matter, white matter, cerebrospinal fluid (CSF), lesions, and background]. Lesion areas were selected based upon a set of explicit rules developed from neuroanatomical guidelines, consultation with a neuroradiologist, and knowledge of the neuropathology of lesions. Both periventricular and deep white-matter lesions were combined to provide a measure of white-matter hyperintensities (WMHs) on the segmented image. Gray-matter hyperintensities (GMHs) were those occurring in subcortical gray-matter structures. Total brain volume was used as a marker as intracranial volume, and defined as the entire cerebrum except for the brain stem and cerebellum, but including the CSF. Once the brain was segmented into tissue types and the non-brain tissue stripped away through a masking procedure, specific regions of interest (ROIs) were assessed using tracing and connectivity functions. A summarizing program calculated the volume of each tissue type within the specific ROI defined by the analyst.
OFC measures also used MrX, and the definition of the OFC has been described previously (Lai et al. Reference Lai, Payne, Byrum, Steffens and Krishnan2000). The inferior border is the first appearance of frontal lobe tissue moving superiorly from the base of the brain on consecutive axial slices. The posterior boundary of the OFC is determined by the anterior appearance of the circular insular sulcus. If the cistern at the medial frontotemporal notch is 20 or more pixels across, then lines are drawn from the circular insular sulcus to the lateral end of the cistern on each hemisphere. If the cistern is less than 20 pixels across, then a line is drawn joining the circular insular sulci of each hemisphere. The entire lateral extent of the frontal lobe is included until the superior border is reached. The most superior slice to include in the OFC is assessed in each hemisphere separately. If the CSF of the olfactory sulcus plus the gray matter extending posteriorly from the sulcus is at least three-quarters of the OFC length (anterior to posterior), the OFC is included on that hemisphere.
All technicians received extensive training by experienced volumetric analysts. Reliability was established by repeated measurements on multiple MR scans before raters were approved to process study data. Intra-class correlation coefficients (ICCs) were: left orbitofrontal cortex=0·9, right orbitofrontal cortex=0·9, total brain volume=0·997, left cerebral gray-matter lesions=0·995, right cerebral gray-matter lesions=0·996, left cerebral white-matter lesions=0·988, and right cerebral white-matter lesions=0·994.
Qualitative lesion severity analysis
In addition to the volumetric analyses, the studies were filmed (15 on one 14×17 in. film) and visually examined by two raters (D.C.S. and J.M.P.) for incidental findings and lesion ratings. The method for rating lesions is determined by rater consensus and has been described previously (Payne et al. Reference Payne, Fetzer, MacFall, Provenzale, Byrum and Krishnan2002). It uses the Coffey classification system to rate WMHs and subcortical GMHs. A value between 0 and 3 is assigned for each category based on hyperintensity size and severity.
DNA extraction and genotyping
Genomic DNA was extracted by standard procedures (Puregene D-50K DNA Isolation kit, Gentra, Minneapolis, MN, USA) from fresh or frozen samples of peripheral blood. Polymerase chain reaction amplification was used to generate 484- and 528-base pair fragments corresponding to the short and long 5HTTLPR alleles respectively. This method (Lesch et al. Reference Lesch, Bengel, Heils, Sabol, Greenberg, Petri, Benjamin, Muller, Hamer and Murphy1996) and the subsequent modifications (Steffens et al. Reference Steffens, Svenson, Marchuk, Levy, Hays, Flint, Krishnan and Siegler2002) have been described previously. White blood cells were processed and APOE genotypes determined using a previously described method (Saunders et al. Reference Saunders, Strittmatter, Schmechel, George-Hyslop, Pericak-Vance, Joo, Rosi, Gusella, Crapper-MacLachlan and Alberts1993).
Analytic plan
Demographic measures were compared between groups using univariate analyses: two-tailed t tests for continuous variables, and χ2 for categorical variables. Satterthwaite t tests were used for unequal variances. General linear models (GLMs) were created using SAS 8.02 (Cary, NC, USA) to examine the differences in OFC volumes between groups while controlling for covariates. Three initial multivariate models examining differences between groups included OFC volumes (left, right, and total) as dependent variables with depression status, age, sex, and total brain volume as independent predictors. Only main effects of the independent predictors were examined in these models.
Subsequent models examined the relationship between OFC volume, hyperintense lesions, and genetic polymorphisms. All variables of interest (WMH rated severity, GMH rated severity, WMH volume, GMH volume, 5HTTLPR genotype and APOE genotype) were examined in separate models as independent predictors. These models included OFC volumes (left, right, and total) as dependent variables with depression status, age, sex, and total brain volume as independent predictors. Lesion variables were examined as continuous measures, while genotypes were examined as categorical variables.
We tested for an interaction between depression status and hyperintense lesions or genetic polymorphisms in these models. The interaction term was not statistically significant in the models examining lesion volume, lesion severity, or the presence of the genetic polymorphisms. The interaction term was removed, the models rerun, and the results are presented in this manuscript.
Alternative approaches to these variables included examining lesion severity rating as a four-tiered categorical variable or examining all three 5HTTLPR genotypes (s/s, s/l or l/l). These approaches did not significantly change the results. We did not plan to control for multiple comparisons.
RESULTS
Demographic and univariate analyses
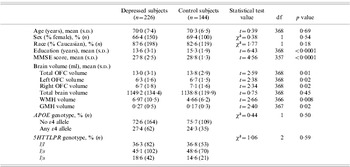
This study examined 226 elderly individuals with depression and 144 elderly control subjects without depression. There were no differences in age (range 60–94 years), or sex and race distribution (Table 1); the majority of non-Caucasian subjects were African-American. The non-depressed control subjects exhibited significantly higher MMSE scores and higher levels of education. The depressed cohort had a mean MADRS score of 27·2 (s.d.=7·6, range 15–54), with a mean age of onset of their first depressive episode of 45·4 years (s.d.=20·9 years, range 4–86 years).
Demographics and univariate comparisons

MMSE, Mini-Mental State Examination; OFC, orbitofrontal cortex; WMH, white-matter hyperintensity; GMH, gray-matter hyperintensity.
Categorical variables (presented as percentage of population, n) were compared using the χ2 test and continuous variables (presented as mean, s.d.) were compared using two-tailed t tests, except for unequal variances (MMSE, WMH and GMH analyses), in which case the Satterthwaite t test was used.
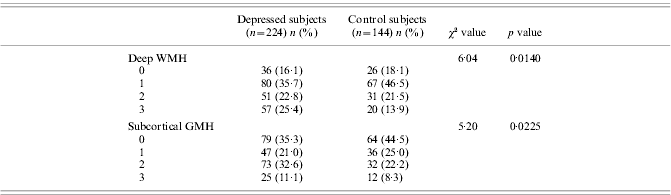
As in our previously reported work (Steffens et al. Reference Steffens, Svenson, Marchuk, Levy, Hays, Flint, Krishnan and Siegler2002, Reference Steffens, McQuoid, Welsh-Bohmer and Krishnan2003b; Taylor et al. Reference Taylor, MacFall, Payne, McQuoid, Steffens, Provenzale and Krishnan2005b), there was no difference in APOE ε4 allele frequency or 5HTTLPR genotype frequency between the depressed and non-depressed groups. Univariate analyses of unadjusted MRI measures show that depressed subjects exhibited smaller OFC volumes and larger lesion volumes but there was no significant difference in total brain volume between the two groups. Depressed subjects also exhibited significantly greater volume and severity of WMHs and GMHs (Table 2), as reported previously (Taylor et al. Reference Taylor, MacFall, Payne, McQuoid, Steffens, Provenzale and Krishnan2005a).
Hyperintensity rating score by group
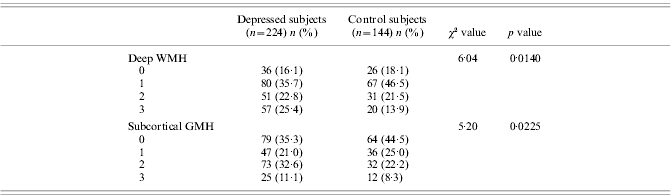
WMH, White-matter hyperintensity; GMH, gray-matter hyperintensity.
Scores for deep WMH: 0, none; 1, punctate foci; 2, beginning confluence of foci; 3, large confluent areas. Scores for GMH: 0, none; 1, punctate; 2, multi-punctate; 3, diffuse (Payne et al. Reference Payne, Fetzer, MacFall, Provenzale, Byrum and Krishnan2002). Data presented as n (%) with a particular rating, 1 degree of freedom for analyses.
Initial models: group differences
These initial models separately examined left, right, and total OFC volume and included age, sex, and total cerebral volume as independent variables. Depression was associated with smaller left [F(1, 369)=9·52, p=0·0022], right [F(1, 369)=8·54, p=0·0037], and total OFC volumes [F(1, 369)=11·31, p=0·0009]. Total brain volume was positively associated with OFC volume [left OFC: F(1, 369)=56·01; right OFC: F(1, 369)=58·95; total OFC: F(1, 369)=72·34; p<0·0001 for all models], while sex was not associated with OFC volume in any model [left OFC: F(1, 369)=0·22, p=0·6427; right OFC: F(1, 369)=2·59, p=0·1087; total OFC: F(1, 369)=0·50, p=0·4795]. Age was negatively associated with right [F(1, 369)=5·50, p=0·0196] and total OFC volumes [F(1, 369)=5·71, p=0·0174], with a trend for left OFC volume [F(1, 369)=3·57, p=0·0596].
Models incorporating hyperintense lesion variables
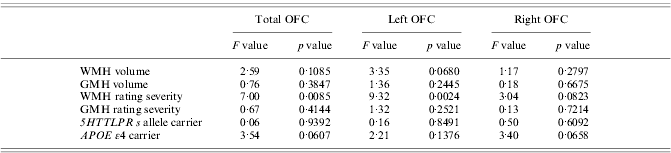
These models included depression, age, sex, and total cerebral volume as independent variables, along with the segmentation measures of WMH or GMH volume. Neither hyperintense lesion volume measure was significantly associated with any OFC volume (Table 3), although there was a trend for WMH volume to be negatively associated with left OFC volume.
Effect of hyperintense lesions and genetic polymorphisms on OFC volume
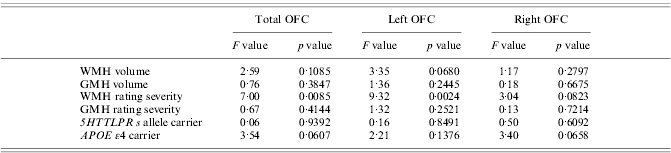
OFC, Orbitofrontal cortex; WMH, white-matter hyperintensity; GMH, gray-matter hyperintensity.
Separate models were created for each variable of interest and for each OFC measure (total, left, and right). All models used OFC volume as the dependent variable. Independent variables included age, sex, cerebrum, and depression diagnosis. WMH and GMH rating severity were determined using the Coffey scale. All variables had 1, 369 degrees of freedom, except the 5HTTLPR variable, which had 2, 369.
There was a stronger relationship between OFC volume and hyperintensity lesion severity as assessed using the Coffey visual rating scale. These models included depression, age, sex, total cerebral volume, and WMH or GMH rating scale lesion severity as independent predictors. There was a significant negative relationship between total and left OFC volume and WMH rating scale severity (Table 3). There was no significant association found between subcortical gray-matter lesion severity and OFC volume. Because of methodological issues in image acquisition, two depressed subjects did not have lesion ratings completed.
Models incorporating genetic polymorphisms
For the analyses of the relationship between OFC volume and the genetic polymorphisms, we first tested for univariate relationships. Subsequent models included depression, age, sex, total cerebral volume, and polymorphism genotype as independent predictors.
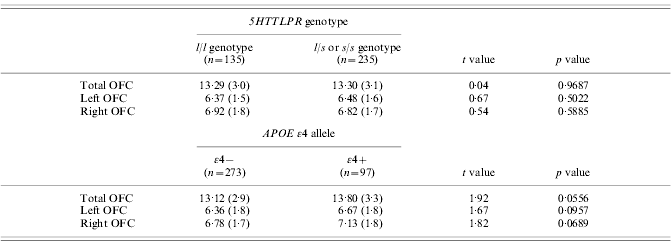
Univariate analyses of OFC volumes between those who were (n=235) and were not (n=135) 5HTTLPR s allele carriers showed no significant difference in any measure based on genotype (Table 4). In models controlling for covariates, the presence or absence of the s allele was not significantly associated with any OFC volume (Table 3).
Univariate differences in orbitofrontal cortex (OFC) volumes between genetic polymorphisms
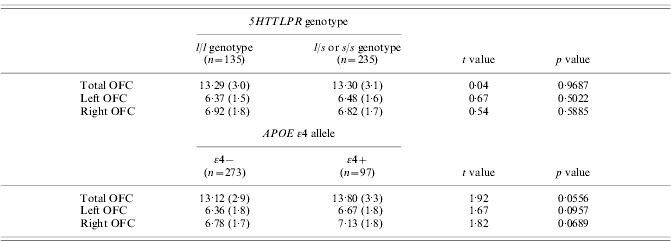
OFC volumes presented in ml (s.d. ml). Groups compared using two-tailed t tests with 368 degrees of freedom.
Univariate analyses of unadjusted OFC volume differences between subjects who were (n=97) and were not (n=273) APOE ε4 carriers showed trends for ε4 carriers to exhibit larger OFC volumes (Table 4). In models controlling for covariates, the trend persisted in the right and total OFC measures but did not reach a level of statistical significance (Table 3).
Given this unexpected finding of the relationship between APOE ε4 and OFC volume, we elected to run secondary analyses of these models examining depressed and non-depressed subjects separately. After controlling for age, sex, and total cerebral volume, there was no significant relationship between APOE and any OFC volume measure in the depressed cohort [left OFC: F(1, 225)=0·04, p=0·8455; right OFC: F(1, 225)=1·22, p=0·2180; total OFC: F(1, 225)=0·70, p=0·4043]. In these models, total brain volume continued to be significantly associated with OFC volume [left OFC: F(1, 225)=31·17; right OFC: F(1, 225)=39·16; total OFC: F(1, 225)=44·15; for all models, p<0·0001], while sex was not [left OFC: F(1, 225)=0·44, p=0·5076; right OFC: F(1, 225)=2·48, p=0·1164; total OFC: F(1, 225)=0·34, p=0·5577]. Age was significantly associated only with right OFC volume [left OFC: F(1, 225)=0·97, p=0·3251; right OFC: F(1, 225)=4·93, p=0·0274; total OFC: F(1, 225)=3·37, p=0·0678].
After controlling for those covariates in the non-depressed control group, there was a significant relationship between APOE status and left OFC volume [ε4+=7·1 ml, s.e.=0·2; ε4–=6·5 ml, s.e.=0·1; F(1, 143)=5·09, p=0·0256] and total OFC volume [ε4+=14·4 ml, s.e.=0·4; ε4–=13·5 ml, s.e.=0·3; F(1, 143)=4·25, p=0·0411], but not right OFC volume [ε4+=7·3 ml, s.e.=0·3; ε4–=7·0 ml, s.e.=0·2; F(1, 143)=2·10, p=0·1491]. Non-depressed subjects with an APOE ε4 allele exhibited larger OFC volumes. Total brain volume was associated with OFC volume [left OFC: F(1, 143)=21·64; right OFC: F(1, 143)=17·98; total OFC: F(1, 143)=24·91; for all models, p<0·0001], but neither sex [left OFC: F(1, 143)=0·07, p=0·7945; right OFC: F(1, 143)=0·59, p=0·4449; total OFC: F(1, 143)=0·35, p=0·5539] nor age [left OFC: F(1, 143)=3·82, p=0·0526; right OFC: F(1, 143)=1·33, p=0·2506; total OFC: F(1, 143)=2·97, p=0·0868] reached a level of statistical significance.
DISCUSSION
To our knowledge, this is the largest study to examine the OFC in depression. Our primary finding replicates past, smaller studies reporting that the OFC is smaller in depressed elderly subjects than in non-depressed subjects. There was a negative relationship between total and left OFC volume and greater severity of WMHs, but only a trend for the relationship between OFC volume and WMH volume and no association with GMH measures. There were also no significant associations between OFC volume and being a carrier of either the APOE ε4 allele or the 5HTTLPR s allele. However, secondary analyses found an association exclusively in the non-depressed population between APOE ε4 allele carriers and larger left and total OFC volumes.
Our finding of the OFC being smaller in depression is concordant with previous studies. Neuropathological studies have identified decreased OFC cortical thickness as well as decreases in OFC neuronal size and neuronal and glial densities in depression (Rajkowska et al. Reference Rajkowska, Miguel-Hidalgo, Wei, Dilley, Pittman, Meltzer, Overholser, Roth and Stockmeier1999). Several neuroimaging studies have reported smaller OFC volumes or smaller OFC gray-matter volumes in depressed subjects (Lai et al. Reference Lai, Payne, Byrum, Steffens and Krishnan2000; Bremner et al. Reference Bremner, Vythilingam, Vermetten, Nazeer, Adil, Khan, Staib and Charney2002; Ballmaier et al. Reference Ballmaier, Sowell, Thompson, Kumar, Narr, Lavretsky, Welcome, DeLuca and Toga2004b; Lacerda et al. Reference Lacerda, Keshavan, Hardan, Yorbik, Brambilla, Sassi, Nicoletti, Mallinger, Frank, Kupfer and Soares2004). Although some have not associated depression with OFC volume differences (Hastings et al. Reference Hastings, Parsey, Oquendo, Arango and Mann2004; Janssen et al. Reference Janssen, Pol, Lampe, Schnack, de Leeuw, Kahn and Heeren2004), these studies examined smaller cohorts with either a younger mean age (Hastings et al. Reference Hastings, Parsey, Oquendo, Arango and Mann2004) or exclusively older individuals with an early life onset of depression (Janssen et al. Reference Janssen, Pol, Lampe, Schnack, de Leeuw, Kahn and Heeren2004). Either of these factors may have contributed to the difference between these studies.
We did not find an association between 5HTTLPR genotype and OFC volume. Despite serotonin being implicated in neurodevelopmental processes and the 5HTTLPR s allele being associated with volumetric changes of other prefrontal regions involved in mood regulation (Pezawas et al. Reference Pezawas, Meyer-Lindenberg, Drabant, Verchinski, Munoz, Kolachana, Egan, Mattay, Hariri and Weinberger2005), our hypothesis was not supported. The short variant of the 5HTTLPR gene may be a risk factor for depression (Collier et al. Reference Collier, Stober, Li, Heils, Catalano, Di Bella, Arranz, Murray, Vallada, Bengel, Muller, Roberts, Smeraldi, Kirov, Sham and Lesch1996; Caspi et al. Reference Caspi, Sugden, Moffitt, Taylor, Craig, Harrington, McClay, Mill, Martin, Braithwaite and Poulton2003), but is unrelated to OFC volume; these may represent markers of different pathways, which increase the risk of developing depression.
Our examination of the relationship between APOE genotype and OFC volumes was based on the association between the APOE ε4 allele and risk of Alzheimer's disease (Saunders et al. Reference Saunders, Strittmatter, Schmechel, George-Hyslop, Pericak-Vance, Joo, Rosi, Gusella, Crapper-MacLachlan and Alberts1993; Strittmatter et al. Reference Strittmatter, Saunders, Schmechel, Pericak-Vance, Enghild, Salvesen and Roses1993) and findings of OFC changes in Alzheimer's disease (Janke et al. Reference Janke, de Zubicaray, Rose, Griffin, Chalk and Galloway2001; Matsuda et al. Reference Matsuda, Kitayama, Ohnishi, Asada, Nakano, Sakamoto, Imabayashi and Katoh2002). Contrary to our hypothesis, we found a trend for carriers of the APOE ε4 allele to exhibit larger OFC volumes; in subanalyses, this association was statistically significant only in the non-depressed control population. It is possible that this healthy group of cognitively intact, non-depressed older subjects may have some resilience factor that is protective against cognitive decline, modulating potential detrimental effects of the ε4 allele. As we did not find a statistically significant depression by the APOE genotype interaction term, it is possible this is a false-positive finding, reflective of the smaller number of control subjects exhibiting the ε4 allele. Had we controlled for multiple comparisons, or adjusted the level of statistical significance to account for these subgroup post-hoc analyses, this finding would not be considered statistically significant. This finding should be viewed cautiously and warrants further study.
In this expanded sample, WMH rated severity but not GMH rated severity is negatively associated with left and total OFC volume. This is in contrast to our previous report, which found a significant negative association between GMH severity and OFC volume (Lee et al. Reference Lee, Payne, Steffens, McQuoid, Lai, Provenzale and Krishnan2003); this difference may be partially due to the smaller sample size in the previous report. Despite this finding, there was only a statistical trend between OFC volume and the semi-automated measure of WMH volume. This discrepancy between our WMH measures may be explained by the observation that neither WMH rated severity nor WMH volume accounted for all of the observed variability in OFC volume. Moreover, visual rating scales are considered more subjective than volumetric methods, which may limit confidence in this measure. This relationship may have been additionally affected by our use of established, but lower-resolution, image acquisition parameters, which may have resulted in under-estimated subjects' true lesion burden, resulting in a Type II error.
An additional limitation is that neither of these lesion assessment methods allowed for localization of where lesions had occurred, but examined lesion burden in the entire brain. Our results may have been different had we examined exclusively frontal lobe lesion volumes. However, even this approach may be flawed; in addition to connections within the frontal lobe (Price, Reference Price1999), the OFC is connected to brain regions outside the frontal lobe, including the thalamus and striatum (An et al. Reference An, Bandler, Ongur and Price1998), the hippocampus and amygdala (Carmichael & Price, Reference Carmichael and Price1995; Price, Reference Price1999), and potentially the occipital lobe through the inferior frontal-occipital fasciculus (Mori et al. Reference Mori, Kaufmann, Davatzikos, Stieltjes, Amodei, Fredericksen, Pearlson, Melhelm, Solaiyappan, Raymond, Moser and van Zijl2002). Determining the true relationship between hyperintense lesions and OFC volume may require the refinement of advanced fiber tract mapping approaches (Mori et al. Reference Mori, Kaufmann, Davatzikos, Stieltjes, Amodei, Fredericksen, Pearlson, Melhelm, Solaiyappan, Raymond, Moser and van Zijl2002), wherein OFC connections can be identified in vivo, and examined for lesions occurring along their extent.
This provides a potential explanation for why WMH severity but not GMH severity was associated with OFC volume. Hyperintensities associated with OFC structure or function should hypothetically occur along white-matter fiber tracts or in subcortical gray-matter regions connecting to the OFC. These GMH changes may need to occur in specific subcortical nuclei to truly have an effect on the OFC. It is possible that white-matter tracts connected to the OFC may be more vulnerable to the development of hyperintense lesions than are these specific subcortical nuclei.
An additional study limitation is the need for further demographic data, such as a comprehensive measure of medical morbidity. Medical illness, which is associated with hyperintense lesions (Taylor et al. Reference Taylor, McQuoid and Krishnan2004), could be directly associated with OFC volume, similar to the observed association between coronary artery disease and hippocampal volume (Koschack & Irle, Reference Koschack and Irle2005). Likewise, differences in the proportion of people who were right- and left-handed between the two diagnostic groups could have influenced our results, although to our knowledge a relationship between handedness and OFC volume has not been established.
This study adds to the literature describing volumetric differences of the OFC in late-life depression. Although WMHs and APOE status may affect OFC volume, other medical and genetic factors may also contribute, and should be investigated as new genetic risk factors for late-life depression are identified. Future research is needed to investigate the relationship between OFC volume and both antidepressant response and cognitive decline.
ACKNOWLEDGMENTS
We thank Denise Fetzer and Kulpreet Singh for MRI processing. This study was supported by NIH grants P50 MH60451, K24 MH70027, and K23 MH65939.
DECLARATION OF INTEREST
None.