



1 Introduction
A perennial problem in characterising human language sound systems is how to differentiate a single complex segment from a sequence of simplex phonological segments. For example, the segment sequences in (1a) have the complex segment counterparts in (1b).
-
(1)


As a first approximation, our working definition of a complex segment is any segment that involves multiple independently controlled articulatory constrictions. This definition encompasses ‘secondary articulations’, ‘doubly articulated segments’ and ‘contour segments’, classes of segments that are sometimes given distinct phonological and/or phonetic characterisations (see e.g. Sagey Reference Sagey1986, Ladefoged & Maddieson Reference Ladefoged and Maddieson1996). We assume that a controlled constriction is a gesture, in the sense of Articulatory Phonology, at once both a unit of phonological contrast and an autonomous unit of articulatory control during speech production (e.g. Browman & Goldstein Reference Browman and Goldstein1986, Reference Browman and Goldstein1989, Pouplier Reference Pouplier and Aronoff2020).Footnote 1
By virtue of their containing the same sequence of IPA symbols – differentiated only by diacritics or superscripts – there is a general expectation that segment sequences such as those in (1a) are phonetically quite similar to their corresponding complex segments in (1b), which consist of essentially the same phonetic material. However, the temporal dimension of speech, only coarsely represented in the IPA, may provide cues to differentiating these phonologically distinct entities. For example, it has been suggested that, at least for consonant–approximant combinations, i.e. ‘secondary articulations’, that the total duration of the articulatory gestures is greater when they are organised phonologically into a sequence of segments than when they are organised into a single complex segment (Ladefoged & Maddieson Reference Ladefoged and Maddieson1996: 355). This type of duration-based diagnostic is only possible when there is a within-language contrast between complex segments and phonetically matched segment sequences, or through cross-linguistic comparison. Within-language comparison is highly restricted, as few languages provide evidence for contrast. Cross-linguistic comparison of segment durations is complicated by a number of other language-specific factors that can influence segment duration, including the information density of syllables (Coupé et al. Reference Coupé, Oh, Dediu and Pellegrino2019), the local predictability of a segment (Shaw & Kawahara Reference Shaw and Kawahara2019) and even a segment's average predictability (Cohen Priva Reference Cohen Priva2017). Moreover, each of these factors may potentially interact with the analysis of gestures as a complex segment or a segment sequence.
Another way that the temporal dimension of speech may relate to phonological structure is through coordination – the constituent articulatory gestures may be coordinated differentially in segment sequences than in complex segments. Our aim in this paper is to propose a specific instantiation of the coordination hypothesis and to test it using kinematic data, collected using electromagnetic articulography (EMA). As the main aim is to test whether different phonological entities, i.e. complex segments vs. segment sequences, are also differentiated by virtue of how the component articulatory gestures are coordinated in time, it is crucial that we establish independent phonological evidence for the distinction in question. We therefore proceed by first discussing some commonly used phonological diagnostics for segmenthood in §2. We then lay out our main hypotheses in §3. Through computational simulations, we make explicit our predictions for how the distinct coordination patterns we hypothesise for complex segments and segment sequences structure distinct patterns of variation in the kinematic signal. We then transition to an empirical test of the hypotheses. In §4, we review phonological evidence for treating palatalised consonants in Russian as complex segments (§4.1) and corresponding gestures in English as segment sequences (§4.2). We then briefly summarise past kinematic studies on these languages (§4.3). This sets the stage for a new experiment, described in §5 and reported in §6. The discussion in §7 takes up the results in light of the hypotheses. §8 briefly concludes.
2 Phonological diagnostics for complex segments
Complex segments and segment sequences show different phonological behaviour, and these differences have formed the primary basis for arguments supporting a structural distinction. The basic form of the argumentation is as follows: a pair of gestures is a single (complex) segment, as opposed to a segment sequence, if it shows the same phonological behaviour as other (simplex) segments.Footnote 2 The phonological behaviour supporting this type of argument can be classified into at least four types: (i) phonological contrast, (ii) phonological distribution, (iii) morphophonological patterning and (iv) language games. We briefly exemplify each type of argument.
2.1 Phonological contrast
First, some languages have a phonological contrast supported by the distinction between complex segments and segment sequences. This is the case for Polish affricates and stop–fricative sequences, as argued by Gussmann (Reference Gussmann2007). Pairs such as czysta [t͡ʃɨsta] ‘clean (fem)’ ~ trzysta [tʃɨsta] ‘three hundred’ in Polish are phonetically distinct but can also merge to the affricate at fast speech or in some dialects (Patrycja Strycharczuk, personal communication). The presence of minimal pairs differentiated by virtue of the complex segment vs. segment sequence distinction, an argument of phonological contrast, provides perhaps the clearest phonological evidence for complex segmenthood. It is worth noting, however, that part of this argument assumes that there is also a perceivable phonetic difference corresponding to the phonological difference between complex segments and sequences. Without this, the minimal pairs would be homophones.
2.2 Phonological distribution
Second, distributional facts have been used to differentiate between complex segments and segment sequences. In the absence of contrast, pairs of gestures have been argued to constitute complex segments in one language but segment sequences in another, based on distinct distributions across languages. Distributional arguments rest on the assumption that a phonological segment has autonomy in combinatorics, meaning that a segment can be combined with other segments freely, within the phonotactic constraints of the grammar. Following this assumption (and all else being equal), gestures corresponding to segments are expected to be equiprobable when phonotactically permissible. On the other hand, two gestures that co-occur frequently with each other in positions that paradigmatically tolerate single segments skew distributional statistics; the probability of each gesture given the other will be high if the gestures form complex segments. Thus, extreme non-equiprobability of this type, i.e. bidirectional conditional probability, presents an argument that the gestures comprise a single complex segment. That is, in the extreme case, if gestures only occur together, they are not distributionally independent and, therefore, not structurally independent – they are single complex segments instead of segment sequences. For example, in Fijian, nasals followed by oral stops in syllable onsets have been argued to be complex segments, i.e. monosegmental prenasalised stops, on the basis of such distributional facts (Geraghty Reference Geraghty1983, Maddieson Reference Maddieson1989). Gouskova & Stanton (Reference Gouskova and Stanton2021) develop a method of quantifying distributional statistics relevant to this argument for complex segmenthood, making use of the information-theoretic quantity of mutual information to identify complex segments, wherein high mutual information is taken to implicate complex segmenthood.
2.3 Morphophonological patterning
Third, morphophonological patterning can provide another line of argumentation for complex segmenthood. Both the targets and conditioning environments of phonological processes can provide evidence for the segmental structure of gestures. If pairs of gestures comprise single complex segments, then phonological processes that target single segments should not readily separate the gestures. Relatedly, complex segments define different phonological environments than segment sequences. Consider again [t͡ʃ] vs. [tʃ]. The environment preceding [tʃ] is the environment preceding a stop, [t], while the environment following [tʃ] is the environment following a fricative, [ʃ]. In contrast, the complex segment status of [t͡ʃ] establishes the same preceding and following environments. This distinction has implications for how a phonological process generalises across the lexicon; see, for example, discussion of ‘anti-edge effects’ (Lombardi Reference Lombardi1990) and ‘separability’ (Hualde Reference Hualde1988, Rubach Reference Rubach1994, Clements Reference Clements, Fujimura, Joseph and Palek1999).
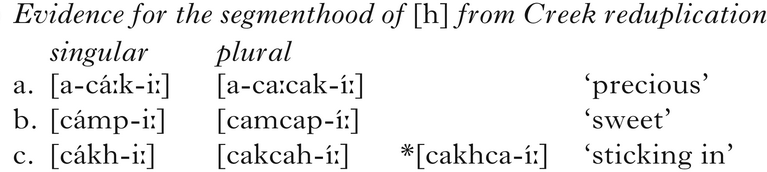
Reduplication in Creek provides an example of how separability can be used as evidence for segmenthood (Haas Reference Haas1977, Martin & Mauldin Reference Martin and Mauldin2000). While in many languages gestures transcribed as stop-[h] are a single segment, i.e. an aspirated stop, the morphophonology of Creek provides evidence that stop-[h] is a segment sequence. The plural in the language is formed by copying the first two segments of the root and inserting the copy before the last segment of the root, as in (2a, b). The form in (2c) provides the crucial argument: [kh] is broken up by reduplication, indicating that [k] and [h] count as separate segments instead of as a single gesturally ‘complex’ segment (data from Haas Reference Haas1977, Martin & Mauldin Reference Martin and Mauldin2000).
-
(2)
2.4 Language games
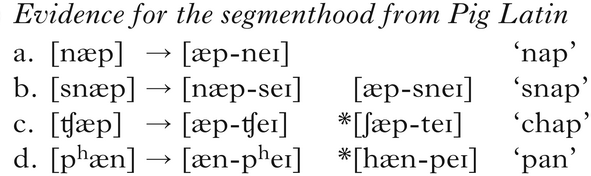
Fourth, language games have been a rich source of arguments for phonological structure (e.g. Sherzer Reference Sherzer1970, Hombert Reference Hombert, Ohala and Jaeger1986, Bagemihl Reference Bagemihl1989, Campbell Reference Campbell2020), including arguments for segmenthood. For example, Pig Latin is an English language game where the word-initial consonant or syllable onset is moved to the end of the word, as in (3a, b), and [eɪ] is then added to the end of the word (Davis & Hammond Reference Davis and Hammond1995, Barlow Reference Barlow2001, Vaux & Nevins Reference Vaux and Nevins2003, Idsardi & Raimy Reference Idsardi and Raimy2005). While there is systematic variation in whether speakers move the word-initial consonant or the first syllable onset of the word, as exemplified in (3b), the behaviour of /tʃ/ is consistent; it is always moved. Such behaviour suggests that /tʃ/ is monosegmental in English. Similarly, both the stop portion and the aspiration portion of aspirated stops are consistently moved, suggesting that they too form single segments in the language, in contrast to the gestures that form the same phonetic sequence, stop-[h], in Creek.
-
(3)
2.5 Summary
What is notable about the phonological arguments described above is that they refer only to the ‘behaviour’ of segments within phonological systems, relying on phonological argumentation to illustrate instances in which single complex segments behave differently from corresponding segment sequences. With the exception of contrast, the phonological arguments above are largely orthogonal to whether complex segments are also distinguished phonetically from corresponding sequences. Temporal properties of speech have often been raised as a promising place to look for phonetic differences, at least for some classes of complex segments. For example, Ladefoged & Maddieson (Reference Ladefoged and Maddieson1996) propose that total gesture duration may serve to differentiate the class of complex segments they describe as ‘secondary articulations’ from segment sequences consisting of a consonant and an approximant. However, this only works in the presence of contrast within a language or with a suitable cross-linguistic comparison, which introduces a number of complications in interpreting segment durations. For other cases, such as prenasalised stops, total gestural duration may fail to differentiate complex segments from sequences (Browman & Goldstein Reference Browman and Goldstein1986; cf. Maddieson Reference Maddieson1989, who also notes the importance of converging phonological evidence, and see Gouskova & Stanton Reference Gouskova and Stanton2021 for more recent discussion).
Our aim is therefore to pursue an alternative basis for the phonological distinction, one that is rooted in the concept of coordination (e.g. Bernstein Reference Bernstein1967, Fowler Reference Fowler1980, Kugler et al. Reference Kugler, Scott Kelso, Turvey, Scott Kelso and Clark1982, Turvey Reference Turvey1990, Browman & Goldstein Reference Browman, Goldstein, Port and van Gelder1995a). For recent arguments that the concept of coordination is appropriately abstract to express phonological relations, see Gafos et al. (Reference Gafos, Roeser, Sotiropoulou, Hoole and Zeroual2020). Coordination provides a temporal basis for the phonological distinction between complex segments and sequences with the potential to generalise across the complete range of cases, including complex segments classified as secondary articulations, double articulations and contour segments, as well as segments not necessarily considered ‘complex’ in antecedent literature, such as aspirated stops, nasals, liquids and rhotics. Evaluating coordination is not as straightforward as measuring phonetic duration, as differences in coordination are not necessarily detectable in phonetic duration. In the following section, we elaborate on this point, and illustrate how coordination structures variation in ways that can be productively assessed using phonetic data.
3 Hypotheses and predictions
Our hypothesis is that the gestures of complex segments are coordinated differently than the gestures of segment sequences, i.e. it is a difference in coordination that provides the basis for the phonological distinction. Specifically, we propose that the gestures of complex segments are coordinated with reference only to gesture onsets, while segment sequences are coordinated with reference to the offset of the first gesture and the onset of the second. This distinction is schematised in Fig. 1, in which (a) shows complex segment timing, while (b) shows a segment sequence. Before elaborating on this proposal and the predictions it makes for the phonetic signal, we lay out a few foundational assumptions on which the proposal rests.
Hypothesised gestural coordination patterns for (left) complex segments and (right) segment sequences. (a) and (b) show surface timing patterns with no positive or negative lag, so that the surface timing faithfully reflects the hypothesised coordination relations. (c) and (d) show surface timing patterns that deviate systematically from the hypothesised coordination relation, due to a positive or negative lag.

First, we assume that gestures are systems that exert forces on tract variables, effectively driving speech movements towards phonological goals over time; this is a foundational assumption of Articulatory Phonology (e.g. Browman & Goldstein Reference Browman and Goldstein1986), and one that we believe is uncontroversial, at least within Articulatory Phonology. Even as the theory of the gesture has undergone development in its dynamic formulation, e.g. from an autonomous linear dynamical system with step activation (Saltzman & Munhall Reference Saltzman and Munhall1989) to a linear dynamical system with continuous activation (Kröger et al. Reference Kröger, Schröder and Opgen-Rhein1995) to a non-linear dynamical system (Sorensen & Gafos Reference Sorensen and Gafos2016) to hybrid interacting dynamical systems (Parrell & Lammert Reference Parrell and Lammert2019), the assumption that speech movements are under the control of phonological goals has remained a constant working assumption.
The second assumption, which follows Gafos (Reference Gafos2002), is that coordination relations are expressed in terms of gestural landmarks. For the purposes of this paper, we reference only two such landmarks, the gesture onset landmark, which corresponds to the start of gesturally controlled movement, and the gesture offset landmark, which corresponds to the end of controlled movement. How many additional gestural landmarks are in principle available and what additional landmarks besides these two may also be required to describe the range of coordination patterns in a language or across languages is beyond the scope of this paper, but see Browman & Goldstein (Reference Browman and Goldstein1990, Reference Browman and Goldstein2000), Gafos (Reference Gafos2002), Borroff (Reference Borroff2007), Goldstein (Reference Goldstein, Gutiérrez-Bravo, Mikkelsen and Potsdam2011) and Shaw & Chen (Reference Shaw and Chen2019) for further discussion.
The gestural coordination patterns central to our main hypothesis are expressed in terms of gestural landmarks; another common approach is to express gestural coordination in terms of phase angle (Goldstein et al. Reference Goldstein, Nam, Saltzman, Chitoran, Fant, Fujisaki and Shen2009, Nam et al. Reference Nam, Goldstein, Saltzman, Pellegrino, Marisco, Chitoran and Coupé2009). Two gestures coordinated in-phase will start at the same time. For gestures coordinated anti-phase, the gestures will be sequential, such that the second gesture starts when the first ends.Footnote 3 The approach of coupling gestures according to phase angle enables the specification of a continuous range of coordination relations (Browman & Goldstein Reference Browman and Goldstein1990), which can be restricted by other principles, including (i) recoverability (coordination relations that do not allow gestures to be perceived will be dispreferred; Silverman Reference Silverman1997, Browman & Goldstein Reference Browman and Goldstein2000), and (ii) stability (Nam et al. Reference Nam, Goldstein, Saltzman, Pellegrino, Marisco, Chitoran and Coupé2009). Drawing on a theory of coordination developed from observations of manual movement data (Haken et al. Reference Haken, Scott Kelso and Bunz1985), Nam et al. (Reference Nam, Goldstein, Saltzman, Pellegrino, Marisco, Chitoran and Coupé2009) propose that in-phase and anti-phase modes of coordination are available without learning, and are therefore intrinsically stable.
Our hypothesis for complex segments is consistent with in-phase coupling, with the following caveat. We assume that landmark-based coordination relations can be stated with consistent lags, as per the phonetic constants in the models discussed by Shaw & Gafos (Reference Shaw and Gafos2015). For example, two gestures can be coordinated such that the onset of movement control is synchronised with a consistent positive or negative lag. Possible instantiations are shown in (c) and (d) in Fig. 1. (c) shows complex segment timing with positive lag; (d) shows gestures timed as a segment sequence with negative lag. Notably, owing to the influence of the positive or negative lag, the surface timing of (c) and (d) is identical, despite being coordinated on the basis of different articulatory landmarks.
Allowing for the theoretical possibility that gesture landmarks are coordinated with consistent positive or negative lag introduces a possible dissociation between the notion of coordination, which is central to our hypothesis, and observations of relative timing of articulatory movements in the kinematics. Accordingly, this also influences our approach to hypothesis testing. From this theoretical perspective, measures of gestural overlap alone may underdetermine temporal control structures, as illustrated in (c) and (d) in Fig. 1. The same surface timing could be derived from different combinations of coordination relations and lag values: in-phase timing with positive lag (c), anti-phase timing with negative lag (d) or even an intermediate timing relation, e.g. ‘c-centre’ timing, however derived, with no lag.Footnote 4 Crucially, however, these competing hypotheses about temporal control structure can be differentiated by considering relations between temporal intervals, defined on the basis of articulatory landmarks observable in the kinematic signal.
Our strategy for differentiating hypotheses is to consider how the temporal interval between gesture onsets varies with gesture duration. The basic strategy follows Shaw et al. (Reference Shaw, Gafos, Hoole and Zeroual2011) in evaluating how temporal coordination conditions covariation between phonologically relevant intervals. The competing hypotheses schematised above make different predictions about how the interval between gesture onsets will covary with gesture duration. For complex segments, variation in first gesture (G1) duration will have no effect on the interval between gesture onsets. This is because the onset of the second gesture (G2) is dependent only on the onset of G1. For segment sequences, however, any increase in G1 duration will delay the onset of G2, since the onset of G2 is dependent on the offset of G1.
Notably, the patterns of structure-specific covariation are independent of any constant positive or negative timing lag that may mediate between the hypothesised coordination relations and the observed timing in the kinematics. Covariation between G1 duration and the intergestural onset interval is predicted only for segment sequences, but not for complex segments. The reasoning is as follows: if the gesture onsets are timed directly, even with positive lag, then variation in G1 duration will be entirely independent of the interval between G1 onset and G2 onset. Longer G1 duration will not delay G2 onset, since in this case G2 onset is dependent only on G1 onset. If, on the other hand, G2 is timed to some gestural landmark later in the unfolding of G1, e.g. gesture offset, as in (d), then increases in G1 duration will delay the onset of G2, increasing the temporal lag between gesture onsets.
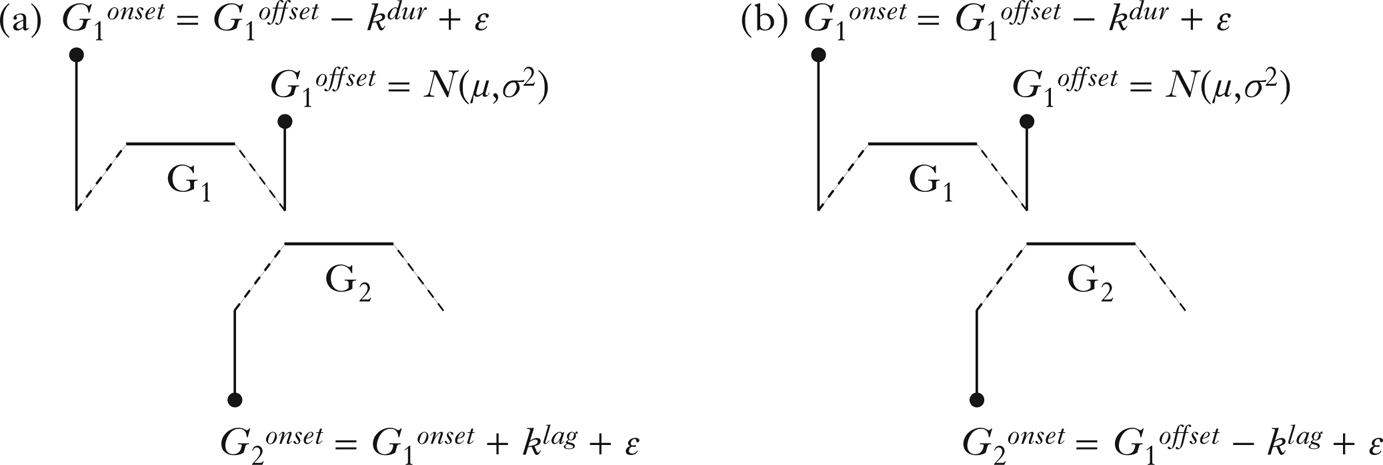
To make the above reasoning concrete, we coded simple mathematical models of the hypothesised timing relations and simulated patterns of covariation between G1 duration and the interval between gesture onsets. The simulation algorithm for each model is summarised in Fig. 2. The algorithms first sample the G1offset landmark from a Normal distribution defined by a mean, μ, and a variance, σ2. The particular parameters of this distribution have no bearing on the simulation results. For the simulation below, the mean was 500 and the variance was 400. The G1onset landmark was defined as preceding the G1offset landmark by a constant, k dur, and an error term, ε. The error term is normally distributed error. Together, the constant and the error term define a Normal distribution that characterises the duration of G1. For the simulations below, k dur ranged from 200 to 250, and the associated error term was 50. These parameters are identical for the two models. The key difference is in how the onset of G2 is determined. For the complex segment model, G2onset is timed to G1onset, plus a constant k lag and associated error term, ε. For the segment sequence model, G2onset is instead timed to G1offset. We report two sets of simulations based on the models in Fig. 2. In both sets of simulations, we gradually varied k dur, the constant that determines G1 duration, to evaluate how variation in G1 duration impacts the interval between gesture onsets.
Simulation algorithm for (a) complex segments and (b) segment sequences.
In the first set of simulation results, shown in (a) and (b) in Fig. 3, we implemented the models with no lag by setting the k lag parameter to 0. The associated error term was 100. In the second set of simulations, shown in (c) and (d), we set k lag to 100, keeping the error term at 100. A key illustration is that the pattern of covariation is the same across coordination patterns regardless of lag. For segment sequences there is a positive correlation; for complex segments there is no association between G1 duration and the difference in gestural onset times. Note, however, that even though the pattern of covariation remains constant across different lag values, there are other measures that change. For example, there is a clear difference in the interval between gestural onsets in (a) and (b). If there is no lag, i.e. k lag = 0, then complex segments have greater overlap between gestures than segment sequences. However, in (c) and (d), the difference in onset-to-onset lag between complex segments and sequences disappears. Thus, on the set of theoretical assumptions we have adopted, gestural overlap can successfully diagnose the difference between complex segments and segment sequences only under certain conditions. In contrast, the variation between temporal intervals is structured consistently regardless of variation in gestural overlap. Covariation between G1 duration and onset-to-onset lag provides a reliable diagnostic of coordination for all values of k lag.
Simulation results showing the gestural lag (y-axis) for (a) segment sequences (no lag), (b) complex segments (no lag), (c) segment sequences (negative lag), (d) complex segments (positive lag) as G1 duration (x-axis) varies. The grey line represents the least-squares linear fit to the data; the black line shows the mean lag.
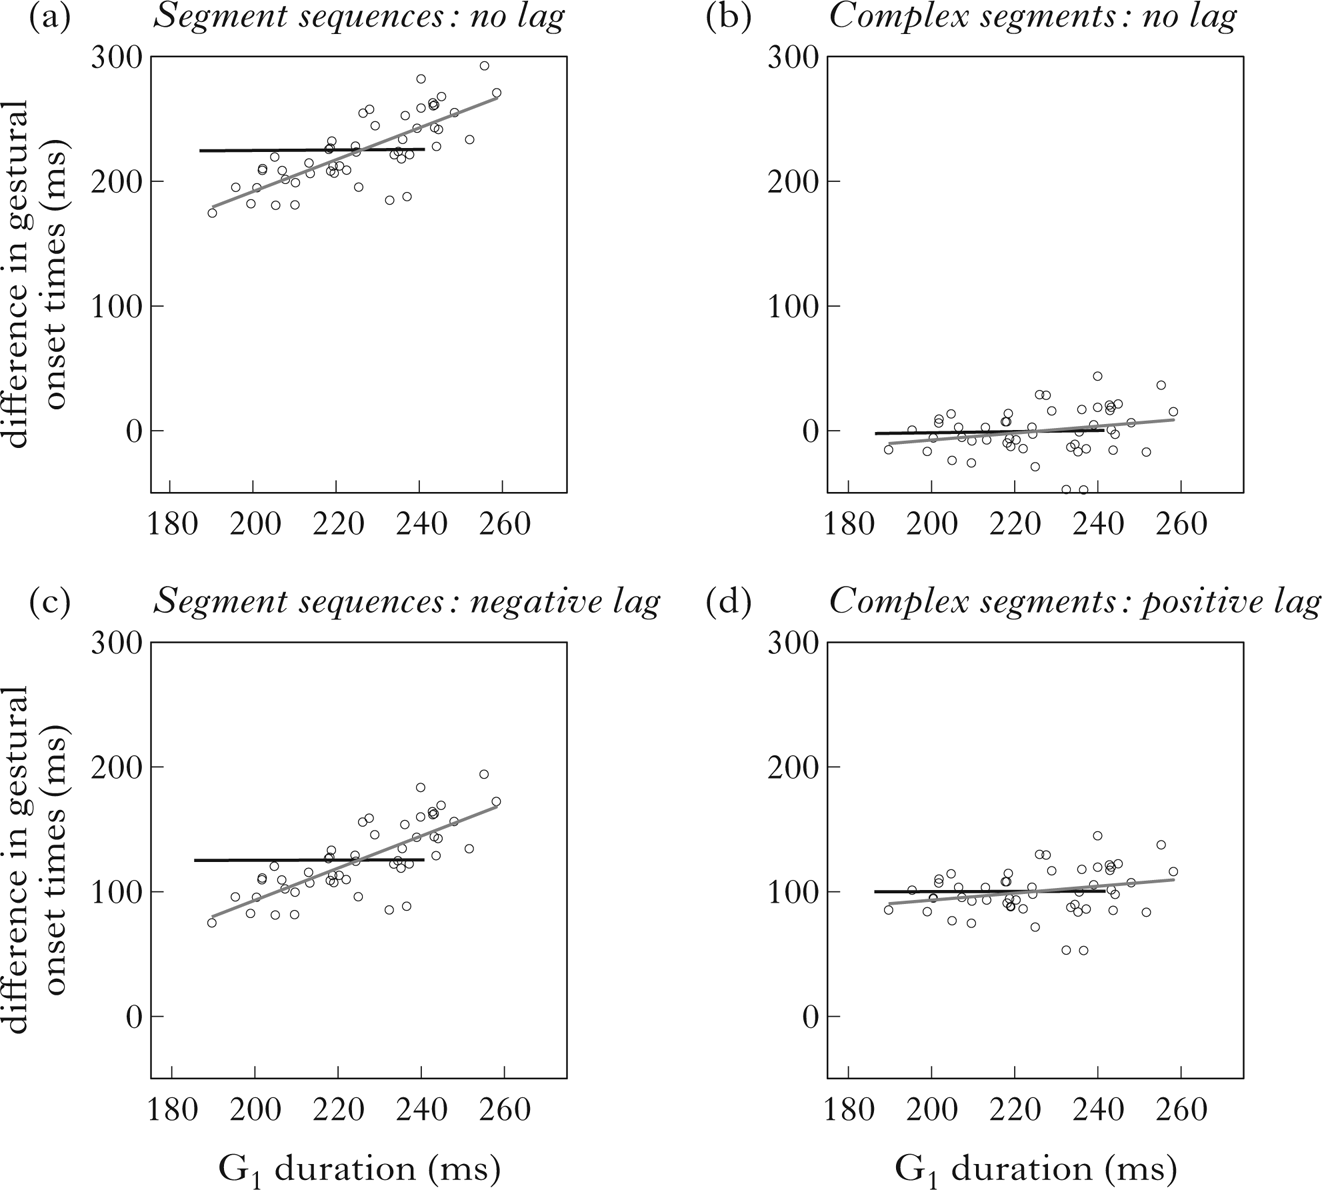
As the simulations illustrate, the coordination relations that we have hypothesised as a basis for the phonological distinction between complex segments and segment sequences can be differentiated in the kinematic signal because of how they structure variation in temporal intervals defined on gestural landmarks. We now turn to empirical tests of the hypothesis.
4 Test cases
As an empirical test of our hypothesis, we compare kinematic recordings of complex segments with closely matched segment sequences. Our complex segment case involves palatalised consonants in Russian, and our segment sequence case involves consonant–glide sequences in English. We selected this pair for comparison because they offer a clear case of similar gestures that show phonologically different behaviour across languages. Before describing the experimental methods for collecting kinematic data, we first review the phonological arguments and past phonetic work relevant to our hypothesis.
4.1 Russian palatalised consonants as complex segments
4.1.1 Evidence from phonological contrast
Palatalised consonants in Russian are unambiguously complex segments. There is a phonological contrast between Cʲ, i.e. palatalised consonants, and corresponding segment sequences, which we represent as C+j, both word-initially (4a) and word-medially (4b) (Avanesov Reference Avanesov1972, Timberlake Reference Timberlake2004).Footnote 5
-
(4)
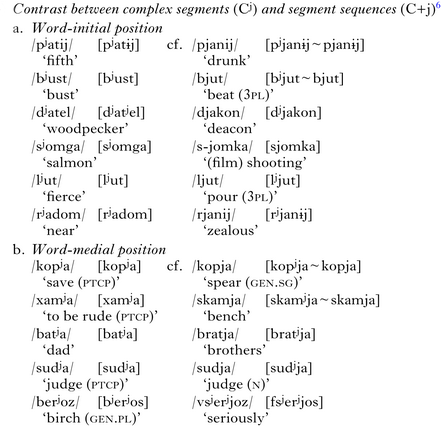
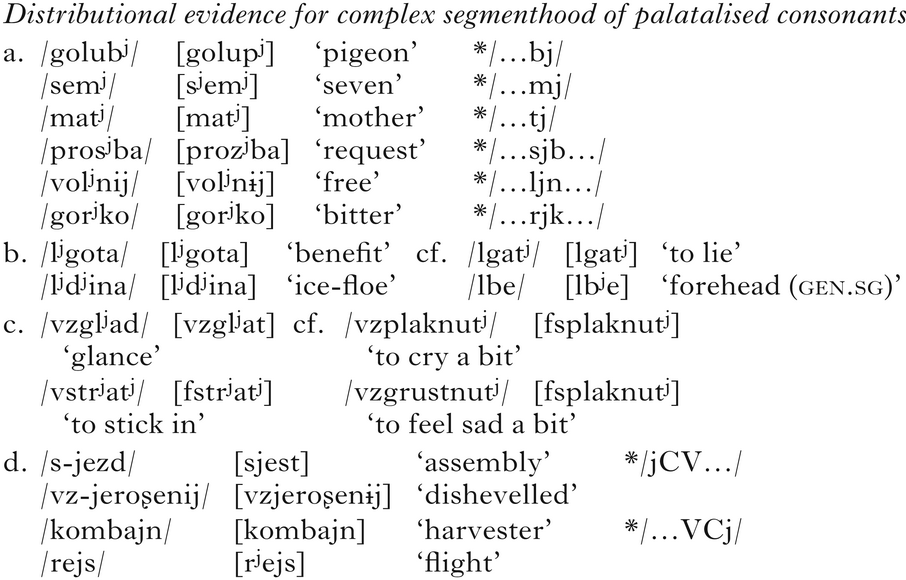
4.1.2 Distributional arguments
Palatalised segments can occur in the same environments as non-palatalised (simplex) segments, but C+j sequences are more restricted. For example, C+j sequences do not occur word-finally or preconsonantally, while palatalised consonants are common in these positions, as in (5a). Moreover, palatalised consonants occur in consonant clusters, both prevocalically and preconsonantally, as well as in both onset and coda positions. In these positions, palatalised consonants pattern together with non-palatalised counterparts with the same manner of articulation. For example, both palatalised and non-palatalised laterals occur as C1 in two-consonant onset clusters, where they can be followed by either palatalised or non-palatalised consonants (5b). Palatalised and non-palatalised liquids occur as C4 in four-consonant onset clusters, which are the maximally permitted onsets in the language (5c). Neither of these contexts permit C+j sequences. This is because the occurrence of the glide /j/ in clusters is limited to immediately prevocalic onset and immediately postvocalic coda positions only (5d).
-
(5)
4.1.3 Evidence from morphophonological patterning
Russian word formation and morphophonology provide some evidence that the C+j sequences are separable in ways that palatalised segments are not. Both C+j sequences and palatalised consonants can be either underlying or derived (see note 6). In the latter case, C+j sequences arise almost exclusively from heteromorphemic segment sequences C(ʲ)+j or C(ʲ)+i+V (e.g. /brat/ – /brat-ja/ [bratʲja] ‘brother (sg/pl)’, /knʲazʲ/ – /knʲazʲ-ja/ ‘prince (sg/pl)’). Morphologically derived palatalised consonants, on the other hand, are typically tautomorphemic, arising through palatalisation of a plain consonant by the following heteromorphemic segment – a front vowel or palatalising suffix (e.g. /brat/ – /brat-eʦ/ [bratʲeʦ] ‘brother (dim)’, /ʦel-ij/ [ʦelɨj] ‘whole’ – /ʦelʲ-n-ij/ [ʦelʲnɨj] ‘wholesome’). For many words, C+j sequences are broken up by a vowel in alternating forms, resulting in C+V+j sequences (e.g. /semja/ [sʲemʲja] ‘family’ – /semejnij/ [sʲemʲejnɨj] ‘legal’). This does not apply to palatalised segments, e.g. /vremʲa/ [vrʲemʲa] ‘time’ – /vremʲennij/ [vrʲemʲennɨj] ‘temporary’ (cf. */vremejnij/). In some sequences, /j/ shows morphophonemic alternations with the heteromorphemic vowel /i/ (/lj-u-t/ [lʲjut] ‘they pour’ – /lʲi-t/ ‘poured’) or exhibits lexical variation (/sudja/ [sudʲja] ‘judge’ – /sudʲija/ ‘judge (archaic)’, /marja/ [marʲja] (name)’ – /marʲija/ (name)). Palatalised consonants, on the other hand, do not alternate with sequences, but rather with single non-palatalised consonants (through either depalatalisation (e.g. /stepʲ/ [sʲtʲepʲ] ‘steppe’ – /stepʲ-n-oj/ [sʲtʲepnoj] ‘steppe (adj)’) or palatalisation (as shown above)).
When borrowing words with C+j sequences, Russian typically maps them onto the corresponding C+j sequences, rather than onto single palatalised consonants (e.g. /bjujik/ [bʲjujik ~ bjujik] from English Buick, /fjord/ [fʲjort ~ fjort] from Norwegian fjord, /papje-maʂe/ [papʲjemaʂe ~ papjemaʂe] from French papier mâché, /kurjoz/ [kurʲjos] from German kurios). Palatalised consonants, in contrast, tend to be used to render single consonants occurring before front vowels, e.g. /bʲitnʲik/ [bʲitʲnʲik] from English beatnik, /bʲuro/ [bʲuro] from French bureau, /fʲon/ [fʲon] from German Föhn. The distinct patterns of borrowing suggest that there are clear phonetic differences between Cʲ and C+j in Russian, and that native speakers are sensitive to them. This has been confirmed in perceptual studies (Diehm Reference Diehm1998, Babel & Johnson Reference Babel, Johnson, Trouvain and Barry2007): Russian listeners were found to rate the pairs C+j+V and Cʲ+V as fairly distinct from each other perceptually (albeit less distinct than C+j+V or Cʲ+V from C+V).Footnote 7
4.1.4 Evidence from Russian language games
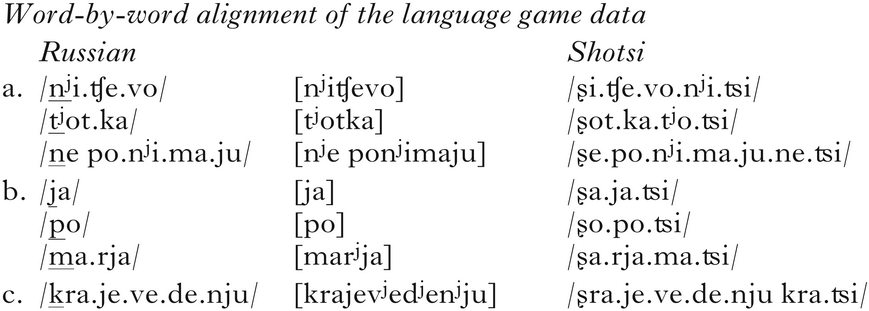
To round off the phonological arguments for Russian, there is also some evidence from language games in which palatalised consonants are treated as single segments, not segment sequences. This is, for example, the case in a children's secret language shotsi, described in Vinogradov et al. (Reference Vinogradov, Ivanova and Gindin2005).Footnote 8 The language game has the following rules. In words beginning with a single consonant or a cluster, the first consonant is replaced by the fricative /ʂ/ (e.g. /ja/ → /ʂa/, /nʲi/ → /ʂi/, /po/ → /ʂo/, /kra/ → /ʂra/). The original (C)(C)V then moves to the end of the word (e.g. /ja/ → /ʂa.ja/), and another syllable, /ʦi/, is added right after it (e.g. /ja/ → /ʂa.ja.ʦi/). The sentence /ja nʲi.ʧe.vo ne.po.nʲi.ma.ju po kra.je.ve.de.nʲju/ ‘I don't understand anything about Local History (school subject)’ is realised in the language game as /ʂa.ja.ʦi ʂi.ʧe.vo.ne.ʦi ʂe.po.nʲi.ma.ju.nʲi.ʦi ʂo.po.ʦi ʂra.je.ve.de.nju.kra.ʦi/, and /tʲot.ka ma.rja/ ‘Aunt Maria’ is realised as /ʂot.ka.tʲo.ʦi.ʂa.rja.ma.ʦi/. The language game, as illustrated by these two transformations, provides additional evidence for the complex segment status of palatalised consonants in Russian.
To highlight the evidence provided by the language game, the Russian forms and the corresponding language game transformations are given in (6). The portion of each original Russian word that is substituted by /ʂ/ in the language game is underlined. The key evidence provided by the language game comes in the fact that palatalised consonants in (a) pattern with the single (simplex) segments in (b), in being substituted by the single segment [ʂ]. When a Russian word starts with a segment sequence, as in (c), only the first of the two segments is substituted.
-
(6)
In sum, Russian palatalised consonants present a clear case of complex segments, following our definition. Phonological evidence supporting this analysis includes contrast, distributional facts and morphophonological alternations, as well as language games.
4.2 English consonant–glide gestures as segment sequences
As a control case for Russian complex segments, we opted for segment sequences in English consisting of a consonant and a palatal glide: C+j. As mentioned earlier, phonological contrast sometimes distinguishes complex consonants from consonant sequences. However, English does not contrast [Cj] and [Cʲ]. Furthermore, the absence of contrast by itself does not inform us of the segmental structure of the observed sequence. C+j could in principle be [Cj] or [Cʲ]. Therefore, in what follows we provide evidence from morphophonology and language games to establish that the gestures composing these sequences are organised phonologically as two segments, i.e. [Cj].
4.2.1 Evidence from morphophonological patterning
One piece of evidence for C+j as a [Cj] sequence in English comes from an affixation pattern. The pattern, adopted from Yiddish and termed ‘shm-fixed segmentism’ involves reduplication and segment substitution to denote a sort of dismissive attitude towards the targeted word (Feinsilver Reference Feinsilver1961, McCarthy & Prince Reference McCarthy and Prince1986, Nevins & Vaux Reference Nevins and Vaux2003). In this morphophonological pattern, when there is a single word-initial consonant, the initial consonant is typically replaced by [ʃm-], as can be seen in (7a). This is true even when the initial consonant is an aspirated stop (7b) or an affricate (7c), which suggests that both of them are single segments in English. When there is an initial consonant sequence, either the initial consonant or the whole syllable onset can be replaced by [ʃm-] (7d). Most relevant to us is the fact that, in words that begin with [Cj] sequences, the first consonant can be replaced by [ʃm] to the exclusion of the glide (7e, f), which suggests that the two are independent segments. Note, as with other prevocalic consonant sequences, such as [br] in (7d), the whole [Cj] glide can also be replaced by [ʃm]. In this respect as well, the behaviour of [Cj] parallels other segment sequences in its morphophonological patterning (data from Nevins & Vaux Reference Nevins and Vaux2003 and the authors).
-
(7)
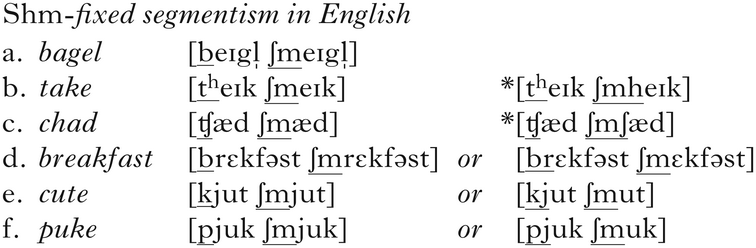
4.2.2 Evidence from English language games
Another piece of evidence for the bisegmentality of [Cj] sequences in English comes from the language game Pig Latin, introduced in (3). As mentioned earlier, in Pig Latin, a word-initial consonant or syllable onset is moved to the end of the word, and [eɪ] is then added to the dislocated segment. Most relevant to current interests is the behaviour of word-initial phonetic sequences of [Cj] in the variant of the game that Davis & Hammond (Reference Davis and Hammond1995) call Dialect A.Footnote 9 In this variety, the initial consonant in words with an initial [Cj] sequence can be separated from the glide, as in (8). This suggests that the consonant and the glide are separate segments in the language.
-
(8)
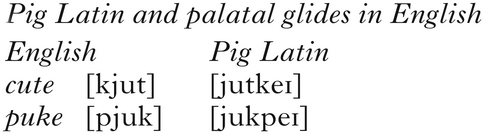
Similar arguments for the separability of phonetic [Cj] sequences can be made on the basis of other language games, e.g. ‘The name game’ (Davis & Hammond Reference Davis and Hammond1995), Ibenglish (Idsardi & Raimy Reference Idsardi and Raimy2005) and Ubbi Dubbi (Vaux Reference Vaux, Goldsmith, Riggle and Yu2011).
4.3 Past results on English and Russian timing
The phonetic aspects of English and Russian are relatively well-studied. There are detailed phonetic accounts of segment sequence timing in both languages (e.g. Davidson & Roon Reference Davidson and Roon2008, Pouplier et al. Reference Pouplier, Marin, Hoole and Kochetov2017 on Russian; Umeda Reference Umeda1977 on English), as well as phonetic descriptions of palatalisation (e.g. Diehm Reference Diehm1998, Kochetov Reference Kochetov, Goldstein, Whalen and Best2006, Reference Kochetov2013, Suh & Hwang Reference Suh and Hwang2016 on Russian; Zsiga Reference Zsiga, Connell and Arvaniti1995 on English) and direct comparisons of the languages (Zsiga Reference Zsiga2000).
The most directly relevant research comparing Russian and English is that of Shaw et al. (Reference Shaw, Durvasula and Kochetov2019), who test the hypotheses put forward in the current paper using already collected data, including a reanalysis of Russian data first reported in Kochetov (Reference Kochetov, Goldstein, Whalen and Best2006) and an analysis of English data from the Wisconsin X-Ray Microbeam Speech Production Database (Westbury Reference Westbury1994). The Russian data compared the consonant sequence /br/ with the palatalised labial /pʲ/. Variation in onset-to-onset lag, defined as the interval from the onset of G1 to the onset of G2, as a function of G1 duration (/b/ for /br/ and /p/ for /pʲ/), is plotted in Fig. 4a. Consistent with the simulations in Fig. 3, gesture lag increased with stop-consonant duration for /br/ (Fig. 4a: left panel), but not for the complex segment /pʲ/ (Fig. 4a: right). Shaw et al. (Reference Shaw, Durvasula and Kochetov2019) reported on the /bj/ sequence at the onset of the English word beautiful from 20 speakers. The results, plotted in Fig. 4b, are consistent with our simulations for segment sequences. For English, as G1 duration increases, the lag between gestures also increases.
Data showing the gestural lag (y-axis), as a function of G1 duration (x-axis). (a) Russian /br/ in /brat/ (left) and /pj/ in /pjapi/ (right) (data from 3 speakers); (b) English /bj/ in beautiful (data from 20 speakers). Figures adapted from Shaw et al. (2019).

Taken together, the results in Fig. 4 are consistent with the main hypothesis of this paper (see Fig. 1) that the gestures of complex segments are coordinated based on gesture onsets, while the gestures of segment sequences are timed sequentially. However, the data provide only an imperfect test of the hypothesis, for a number of reasons. In the Russian data, /br/ and /pʲ/ differ in numerous ways: for example, /br/ was extracted from a real word while /pʲ/ was extracted from a nonsense word, and /br/ was phrase-initial while /pʲ/ was phrase-medial. More fundamentally, the voicing of the labial stop differed, and the gestures involved in the production of /r/, an apical trill, are distinct from those involved in the production of /ʲ/, a palatal glide. For the trill, the tongue body is positioned to support tongue tip raising towards the alveolar ridge; for the palatal glide, the tongue body rises towards the palate. It is of course possible that abstract timing relations generalise across end-effectors (tongue tip, tongue blade, lips, etc.), such that it is perfectly appropriate to compare the relative timing of the lips and tongue tip in /br/ with the lips and tongue body for /pʲ/. After all, quite different articulators enter into qualitatively similar coordination patterns in numerous cases. For example, in Moroccan Arabic, rising sonority consonant clusters, e.g. /kfl/, show qualitatively similar patterns of coordination to falling sonority clusters, e.g. /msk/ (Shaw et al. Reference Shaw, Gafos, Hoole and Zeroual2011); see also Ruthan et al. (Reference Ruthan, Durvasula, Lin, Hout, Mai, McCollum, Rose and Zaslansky2019) and Durvasula et al. (Reference Durvasula, Ruthan, Heidenreich and Lin2021) on Jazani Arabic. Similarly, in Romanian, stop-initial clusters show qualitatively similar patterns of timing regardless of the place of articulation of C1, e.g. /ksenofob/ ‘xenophobe’ – /psalm/ ‘psalm’ (Marin Reference Marin2013). However, there are of course other cases in which the timing of gestures varies systematically across contexts, with differences possibly conditioned by the magnitude of movements (e.g. Brunner et al. Reference Brunner, Geng, Sotiropoulou and Gafos2014) or coarticulatory resistance (Pastätter & Pouplier Reference Pastätter and Pouplier2017).
For these reasons, the ideal test of our hypothesis, based on temporal coordination, would better control for segmental/prosodic context, as well as the articulators involved in the gestures. The cross-language comparison between English /bj/ and Russian /pʲ/ involves similar places of articulation, but the stops differ in voicing, which is known to influence timing, at least in some languages (Bombien et al. Reference Bombien, Mooshammer and Hoole2013). Additionally, the source of consonant duration variation differs in the two datasets. The Russian data comes from three speakers producing two items four to five times each – variation in consonant duration comes from item, speaker and repetition. In contrast, the English data comes from many more speakers, producing just one repetition of one item, so that all of the variation in consonant duration comes from interspeaker variation. At the level of description above, our hypothesis does not depend on the source of variation. Whether variation enters into the data from differences across speakers, items, repetitions or even other factors, such as speech rate or prosodic context, the predicted patterns of covariation, i.e. those in Fig. 3, are the same. However, these models are exceedingly simple. Greater control over the experimental materials, including the segments involved in coordination, the prosodic position of the target items and the sources of variability, would provide additional clarity.
In what follows, we report on a new experiment designed to add to past work, eliciting closely matched gestures in Russian, where they constitute complex segments, and in English, where they constitute segment sequences.
5 Method
5.1 Participants
Four native speakers of Russian (3 male, 1 female) and four native speakers of English (2 male, 2 female) participated in the study. All speakers were in their twenties at the time of recording and living in the United States. The Russian speakers were born in Russia and moved to the United States as adults.
5.2 Materials
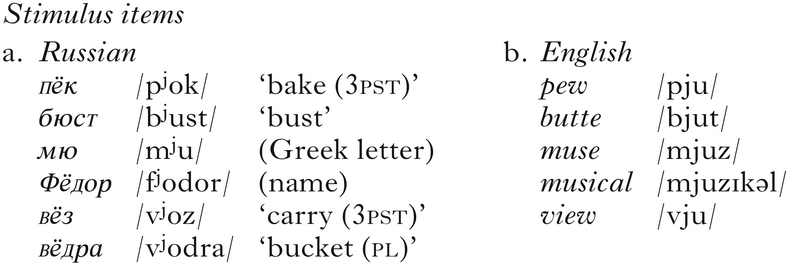
The target Russian materials consisted of the six words shown in (9a). All words begin with palatalised labial consonants followed by a back vowel, either /u/ or /o/. The English items begin with a labial consonant and a palatal glide, and are followed by the vowel /u/. The Russian words were read in the carrier phrase: [ʌˈna _ pəftʌˈrʲilʌ] ‘She repeated _’. In this phrase, the target word is preceded by /a/ and followed by /p/. The English words in (b) were read in the carrier phrase It's a _ perhaps. In this phrase, the target word was preceded by a reduced vowel and followed by /p/. The target words were randomised both with a set of fillers, which did not contain palatal gestures, and with words included for other experiments.
-
(9)
5.3 Procedure
Articulatory movements were recorded using the NDI Wave Speech Production system, which uses electromagnetic articulography to track small sensors, approximately 3 mm in diameter. The sensors were attached to the tongue, lips and jaw, using high-viscosity periacryl. Three sensors were attached along the sagittal midline of the tongue. The most posterior of these three lingual sensors was attached on the tongue body, approximately 5 cm behind the tongue tip. The most anterior lingual sensor was placed approximately 1 cm behind the tongue tip. A third sensor was placed on the tongue blade, halfway between the sensors on the tongue tip and tongue body, approximately 3 cm behind the tip. We refer to this sensor as the tongue blade (TB) sensor. Sensors were also attached to the upper and lower lips, just above and below the vermillion border. To track jaw movement, another sensor was placed on the gum line just below the lower incisor. We also attached sensors on the left and right mastoids and on either the nasion or nose bridge. These last three sensors, the left and right mastoids and the nasion/nose bridge, were used to computationally correct for head movements in post-processing.
Once the sensors were attached, participants sat next to the NDI Wave field generator and read the target words in the carrier phrases from a computer monitor, located 50 cm outside of the EMA magnetic field. On each trial, the target word flashed on the screen for 500 ms, and then was shown in the carrier phrase. The target word embedded in the carrier phrase remained on the screen until the participant read the word and the experimenter pressed a button to accept the trial. The purpose of displaying the target word before eliciting it in the carrier phrase was to promote fluent pronunciation of the target word in its carrier phrase, and in particular to avoid a pause immediately before the target word. Speech acoustics were recorded concurrently at 22 kHz, using a Sennheiser condenser microphone placed outside of the EMA magnetic field.
After completing the experimental trials, we recorded the occlusal plane of each participant and the location of the palate. The occlusal plane was recorded by attaching three NDI Wave sensors to a rigid object – a protractor – and having participants hold it between their teeth. The sensors on the protractor were attached in an equilateral triangle configuration, and the protractor was oriented so that the midsagittal plane of the participant, as indicated by the sensors on the nasion and lips, bisected the triangle on the rigid object. Palate location was recorded using the NDI Wave palate probe. Participants traced the palate using the probe while the position of the probe was monitored using the real-time display of the NDI Wave system. The palate tracings provided a point of reference for visualising the data, but did not enter into any quantitative analysis of the data.
The above experimental procedure was approved by Yale University's internal review board. Each participant completed between 15 and 30 blocks, yielding a total of 1090 tokens for the analysis.
5.4 Post-processing
The data was computationally corrected for head movements, and rotated to the occlusal plane so that the bite of the teeth served as the origin of the spatial coordinates. To eliminate high-frequency noise, all trajectories were then smoothed using Garcia's (Reference Garcia2010) robust smoothing algorithm. Finally, we calculated a lip aperture trajectory, as the Euclidean distance between the upper and lower lip sensors.
5.5 Analysis
The post-processed data was visualised in MVIEW, a Matlab-based program developed by Mark Tiede at Haskins Laboratories (Tiede Reference Tiede2005). We used the lip aperture (LA) trajectory to identify labial gestures in stops, the lower lip trajectory (LL) to identify labial gestures in fricatives and the tongue blade (TB) trajectory to identify palatal gestures.
Figure 5 shows one example of a labial gesture. The upper panel shows the positional signal, which in this case is the vertical position of the lower lip. The lower panel shows the corresponding velocity signal. Four gestural landmarks are labelled on the positional signal. Gestural landmarks were parsed with reference to the velocity signal using the findgest algorithm in MVIEW. Specifically, the onset and target landmarks were labelled at 20% of peak velocity in the movement toward constriction. Release and offset landmarks were labelled at a 20% threshold of peak velocity in the movement away from constriction. We used these threshold values to index gestural landmarks instead of, for example, velocity minima because we were particularly interested in the temporal dimensions of the trajectories. Although the articulators rarely, if ever, stop moving during spontaneous speech, they are often slowed substantially when they near phonologically relevant targets, giving the appearance of a ‘plateau’ in the trajectory; see also the plateau at the constriction phase in the schematic diagrams in Figs 1 and 2. During the plateau, small variation in velocity, even of the order of magnitude of measurement error <1.0 mm (Berry Reference Berry2011), could have a substantial impact on the timing of the landmark. Defining landmarks as percentages of peak velocity, i.e. before velocity becomes too low, helps to avoid this situation, essentially providing more reliable indices of gestural landmarks. Palatal gestures were parsed using the tangential velocity (based on movement in three dimensions) of the TB sensor. Since the lip aperture trajectory is a Euclidean distance (in 3D space), it is unidimensional.
Example of gesture parse for a labial gesture. The gestural landmarks (onset, target, release and offset) are labelled at 20% thresholds of peak velocity.

Gestural landmarks, parsed as described above for the labial and palatal gestures of all target words, were used to calculate two intervals, which serve as the primary continuous measures in the analysis. These two intervals are schematised in Fig. 6. G1 duration was calculated by subtracting the timestamp of the onset of the labial gesture from the offset of the labial gesture. Accordingly, G1 duration, a measure of intragestural timing, is always positive. Appendix A includes additional analyses using different measures of G1 duration, which produce essentially the same main result (see also note 3).Footnote 10
Schematic depiction of the two intervals, G1 duration and onset-to-onset lag, entering into the analysis. G1 is the labial gesture and G2 the palatal gesture.

The second interval, onset-to-onset, was calculated by subtracting the onset of the labial gesture (G1) from the onset of the palatal gesture (G2), providing a measure of the temporal lag between the two gestures. Note that when the two gestures start at the same time, the onset-to-onset interval is zero, i.e. there is no lag. Likewise, when the palatal gesture starts before the labial gesture, the onset-to-onset interval will be negative; otherwise, the onset-to-onset interval will be positive. As positive values for the onset-to-onset interval are the most common scenario, we refer to the onset-to-onset measure as lag, i.e. onset-to-onset lag. Similarly, due to a tendency for the labial gesture to precede the palatal gesture, we refer to the target labial gesture in our materials as G1, and the target palatal gesture as G2. Before proceeding with statistical analysis, we removed outliers that were greater than three standard deviations from the speaker-specific mean value of either G1 duration (8 tokens removed; 0.7% of the data) or onset-to-onset lag (14 tokens removed; 1.2% of the data).
Our analysis of the data tests the hypothesis schematised in Fig. 1, embodied in the stochastic models of Fig. 2 and exemplified by simulations in Fig. 3. As G1 duration varies, we ask whether onset-to-onset lag will positively covary, as predicted by the segment sequence hypothesis, or whether these intervals will be statistically independent, as predicted by the complex segment hypothesis. We therefore treat onset-to-onset lag as a dependent variable, and evaluate whether G1 duration is a significant predictor. Besides G1 duration, there are other factors that could condition variation in onset-to-onset lag. Most notably, these include speaker-specific factors, such as preferred speech rate, and item-specific factors, such as the lexical statistics and usage patterns of the specific items in our study. We factored these considerations into the analysis by including random effects for Speaker and Item in a linear mixed-effects model, which we fitted to the data using the lme4 package in R (Bates et al. Reference Bates, Maechler and Bolker2014). Random intercepts were fitted for Speaker and Item. We calculated the residual deviation from our best-fitting model, and eliminated outliers to the model that were greater than three standard deviations from the mean (following Baayen & Milin Reference Baayen and Milin2010), resulting in the elimination of 18 additional outliers (1.7% of the data). The nested models were then re-fitted to this dataset, consisting of 1045 tokens across speakers.
To a baseline model, consisting of random intercepts for Speaker and Item, we added fixed factors of interest incrementally. First, we added G1 duration, then Language (English vs. Russian, with Russian as the reference level), and finally the interaction between G1 duration and Language. This gives a set of four nested linear mixed-effects models. We evaluated the significance of each fixed factor through model comparison, considering whether the addition of the fixed factor provides a significant increase in the likelihood of the data and whether that increase is justified by the increased complexity of the model, measured according to the Akaike Information Criterion (AIC). The AIC measures model fit while controlling for overparameterisation; a lower AIC value suggests a better model (Akaike Reference Akaike1974, Burnham et al. Reference Burnham, Anderson and Huyvaert2011). The fixed factor of primary interest for our main hypothesis is the interaction term: G1 duration × Language. This is because G1 duration is predicted to have a positive influence on onset-to-onset lag for English, since the target gestures behave phonologically as sequences (see §4.2 for arguments for English), but not for Russian, since the target gestures in Russian behave phonologically as complex segments (see §4.1 for arguments for Russian).
6 Results
Our main analysis of the data tests the prediction of the stochastic models, exemplified by the simulations in Fig. 3. We ask whether the onset-to-onset interval will covary with G1 duration, as predicted by the segment sequence hypothesis, or whether these intervals will be statistically independent, as predicted by the complex segment hypothesis. Since our data is drawn from English, where the target gestures form segment sequences, and Russian, where the target gestures form complex segments, we hypothesise that the influence of G1 duration on onset-to-onset lag will differ across languages.
Before moving to the main results, involving covariation between G1 duration and onset-to-onset lag, we first examine the continuous trajectories of relevant articulators. Figure 7 provides a representative token, zooming in on the target gestures /b/ and /j/, as produced in the English word butte. Panel (a) shows the waveform. Panel (b) shows the lower lip, which is the primary determinant of the lip aperture trajectory for this speaker, and (c) shows the lip aperture trajectory, which was used to parse the labial gesture. Panel (d) shows the tongue blade trajectory, which was used to parse the palatal gesture. For simplicity of display, only the vertical trajectories of the lower lip and tongue blade are shown. Since lip aperture is a Euclidean distance, it is inherently one-dimensional. The onset and offset landmarks for the labial and the onset of the palatal gesture are also labelled. These labels show that the onset of the palatal gesture in Fig. 7 occurs after the onset of the labial gesture, but well before the offset of the labial gesture. Unsurprisingly, the palatal gesture starts during the labial closure. However, it is not possible to test our hypothesis on the basis of a single token. That is, we currently do not have a method that would allow us to determine whether the control structure (dynamics) behind the kinematic data for a single token, such as this one, triggers the onset of the palatal gesture at the onset of the labial gesture (per the complex segment hypothesis) or whether the onset of the palatal gesture is instead triggered by the offset of labial gesture (per the segment sequence hypothesis). The token in Fig. 7 is consistent with both hypotheses: complex segment timing with positive lag, as in Fig. 1c, or segment sequence timing with negative lag, as in Fig. 1d.
Example of a token of English butte in the sentence It's a butte perhaps. (a) shows the waveform, (b) the lower lip trajectory in the vertical dimension, (c) the lip aperture trajectory and (d) the tongue blade trajectory, also in the vertical dimension. The three gestural landmarks relevant to calculating the intervals of interest (cf. Fig. 5), are indicated. In this token, the onset of the palatal gesture, /j/, occurs after the onset of the labial gesture, /b/, but well before the offset of the labial gesture.
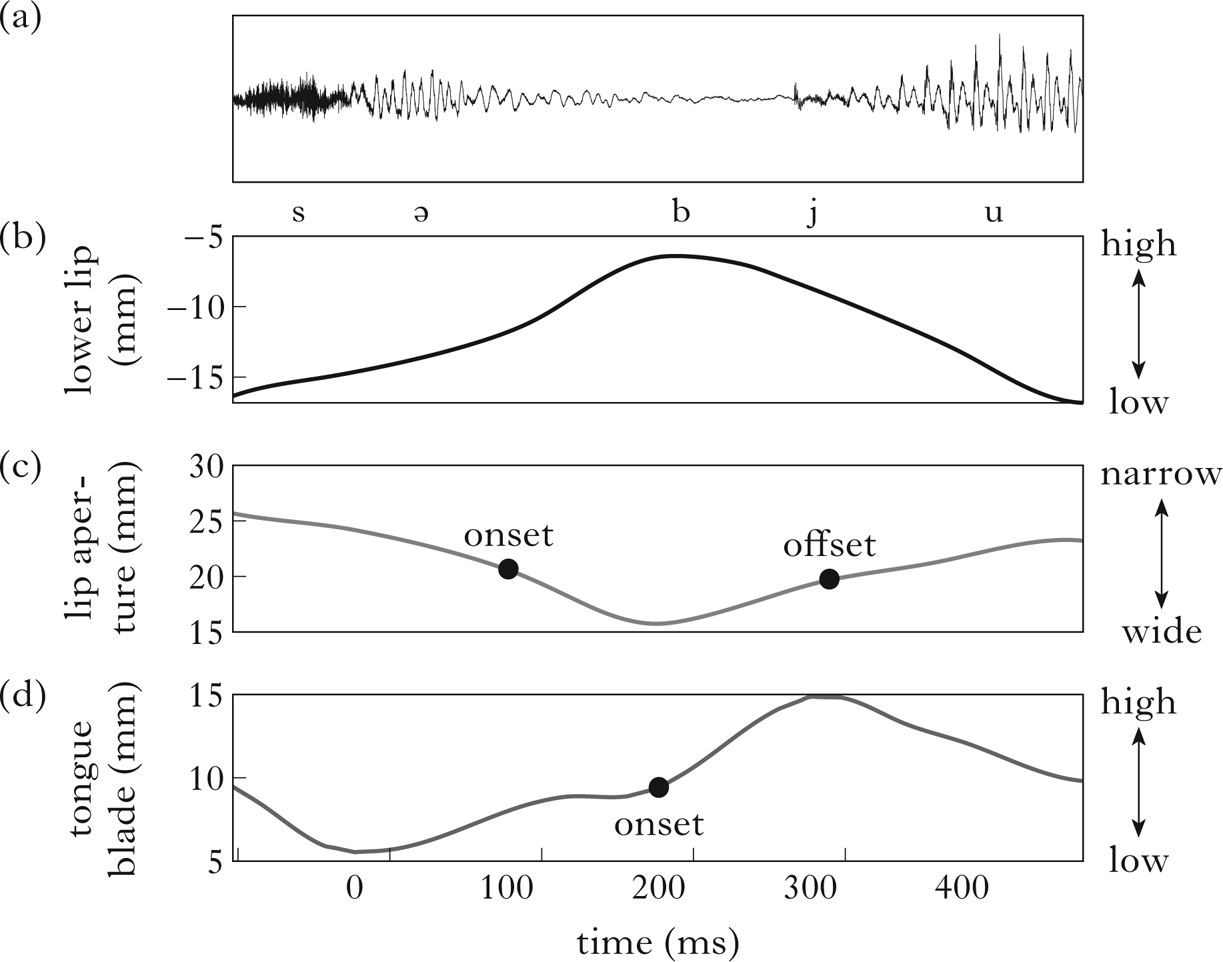
Fig. 8a illustrates variability across kinematic trajectories for the token butte /bjut/, as produced by the four English speakers in the study. The figure plots the lip aperture (LA) trajectory in the upper panels and the tongue blade (TB) trajectory in the lower panels. Each trajectory is a different colour; the dashed black line is the average trajectory. The figure plots trajectories from 100 ms before the onset landmark of the lip aperture gesture to 500 ms following this landmark, a temporal window of 600 ms. This window is long enough to observe the labial and palatal gestures for all tokens. The level of variability in both the timing and magnitude of the gestures varies by speaker. For E2, most tokens occur tightly clustered around the mean; E1 shows more variability, and E3 and E4 even more. Across speakers, the fall in the LA aperture trajectory, indicating the closing of the lips tends to slightly precede the rise of the TB for the palatal gesture. To facilitate comparison, vertical grey lines indicate when the LA trajectory starts to fall (based on the average) and when TB starts to rise (also based on the average).
(a) Tokens of /bjut/ butte from each English speaker (E1–4); (b) tokens of /bjust/ ‘bust’ from each Russian speaker (R1–4). Each individual line represents the trajectory of a token. The thick dashed black line represents the average trajectory for each speaker. The top panels show the lip aperture (LA) trajectory. The bottom panels show the tongue blade (TB) in the vertical dimension. The time window of 600 ms extends from 100 ms before the onset of lip aperture movement to 500 ms after the onset of lip aperture movement. The vertical grey lines indicate the onset of LA lowering and the onset of TB raising, both based on the average trajectory.
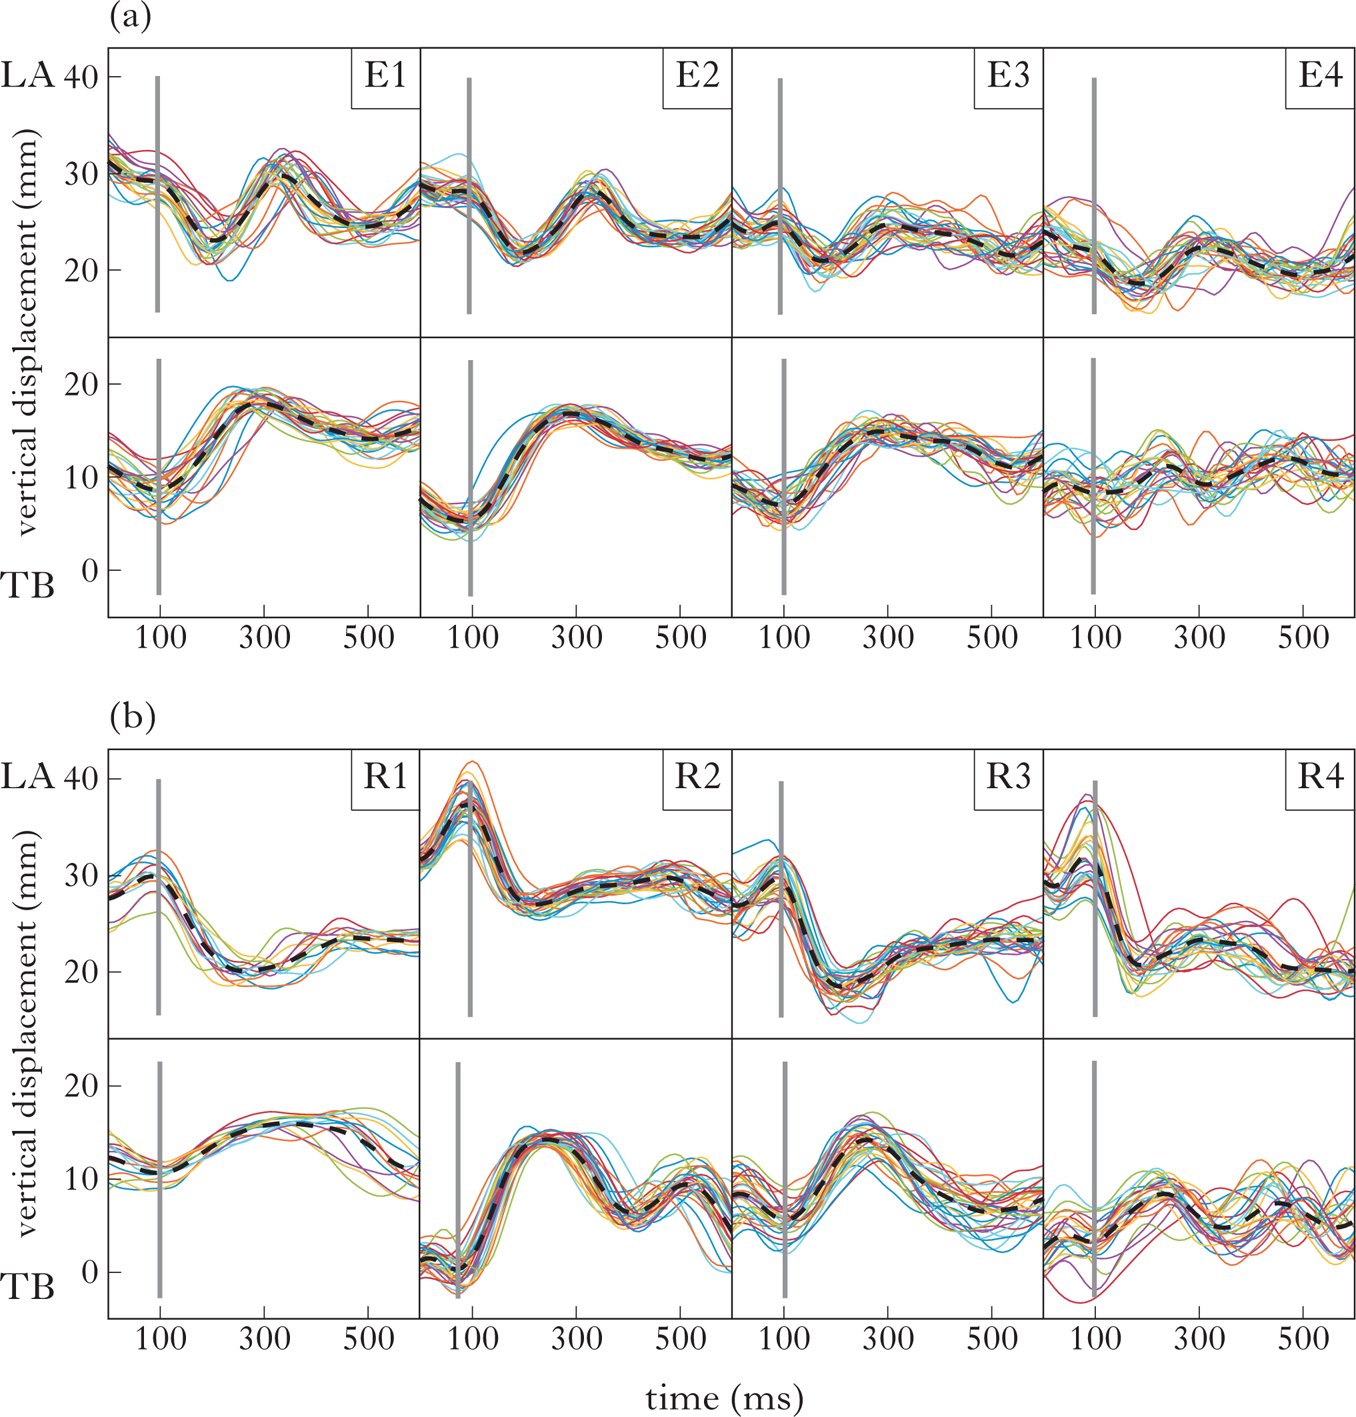
Fig. 8b shows the same 600 ms window for the Russian token /bʲust/, as produced by four speakers. It can be seen at a glance that the relative timing of the gestures appears similar to the English ones, since the rise for the TB movement tends to follow shortly after the fall of the LA trajectory.
Since the dependent measures in our analysis are temporal intervals and we are interested in particular in the correlation between intervals, we next present the distribution by language of the key continuous variables: G1 duration and onset-to-onset lag, along with, for completeness, G2 duration. The distributions are presented by language in Fig. 9. The G1 duration measures, shown in (a), have a slight rightward skew, as is common for temporal measurements of speech associated with linguistic units. Notably, however, the distributions for English and Russian are heavily overlapped. The peak of the English distribution is at 201 ms, with a standard deviation of 53 ms; the peak of the Russian distribution, at 242 ms, is within one standard deviation of the English peak. Thus, the average labial is similar in duration across English and Russian. For completeness, (b) shows the distribution of G2 (palatal gesture) duration by language. This measurement does not relate directly to any of our main hypotheses, but we include it for reference. The English data tend to have longer palatal gestures than the Russian data. Finally, (c) shows the distribution of onset-to-onset lag. Here too, both languages have similar mean values. However, the distributions differ in shape, with English having a longer right tail.
The distribution of three phonetic parameters by language: (a) G1 (labial consonant) duration; (b) G2 (palatal gesture) duration; (c) onset-to-onset lag.
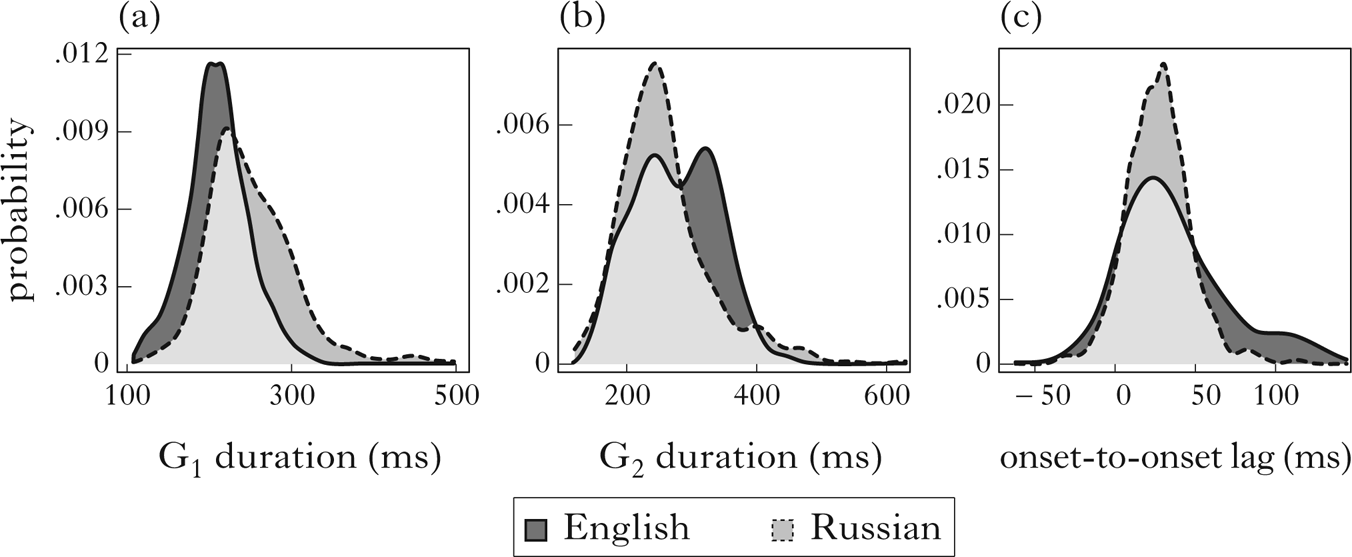
Figure 9 indicates that, as expected, the palatal and labial gestures of English and Russian are similar, as is the lag between gestures. By considering how the variability summarised in (a) (G1 duration) relates to the variability in (c) (onset-to-onset lag), we can adjudicate between our competing hypotheses. The key insight from our models is that token-to-token kinematic variability is shaped uniquely by coordination relations. The gestural control regime that we have hypothesised for complex segments predicts that G1 duration is independent of onset-to-onset lag (Figs 3b, d). In contrast, the control structure for segment sequences predicts that these dimensions should be positively correlated (Figs 3a, c). Crucially, it is natural variability in the kinematics that reveals patterns of gestural coordination characteristic of phonological structure: complex segments vs. segment sequences.
We have already seen that the distributions of G1 duration, i.e. the duration of labial consonants, are similar in this data for English and Russian, and that onset-to-onset lag distributions have a similar mean value. We now turn to the relation between these variables.
Figure 10 plots the relation between G1 duration and onset-to-onset lag for each language. To illustrate the trend in the data, a least-squares linear regression line is fitted to each panel. The trends can be compared directly to the simulation results in Fig. 3. For English, there is a positive correlation, as predicted by the segment sequence hypothesis. As G1 duration increases, so too does onset-to-onset lag. For Russian, the regression line is nearly flat, showing only a slight upward trend, as predicted by the complex segment hypothesis. When compared to the simulation results in Fig. 3, the English data most closely resemble Fig. 3c, segment sequences with negative lag, and the Russian data most closely resemble Fig. 3d, complex segments with positive lag.
A scatterplot of the effect of G1 duration (x-axis) on onset-to-onset lag (y-axis) for each language. English, which parses the gestures into segment sequences, shows a strong positive correlation, while Russian, which parses the gestures into complex segments, shows no correlation.

To assess the statistical significance of the trends in Fig. 10, we fitted a series of linear mixed-effects models to the data, as shown in Table I (for additional details, see §5.5). The addition of G1 duration significantly improves the baseline model, which contains only random intercepts for Speaker and Item. The addition of Language as a fixed factor leads to additional modest improvement – the log likelihood of the data given the model with Language as a fixed effect (―4839.88) is greater than the log likelihood of the simpler model, which includes only G1 duration (―4842.37); moreover, the AIC decreases by about 3, from 9694.7 to 9691.8. In the final model, the addition of the interaction term leads to more substantial improvement (χ 2 = 47.3, p < 0.001). The additional variance explained by the interaction term decreases AIC from 9691.8 to 9646.4 for the model with the G1 duration × Language interaction. This drop in AIC of about 45 is sizeable; to put it into context, Burnham & Anderson (Reference Burnham and Anderson1998: ch. 3) suggest that a difference in AIC of 9–10 is already large. The significant improvement contributed by the interaction term indicates that the influence of G1 duration on onset-to-onset lag is different for the different language groups.
Comparison of nested linear mixed-effects models of onset lag. Each model is compared pairwise with a progressively more complex model, i.e. one additional degree of freedom. All additions lead to significant improvement and lowered AIC. The best-fitting model includes the interaction between G1 duration and Language.

Table II summarises the best-fitting model. The intercept of ~6 ms approximates the average onset-to-onset lag, as observable for Russian in Figs 9c and 10b. The main effect of G1 duration is positive, but very small (0.047 ms; t = 2.03, p = 0.043). This weak positive influence may follow from local variation in speech rate that independently influences both G1 duration and onset-to-onset lag. In Appendix B, we provide an additional analysis that shows that, in the presence of a local measure of speech rate, the effect of G1 duration on onset lag is no longer significant. The combination of coefficients for Language and the G1 duration × Language interaction, both highly significant, explains the differential effect across languages. The coefficient for Language is ―45.466 ms, which places the estimate for English much lower than the intercept value (Russian). The negative effect of Language is offset by the positive G1 duration × Language interaction. For English only, the effect of G1 duration is large (0.265 ms) and highly significant (t = 6.99, p < 0.0001). For each millisecond increase in G1 duration, onset-to-onset lag in English increases by 0.265 ms. This is the positive trend reflected in Fig. 10a.
Summary of fixed factors in the best-fitting model (reference level for Language=Russian).

In sum, the statistical models confirm the trend observable in Fig. 9c. With respect to the predictions in §3, Russian palatalised consonants behave like complex segments, while their English counterparts, although phonetically very similar to Russian in many respects, behave like segment sequences.
7 Discussion
7.1 Summary
Both complex segments and segment sequences involve multiple gestures, in the sense of Articulatory Phonology (e.g. Browman & Goldstein Reference Browman and Goldstein1986, Reference Browman and Goldstein1988, Reference Browman and Goldstein1989, Reference Browman and Goldstein1990, Reference Browman, Goldstein, Port and van Gelder1995a, b, Reference Browman and Goldstein2000), where a gesture is both a unit of phonological contrast and a specification of articulatory dynamics. Moreover, the individual gestures involved in a contrast based on a simplex vs. complex segment distinction, e.g. /b/ vs. /bʲ/, can be quite similar, or indeed identical, to a contrast based on a single segment vs. segment sequence distinction, e.g. /b/ vs. /bj/. The phonological behaviour exhibited by complex segments (see §2) can be used to diagnose them as phonologically distinct from sequences. Our study addressed whether there is also a revealing difference in how the component gestures of complex segments vs. segment sequences are coordinated in time. Such a difference could support a phonological distinction based not on the individual dynamics of the constituent gestures but on their mode of coordination. A difference in gestural coordination conditions distinct kinematic patterns, providing a basis through which phonological structure can be diagnosed through a phonetic signal.
Our study provided robust support for our main hypothesis. Results indicate that gestural coordination for complex segments (Russian) differs from segment sequences (English). Specifically, the Russian, but not the English, data is consistent with the hypothesis that the constituent gestures of complex segments are coordinated according to their gesture onsets. The English data is instead consistent with the hypothesis that segment sequences are coordinated according to the offset of the first gesture and the onset of the second.
In many ways, palatalised labials in Russian are phonetically similar to labial–glide sequences in English. This can be seen, for example, in the measurements of gesture duration (Fig. 9a) and even in the kinematic trajectories in Fig. 8. Moreover, the average degree of overlap between gestures, as indicated by the onset-to-onset lag measure, was not significantly different (Fig. 9c). The key difference related to our hypothesis is that the languages differ in the relative timing of the similar labial and palatal gestures. The predictions of this hypothesis were borne out by the data.
7.2 Linking natural phonetic variation to phonological structure
Our approach to uncovering differences in coordination makes use of the natural variation present in the data. As predicted, trial-by-trial variability in the duration of the labial consonant is correlated with onset-to-onset lag only for segment sequences (English), not for complex segments (Russian). The positive correlation for segment sequences is predicted by our hypothesis (Fig. 3). Since, in the case of segment sequences, G2 is timed to the offset of G1, any increase in first gesture duration also delays the onset of G2 (relative to the onset of G1). This is not the case for complex segments; by hypothesis, complex segments are coordinated with reference to gesture onsets. Therefore, variation in G1 duration is orthogonal to triggering the onset of G2. The data presented here provide clear support, replicating patterns reported in Shaw et al. (Reference Shaw, Durvasula and Kochetov2019) based on already collected data (see §4.3).
The framework in which we have formalised our hypotheses takes the mathematical form of a stochastic linear model, building on the deterministic models of gestural coordination in Gafos (Reference Gafos2002) and subsequent stochastic implementations (e.g. Shaw & Gafos Reference Shaw and Gafos2015). For the case at hand, the patterns that we have described could also be described using the coupled oscillator model (e.g. Nam et al. Reference Nam, Goldstein, Saltzman, Pellegrino, Marisco, Chitoran and Coupé2009), with some modifications. To explore the parameters of the coupled oscillator model, we ran some simulations in which we scaled the natural frequency of the oscillators to induce variation in G1 duration (see Appendix C). With gestures timed anti-phase, the onset-to-onset interval increased as G1 duration increased, just like the English data. With gestures timed in-phase, increases in G1 duration had only a negligible influence on the onset-to-onset interval, just like the Russian data. Thus, our hypothesis for complex onsets structures variability in the same way as in-phase timing, and our hypothesis for segment sequences structures variability in the same way as anti-phase timing. These two modes – in-phase and anti-phase – are hypothesised in the coupled oscillator model to be intrinsically stable. Given this data, the challenge remaining for the coupled oscillator model is how to account for the short onset-to-onset lag for English. At all values of natural frequency, anti-phase coupling dictates positive lag and in-phase coupling dictates near-zero lag. In our data, both English and Russian show near-zero lag. We capture this pattern by having a lag parameter that is independent from coordination (see Fig. 3).
In this case, but also in general, our framework enables description of a wider range of coordination patterns than are available in the coupled oscillator model. Besides patterns enabled by the addition of a lag parameter, we could also describe coordination patterns based on target landmarks, such that it is the target of a gesture, as opposed to its onset, that is coordinated with another gesture. This type of pattern – target-based timing – is not possible in the coupled oscillator framework, since it models coordination only in terms of gestural onsets or ‘initiation’. Other theoretical work has argued that gestural targets, or movement ‘endpoints’, as opposed to gestural onsets, are central to speech timing (Turk & Shattuck-Hufnagel Reference Turk and Shattuck-Hufnagel2020). Gafos et al. (Reference Gafos, Roeser, Sotiropoulou, Hoole and Zeroual2020) provide compelling evidence that phonetic variation can also be structured around the achievement of target-defined coordination relations, while also allowing the possibility of onset-based coordination.
For the case at hand, the more restrictive coupled oscillator model, expressing coordination based on gesture onsets and prioritising in-phase and anti-phase coupling, would be largely sufficient, with the only additional wrinkle being that, for the case of English, some additional modulation of the dynamics may be necessary to capture the onset-to-onset interval.
More broadly, substantial work is required to delineate the range of natural language coordination patterns and how they relate to phonological structure. A key contribution of this paper is a rigorous test of an explicit hypothesis relating gestural coordination to one aspect of phonological structure.
7.3 Why not just look within Russian?
We have pursued a cross-language comparison between a case that, based on phonological evidence, is unambiguously a complex segment, the palatalised consonants of Russian, and a case that is unambiguously a segment sequence, consonant–glide sequences in English. However, since Russian exhibits a within-language contrast between Cʲ and C+j (e.g. /pʲok/ ‘bake (3pst)’ – /pjot/ ‘drink (3prs)’), it might seem that our hypothesis could be tested within Russian. A problem with this is that the consonant in C+j is reported to be palatalised, at least variably (Avanesov Reference Avanesov1972, Diehm Reference Diehm1998, Suh & Hwang Reference Suh and Hwang2016), resulting in a sequence of a complex segment and a glide (e.g. /pjot/ [pʲjot ~ pjot]; see note 6). However, at least before labial consonants, there is not a three-way contrast between Cʲ, C+j and Cʲ+j. That is, a labial consonant before a palatal glide could freely vary between a plain and palatalised variant without affecting meaning. Because of this possibility of variation, the within-language contrast between /Cʲ/ and /Cj/ would make for a less conclusive test of our main hypothesis. Indeed, given the claims that plain consonants are palatalised before a palatal glide, we expect to observe complex segment timing within Russian for both underlying and derived palatalised consonants; preliminary results suggest that this is indeed the case (S. Oh et al. Reference Oh, Shaw, Durvasula and Kochetov2020). The cross-language approach to testing our main hypothesis allows us to avoid the complication of underlying vs. derived palatalisation in Russian, although future work should build on these results by revisiting the nature of the Cʲ vs. C+j contrast in Russian.
7.3 Other cues to the Russian contrast
Since there is a phonological contrast in Russian between /Cʲ/ and /Cj/, there must be a difference between these forms that is reliably perceived by native speakers. In the articulatory kinematics, the palatal gesture in /Cj/ is longer than /Cʲ/ (Kochetov Reference Kochetov, Goldstein, Whalen and Best2006), a durational difference that may support perception of the contrast. Incidentally, we also found that the palatal gesture is longer in the English /Cj/ case than for the palatalised consonants of Russian /Cʲ/ (see Fig. 9b). Acoustic studies of Russian have shown differences that are consistent with this observation about the kinematics. For example, Diehm (Reference Diehm1998) reports that C+j exhibits significantly higher F2 at the transition onset and significantly longer F2 steady-state duration than Cʲ. Suh & Hwang (Reference Suh and Hwang2016) also found that the vocalic duration comprising the j+V portion of C+j+V syllables is significantly longer than the ʲ+V portion of Cʲ+V syllables. Thus, for the specific case of Russian, there are multiple cues to the distinction between C+j and Cʲ. However, since the consonant in C+j is also realised as the palatalised consonant, the acoustic differences between C+j and Cʲ in Russian are not necessarily valid criteria for distinguishing complex segments and segment sequences generally. That is, these differences likely reflect a surface difference between [Cʲj] and [Cʲ]. More generally, duration-based criteria cannot necessarily be extended to languages for which there is not an underlying contrast between complex segments and segment sequences that also surfaces faithfully. We note that contrasts of this sort appear to be exceedingly rare.Footnote 11 Our hypothesis, on the other hand, is not dependent on contrast. In addition, variation in segmental duration due to a combination of known and unknown factors does not hinder our ability to assess differences in coordination. On the contrary, temporal variation is crucial to uncovering differences between coordination schemes. This is because coordination relations structure temporal variability in revealing ways. In the absence of variability, it would not be possible to distinguish between a complex segment with positive lag (Fig. 1c) and a segment sequence with negative lag (Fig. 1d). Thus the approach to evaluating coordination relations through covariation of structurally relevant intervals hinges on the presence of natural variability in the speech signal, which is, of course, plentiful.
7.4 Scope of the hypothesis
Although the empirical test of the hypothesis presented in this paper focused on a single test case, we intend the hypothesis to be general. Our definition of a complex segment (from §1) is any segment that involves multiple articulatory gestures. This definition encompasses cases of secondary articulations, such as the palatalised consonants that are the empirical focus of this paper, as well as cases sometimes termed ‘doubly articulated stops’, such as /k͡p/, ‘contour segments’ (including affricates), e.g. /p͡s/, and others that are not so obvious. What counts as a candidate for a complex segment will depend on the proposed gestural composition. For example, a voiceless aspirated stop, if it involves two gestures, a laryngeal gesture and an oral gesture, could be considered a complex segment or a segment sequence, e.g. /th/ vs. /th/, depending on, according to our hypothesis, the timing of the gestures. The same goes for nasals, on the analysis that they are composed of a velic gesture and an oral gesture. For example, M. Oh et al. (Reference Oh, Byrd, Goldstein and Narayanan2020) show that coda nasals in Korean have sequential timing of a velum-lowering gesture and an oral constriction, suggesting that these gestures do not form complex segments, according to our diagnostic.
To take another example, most gestural analyses of laterals, e.g. /l/, involve multiple gestures, whether tongue tip and tongue dorsum gestures, as in Browman & Goldstein (1995b), or more direct control of lateral channel formation, as in Ying et al. (Reference Ying, Shaw, Carignan, Proctor, Derrick and Best2021). Since /l/ involves multiple gestures, we could ask if those gestures are coordinated according to our diagnostic for complex segments.
One apparent problem for applying the complex segment diagnostic to /l/ is that the synchronicity of tongue tip and tongue dorsum kinematic movements, as tracked in the midsagittal plane, is sensitive to syllable position: there is greater synchronicity in syllable onset position than in syllable coda position (Sproat & Fujimura Reference Sproat and Fujimura1993). This would be a problem if the coordination-based hypothesis indicated that /l/ is a complex segment in syllable onset position and a sequence in coda position, while phonological behaviour remained consistent across positions. However, as we have emphasised, gestural overlap can be dissociated from coordination. Moreover, Ying et al. (Reference Ying, Shaw, Carignan, Proctor, Derrick and Best2021) show that the timing of lateral channel formation in Australian English is temporally stable across syllable positions, even as the relative timing between tongue tip and tongue dorsum movements varies (as it does in American English, as well as in other varieties). This finding supports an analysis of /l/ as composed of a tongue tip gesture and a tongue blade lateralisation gesture, which may be coordinated as a complex segment across positions. In other words, the tongue dorsum retraction might not be under active control, but is rather a side-effect of other gestures, a proposal first made by Sproat & Fujimura (Reference Sproat and Fujimura1993).
The loss of /l/ in New Zealand English (i.e. /l/-vocalisation) fits nicely into this discussion. There appears to be a stage in which active control of lateral channel formation gives way to a different gestural control structure, involving tongue tip advancement and tongue dorsum retraction (Strycharczuk et al. Reference Strycharczuk, Derrick and Shaw2020). This stage of development is similar to Browman & Goldstein's (1995b) proposal for American English. Interestingly, this gestural control structure might not be stable, as it precipitates the loss of the tongue tip gesture. Viewed from the standpoint of our hypothesis for complex segments, we could see the New Zealand development as a transition from /l/ as a complex segment (with tongue tip and tongue blade lateralisation gestures) to a reinterpretation as a segment sequence (with a tongue dorsum retraction gesture followed by a tongue tip gesture) and then as a single (simplex) segment (just a tongue dorsum retraction gesture).
More broadly, if we fail to identify the phonetic dimension under gestural control, we might not be able to diagnose coordination. The criteria for identifying gestures are twofold: a gesture (i) supports phonological contrast, and (ii) specifies the dynamics of some phonetic dimension. To evaluate coordination, it is crucial to first establish the constituent gestures. This point is relevant as we seek to test the hypothesis on new cases of potential complex segments, including laterals, rhotics, voiced and voiceless stops, and other cases alluded to above.
The phonetic dimensions of gestural control in early work in Articulatory Phonology were limited to a relatively small number of articulatory parameters, but have expanded over the years as demanded by empirical evidence. For example, the tongue blade lateralisation gesture in Ying et al. (Reference Ying, Shaw, Carignan, Proctor, Derrick and Best2021) was not one of the original eight dimensions of gestural control (known as ‘tract variables’ in the Articulatory Phonology framework). Aerodynamic gestures (McGowan & Saltzman Reference McGowan and Saltzman1995) and acoustic gestures have also been proposed to explain a wider range of phonological contrasts and experimental data. For example, F0, an acoustic parameter, is now widely assumed to be a dimension of gestural control in lexical tone languages (Gao Reference Gao2008, Hu Reference Hu2016, Karlin Reference Karlin2018, Zhang et al. Reference Zhang, Geissler and Shaw2019, Geissler et al. Reference Geissler, Shaw, Tiede and Hu2021) and pitch-accent languages (Zsiga & Zec Reference Zsiga and Zec2013, Karlin Reference Karlin2018). Moreover, it has been shown in many cases to interact in coordination in the same way as other gestures. Identifying the dimensions of contrast and of phonetic control, i.e. the gestures, is a prerequisite to evaluating intergestural coordination.
One limitation of our approach is that it requires that the gestures under consideration can be independently tracked. In this paper we have used the movement of relatively independent articulators to estimate the onsets and offsets of gestural control. For homorganic gestures, it may be difficult or impossible to estimate the onsets of distinct gestures using the same articulator, or other phonologically controlled parameter. For example, it would be much easier to evaluate the complex segment status of heterorganic gestures such as /ps/ (vs. /p͡s/) than that of homorganic gestures such as /ts/ (vs. /t͡s/). In principle, our hypothesis applies to both cases, but tracking the onset of movement for /t/ independently of the onset of movement for /s/ would be more challenging with current methods, since both involve active control of the anterior portion of the tongue.
In sum, although there are still some methodological limitations that could prevent effective tests of the hypothesis for some cases, e.g. homorganic gestures, we think there is substantial potential for the hypothesis presented in this paper to generalise across a wide range of segments, and even to serve as a diagnostic for complex segmenthood in cases for which revealing phonological evidence may otherwise be lacking. As a first pass, we chose a test case that is uncontroversial in its phonological status and for which we have good a priori knowledge of the phonetic dimensions under phonological control.
8 Conclusion
Evidence from articulatory kinematic data collected with electromagnetic articulography on Russian palatalised consonants and English consonant–glide sequences provided support for the hypothesis that complex segments differ from segment sequences in how the constituent gestures are coordinated. The gestures of complex segments, exemplified by palatalised consonants, are coordinated according to gesture onsets, such that the onset of one gesture provides the trigger to initiate the second gesture. The gestures of segment sequences, in contrast, are coordinated such that the offset of the first gesture triggers the onset of the second gesture. These distinct patterns of coordination can be masked in kinematic measures of temporal overlap, but are clearly revealed in patterns of covariation between temporal intervals. Token-by-token variability exposes distinct patterns of coordination unambiguously. This point was argued analytically, demonstrated through computational simulation and verified in the experimental data. Finally, we see substantial potential for the hypothesis to generalise beyond the test case presented here, providing a new approach to evaluating complex segmenthood across languages.



