Introduction
An increase in weather extremes has been recorded in recent years (Coumou and Rahmstorf, Reference Coumou and Rahmstorf2012). Climate change scenarios in Mediterranean environments predict less rainfall over the next 100 years, resulting in severe droughts; thus, the development of drought-tolerant cultivars is essential for maintaining high and stable productivity. Genetic variability in germplasm collections is important for generating improved varieties with desired characteristics that help to increase crop productivity that can improve food supplies, employment and incomes and thus enable adequate nutrition (Mohammadi et al., Reference Mohammadi, Haghparast, Sadeghzadeh, Ahmadi, Solimani and Amri2014).
The genetic variation of wheat landraces can be used for evolutionary breeding (i.e. a plant breeding method that uses crop populations with high levels of genetic diversity subjected to the forces of natural selection), considering their survival and performance under drought-prone environments. In Iran, bread wheat (Sardari) is grown in the majority of moderate to cool temperature regions. Sardari is an outstanding hallmark bread wheat landrace, which has been grown on a large scale in the rainfed cold and moderately cold regions in Iran for more than four decades (Mohammadi, Reference Mohammadi2014). It is a heterogeneous common wheat landrace that has been cultivated in dryland areas, selected and improved from Iranian native landraces. It is a winter-type with mean plant height of 100 cm, awned spike and elliptical shape, white seed, resistant to cold, susceptible to rust and lodging in wet years, but with good baking quality and good stability with acceptable performance under dryland cold conditions. Sardari also is resistant to shattering and its yield under optimal condition is 1.5–2 t/ha. As a predominant dryland landrace in Iran, Sardari has received great attention and its genetic diversity of different sets of ecotypes from different area has been studied previously. Sadeghzadeh et al. (Reference Sadeghzadeh Ahari, Katata and Rostaei2004) showed that Sardari ecotypes varied in yield, level of rust resistance, spikelets per spike, plant height, thousand-grain weight, grain protein content (%), lodging resistance and earliness. In another investigation by Pirseyedi et al. (Reference Pirseyedi, Mardi, Naghavi MR, Sadeghzadeh, Mohammadi and Ghareyazie2006), Sardari derivative wheat lines showed high levels of genetic variation for both morphological and molecular aspects under drought stress conditions.
Plant landraces are heterogeneous, showing local adaptations, and provide genetic resources that meet current and new challenges for farming in variable environments (Mohammadi et al., Reference Mohammadi, Haghparast, Sadeghzadeh, Ahmadi, Solimani and Amri2014; Ceccarelli, Reference Ceccarelli2015). The ecotypes can vary in phenology and show low-to-moderate edible yield but are often highly nutritious. Landraces have mainly contributed to plant breeding through conferring traits for more efficient nutrient uptake and utilization, and desirable genes for adaptation to stressful environments such as drought, heat and salinity. Evidence supports the hypothesis that landraces can provide sources of increased resistance to stress, which will facilitate identifying alleles for enhancing yield and drought adaptation that enhance the productivity and stability of crop varieties in stressful environments (Dwivedi et al., Reference Dwivedi, Ceccarelli, Blair, Upadhyaya, Are and Ortiz2016). An interest in landrace conservation during the last few decades has been growing, with much research focusing on the maintenance of on-farm crop genetic diversity.
Plant conservation is at the forefront of the combined in situ/ex situ approach. It is now well recognized that an appropriate conservation strategy for a particular plant genepool requires a holistic approach, combining the different ex situ and in situ conservation techniques available in a complementary manner (Engelmann, Reference Engelmann, Altman and Hasegawa2012). However, there is a growing concern worldwide about food security and nutrition. In this regard, landraces may provide a health benefit and nutritious food: breeders will also benefit greatly via wheat improvement for adaptation to climate change worldwide (Ceccarelli, Reference Ceccarelli2015; Dwivedi et al., Reference Dwivedi, Ceccarelli, Blair, Upadhyaya, Are and Ortiz2016; Dempewolf et al., Reference Dempewolf, Baute, Anderson, Kilian, Smith and Guarino2017).
The main objectives of the current study were to (i) quantify the performance of the Sardari wheat ecotypes under rainfed conditions in Iran, (ii) characterize the association panel for phenological and yield traits that might be associated with drought tolerance and (iii) provide information that would be useful in wheat breeding for the dryland conditions of Iran.
Materials and methods
Genetic materials and experimental layout
The ecotypes tested were a panel of 536 Sardari bread wheat ecotypes selected from Sardari populations in farmers’ fields in west and north-western parts of Iran, including Maragheh (37o23′N, 46o15′E, 1472 m asl), Kurdistan (35o57′N, 47o8′E, 1927 m asl), Ilam (33o40′N, 46o34′E, 975 m asl) and Zanjan (36o40′N, 48o30′E, 1699 m asl) regions. The panel was selected by wheat breeders in the regions based on differences in spike (colour, size, density, awn presence, etc.). However, Sardari wheat is very divergent and populations show high variability for yield, level of rust resistance, spikelet number, stem height, thousand-grain weight, grain protein (%), lodging resistance and earliness traits.
The 536 Sardari bread wheat ecotypes along with three control cultivars (Azar-2, Rasad and Sardari) were sown in six-row plots, 3.5 m in length and 20 cm row spacing, with two replications under rainfed conditions at Dryland Agricultural Research Institute, Maragheh station, Iran, for three cropping seasons (2009–12). In each replication, three control cultivars were arranged with 20 ecotype intervals in which each control was repeated nine times among the plots in each replication. The control cultivars were used to account for any variation trends in the field. The controls were distributed across the field to sample any variation that may be present to adjust the values of the tested ecotypes, and to accurately estimate the true genetic potential of the ecotypes for advancement. The efficiency of the spatial designs and analysis relies on a better partitioning of the variance components for block and residual effects, allowing the breeder to better compare new ecotypes with the controls (Mohammadi et al., Reference Mohammadi, Haghparast, Sadeghzadeh, Ahmadi, Solimani and Amri2014).
Several quantitative traits were measured for each ecotype in each cropping season. The traits recorded were days to 50% heading (DH) and maturity (DM) from 1 January, plant height (PH), grain-filling period (GFP) and grain yield (YLD). Grain yield (moisture content: 135 g water/kg fresh weight) was measured on a plot basis and converted to kg/ha for the statistical analyses. Weeds were controlled chemically and manually as required. Fertilizer rate was 40 kg nitrogen (N)/ha and 25 kg phosphorus pentoxide (P2O5)/ha applied at planting time.
Data analysis
The traits were compared per ecotype across the three cropping seasons. In order to estimate variance components of traits, a complete random linear model was used in the analysis of all the traits within and across years using the Residual Maximum Likelihood (REML) algorithm of Genstat 15 (Payne et al., Reference Payne, Murray, Harding, Baird and Soutar2012). Descriptive statistics per year and trait were obtained using the summary statistics procedure in Genstat 15. For each of the traits, an analysis of variance (ANOVA) was performed to estimate the means of the ecotypes, the phenotypic and genetic variances and the heritability.
Heritability estimates for traits
Broad sense heritability ( $H_{\rm b}^2 $) estimates were calculated from phenotypic variance (
 $\sigma _{\rm p}^2 $) and the genotypic variance (
 $\sigma _{\rm g}^2 $) according to Allard (Reference Allard1999) using the formula:
 $$H_{\rm b}^2 \; = \; \displaystyle{{\sigma _{\rm g}^2} \over {\sigma _{\rm g}^2 \; + \; \left( {\displaystyle{{\sigma_{{\rm ge}}^2} \over e}} \right)\; + \; \left( {\displaystyle{{\sigma_{\rm e}^2} \over {re}}} \right)}}$$
where  $H_{\rm b}^2 $ represents the heritability,
 $\sigma _{\rm g}^2 $ is the genotypic variance,
 $\sigma _{{\rm ge}}^2 $ is the genotype × environment (GE) interaction variance,
 $\sigma _{\rm e}^2 $ is the error variance, r is the number of replications and e is the number of environments. Data from three environments with two replications were used for the estimation of heritability.
The coefficient of variation (CV%) was calculated for each trait by dividing the standard deviation (s.d.) of a set of measurements by the set mean and multiplying by 100. Repeatability for CV was quantified by the mean of correlations of 1000 re-samples using the bootstrap method (Efron and Tibshirani, Reference Efron and Tibshirani1993) between the estimates of CV values from different seasons.
Phenotypic diversity
Mean and s.d. were calculated for each recorded trait and were used to classify the ecotypes into three groups:
>mean + s.d.;
<mean−s.d.;
between mean ± s.d..
The proportion of the different groups for each trait was determined using Shannon's (Reference Shannon1948) diversity index (H) to determine phenotypic diversity in the collection based on each trait at each year. This index is defined as:
 $$H{\rm \;} = {\rm \;} - \mathop \sum \limits_{i{\rm \;} = {\rm \;} 1}^N Pi\,\hbox{ln}\,Pi$$
where N is the number of phenotypic groups, P is the relative frequency of the ith group, and ln is the natural logarithm. The average diversity (H′) over k traits was also estimated as follows:
 $$H{\rm ^{\prime}\;} = {\rm \;} - \mathop \sum \limits_{i{\rm \;} = {\rm \;} 1}^k H_i$$
This index, as a convenient measure, is widely used in genetic and ecological studies of species diversity of communities or of germplasm collections (Jaradat, Reference Jaradat1992; Shakhatreh et al., Reference Shakhatreh, Haddad, Alrababah, Grando and Ceccarelli2010). Ecotype ranking was determined based on yield and other recorded traits, which in the current study refers to an ecotype's ability to perform consistently across environments.
Multivariate analyses
A genotype and genotype × environment (GGE) biplot was used to explain the variation due to ecotype and ecotype × environment interaction. The GGE biplot analysis was performed using Genstat 15. The ‘which-won-where’ view of the GGE biplot was used in mega-environment (ME) investigation to identify the best-performing genotypes in the corresponding environments. A vector view of the GGE biplot was used to investigate the relationships among test environments. The cosine of the angle between the vectors of two environments approximated the correlation coefficient between them, where acute angles show a positive correlation, obtuse angles show a negative correlation and right angles no correlation (Yan and Kang, Reference Yan and Kang2003).
Results
Weather conditions
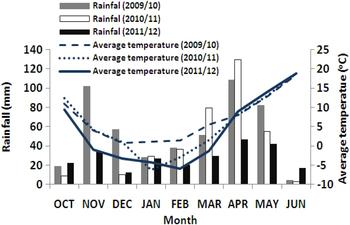
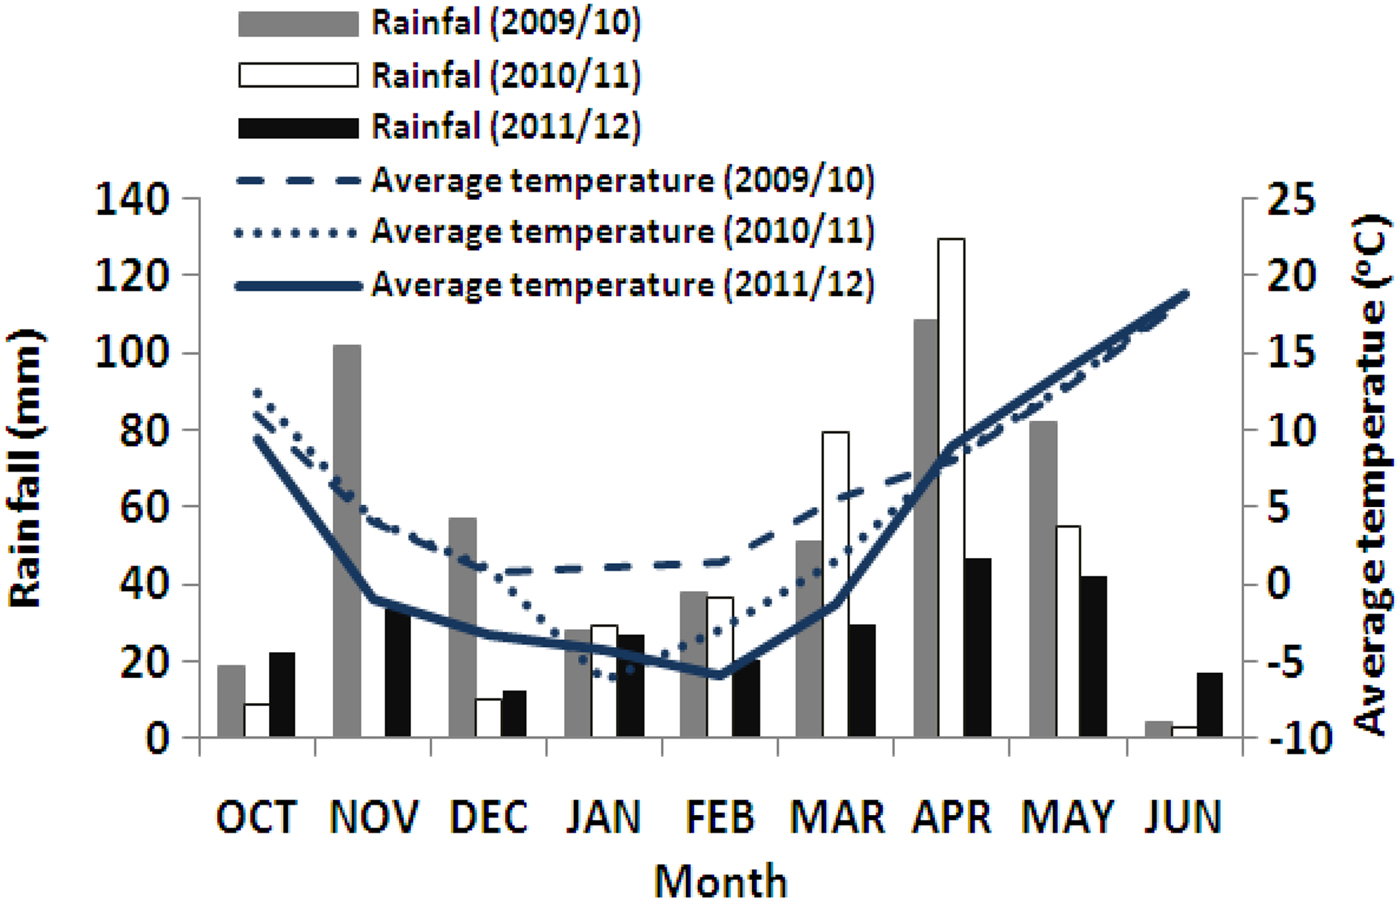
The cropping seasons’ weather differed (mostly in terms of rainfall, Fig. 1), thus giving contrasting growing conditions that led to a range of yield variations. The amounts of annual rainfall were 488.8, 351.4 and 251 mm during the 2009/10, 2010/11 and 2011/12 cropping seasons, respectively. The 2009/10 cropping season was optimum for crop growth, with rainfall remarkably higher than the long-term average (341 mm), and the crop experienced minimum and maximum temperatures of −2.2 and 25.6 °C, respectively. Rainfall in 2010/11 was slightly higher than the long-term average. In contrast, the 2011/12 cropping season had severe droughts with a large reduction in rainfall of 237.8 mm relative to the optimum year (2009/10). However, 2009/10 was about 10 °C warmer than other 2 years in winter, indicating favourable conditions for crop growth (Fig. 1). Accordingly, based on the total amount of rainfall received, 2009/10 was considered optimum conditions, 2010/11 intermediate conditions and 2011/12 was considered as severe drought conditions for crop growth.
Monthly rainfall and average temperature during three cropping seasons (2009–12) at Maragheh dryland agricultural research station, Iran. Colour online.
Analysis of variance and data description
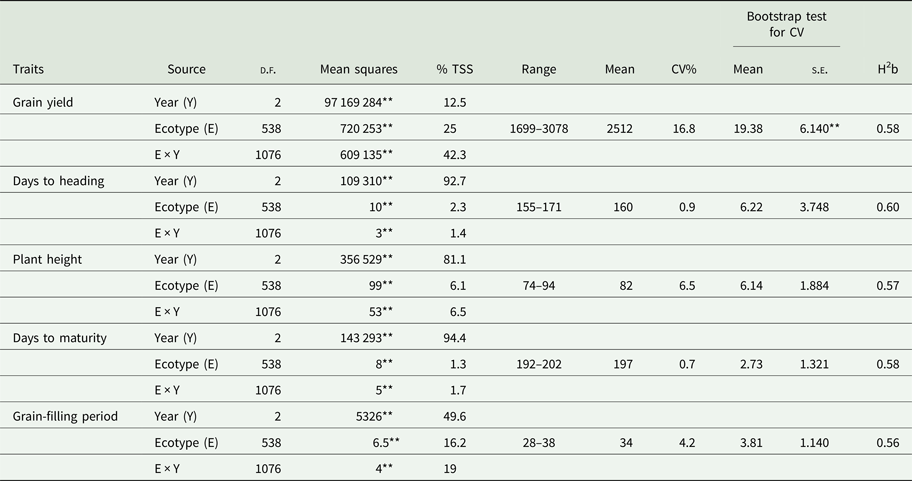
The combined ANOVA results revealed significant differences (P < 0.01) among ecotypes, years and ecotype × year interaction effects for grain yield and the other studied traits (Table 1). Depending on trait, year accounted for 12.2–94.4% of total sum of squares, followed by ecotype × year interaction which explained 1.7–42.3% and ecotype accounted for 1.3–25%. This indicates that for all traits except grain yield, year accounted for most of the variation followed by ecotype × year interaction and ecotype effects.
Variance components, range values, overall means, coefficients of variations and heritabilities for phenotypic traits in Sardari wheat ecotypes across 3 years

**P < 0.01. CV, coefficient of variation; H2b, broad-sense heritability; %TSS, percentage relative total sum of squares. Bootstrap results are based on 1000 bootstrap samples; s.e., standard error.
The mean, minimum, maximum, CV% and broad-sense heritability for yield and the other traits are also presented in Table 1. The mean yield for ecotypes was 2512 kg/ha and ranged from 1699 to 3078 kg/ha across years. The values for days to heading varied from 155 to 171 days, for plant height ranged from 74 to 94 cm, for days to maturity varied from 192 to 202 days and for grain-filling period ranged from 28 to 38 days across years. Coefficient of variation for yield and related traits ranged from 0.7 to 16.8%. The highest CV% was recorded for grain yield (16.8%), whereas days to maturity followed by days to heading, grain-filling period and plant height had lower CV%. The bootstrap test of CV for grain yield was found to be significant (P < 0.01), indicating a low magnitude of repeatability for yield. This indicates greater influence of environment on the expression of grain yield. In contrast, repeatability for other traits studied was high, indicating low influence of environment on estimates of CV for these traits (Table 1). The degree of heritability for the studied traits varied between 56% (corresponding to the grain-filling duration) and 60% (corresponding to heading date).
Grain yield
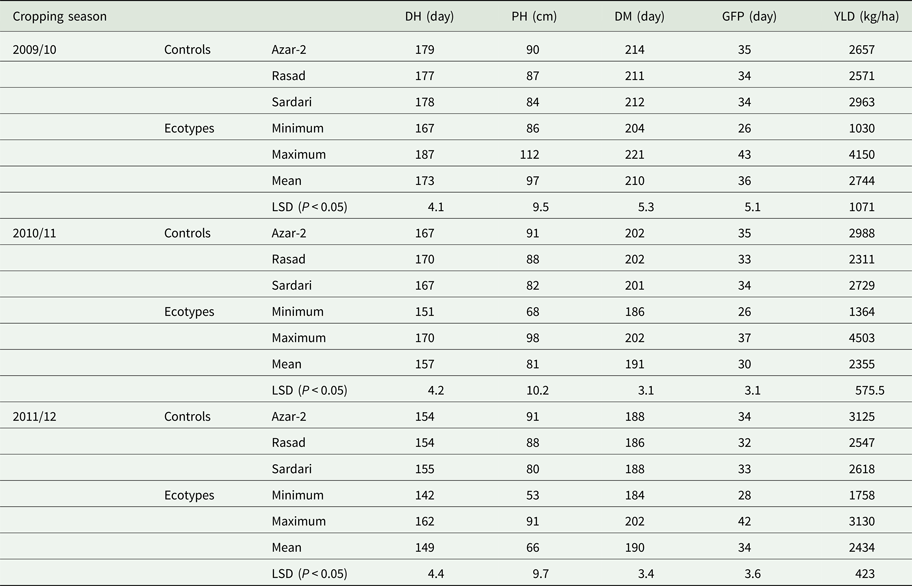
There were significant differences (P < 0.01) in grain yield at the ecotype and year levels as well as for the ecotype × year interactions (Table 1). The mean grain yield between years ranged from 2355 kg/ha in 2010/11 to 2744 kg/ha in 2009/10 (Table 2). The highest yielding ecotype was superior by 40% than the best control (Sardari) in 2009/10, while in 2010/11 the highest yielding ecotype was superior by 51% than the best control (Azar-2) and in 2011/12 the highest yielding ecotype was superior by 0.16% to the best control (Azar-2). There was a wide variation in grain yield from year to year, showing considerable ecotype × year interactions.
Descriptive data of Sardari wheat ecotypes and controls based on each cropping season
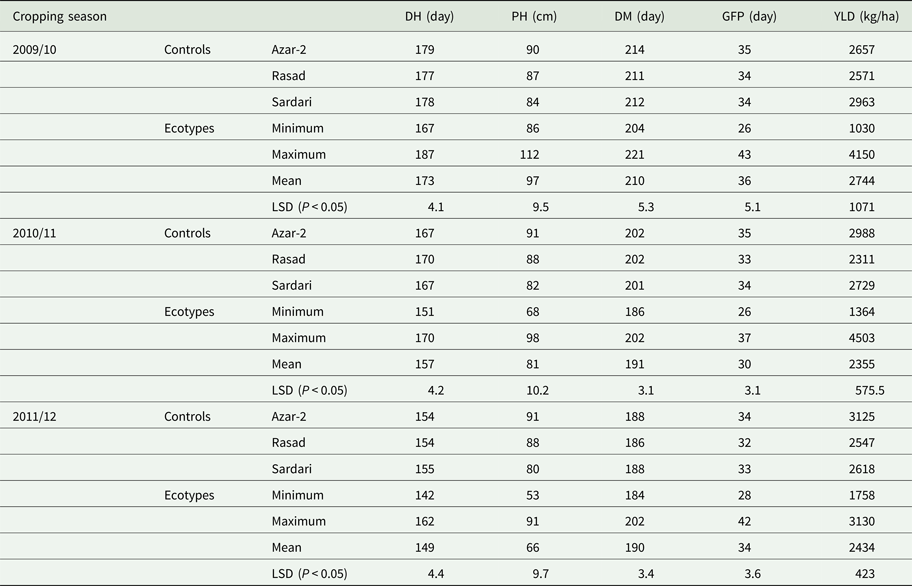
DH, days to heading; PH, plant height; DM, days to maturity; GFP, grain-filling period; YLD, grain yield.
Days to heading
Days to heading was significant (P < 0.01) at the ecotype and year levels as well as for the ecotype × year interactions (Table 1). There were significant differences among the ecotypes and controls in days to heading. Only two ecotypes were later in days to heading than the earliest control (Azar-2), showing the potential of ecotypes for enhancing early maturity in wheat breeding programmes using this germplasm pool. The mean heading date of ecotypes varied between 149 days in 2011/12 (dry year) and 173 days in 2009/10 (wetter year) (Table 2). The ecotypes completed flowering in 149–187 days from 1 January. However, in each year, some ecotypes flowered significantly earlier than the earliest controls.
Plant height
There were significant differences in plant height at the ecotype and year levels as well as for ecotype × year interactions (P < 0.01) (Table 1). Plant height varied among ecotypes: 19 ecotypes were taller than the tallest control (Azar-2). The plant height also varied among years from 66 cm in 2011/12 to 97 cm in 2009/10 (Table 2). There were ecotypes with taller and shorter statures than the control cultivars, which can be considered for target environments.
Days to maturity
Significant differences (P < 0.01) were recorded for days to maturity across all environments at the ecotype and year levels and their interactions. Most of the ecotypes (531 out of 536) were earlier in maturity than the earliest control (Rasad), showing the potential of ecotypes to enhance early maturity in wheat breeding programmes. The ecotypes reached maturity in 190–210 days from 1 January (Table 2). In each year, some ecotypes were significantly (P < 0.05) earlier to maturity than the controls.
Grain-filling period
Grain-filling period varied significantly (P < 0.01) at the ecotype and year levels and their interactions; 172 ecotypes had shorter grain-filling duration than the best control (cultivar Rasad, with the shortest grain-filling period among the controls). The mean grain-filling duration, depending on year, varied only slightly between 34 days in the dry year (2011/12) and 36 days in the wetter year of 2009/10 (Table 2).
Estimation of phenotypic diversity
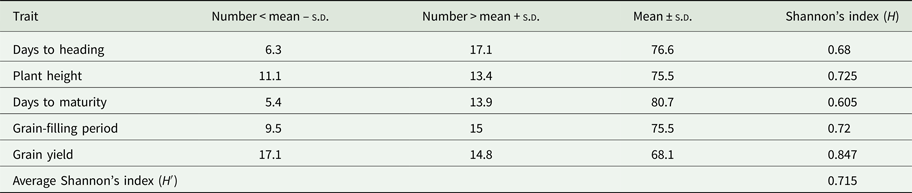
Table 3 shows the proportion of ecotypes in each group that exceeded the collection mean ± 1s.d. for grain yield and related traits across years. This method showed the number of superior ecotypes across environments for grain yield with high probability of selection success in the case of sufficiently high heritability. For days to heading, 0.063 of the ecotypes had earlier heading than the collection mean – s.d., while 0.171 had later heading than the collection mean + s.d. and the remaining ecotypes had heading dates between the two. In the case of plant height, 0.111 of ecotypes exceeded the collection mean + s.d. across the years, 0.134 had plant stature less than the collection mean – s.d.. For maturity, 0.054 of ecotypes had earlier maturity than the collection mean – s.d., while 0.139 of ecotypes were very late and the rest (0.807) had maturity between the collection mean – s.d. and the collection mean + s.d.. In the case of grain-filling period, 0.095 of ecotypes tended to complete maturity earlier than collection mean – s.d., 0.15 were later than mean + s.d. and 0.755 tended to complete maturity between the two. For grain yield, 0.171 of ecotypes had higher grain yield than the collection mean + s.d., and 0.681 had grain yield between collection mean + s.d. and collection mean – s.d., while 0.148 of the ecotypes had grain yield below mean – s.d..
Shannon's phenotypic diversity index (H), average diversity (Hʹ) and group frequencies based on each studied trait of Sardari wheat ecotypes

Shannon's phenotypic diversity index (H) ranged from 0.605 (corresponding to days to maturity) to 0.847 (corresponding to grain yield) (Table 3), indicating moderate-to-high phenotypic diversity among Sardari ecotypes across years. The phenotypic diversity for other traits, i.e. plant height, grain-filling period and heading date were 0.725, 0.720 and 0.680, respectively. The average phenotypic diversity index (H’) for the ecotypes based on the studied traits was 0.715.
Relationship of traits with grain yield
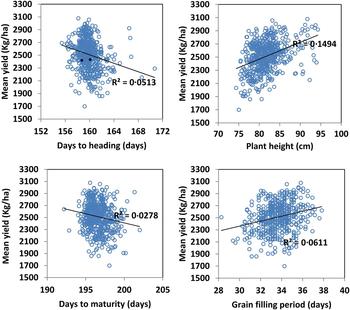
Days to heading (r = −0.23; P < 0.01) and days to maturity (r = −0.17; P < 0.01) were correlated negatively with grain yield (Fig. 2), indicating that selection for earliness in ecotypes will enhance grain yield productivity under cold rainfed conditions. Grain yield was correlated positively with plant height (r = 0.39; P < 0.01) and grain-filling duration (r = 0.25; P < 0.01) (Fig. 2), indicating that taller ecotypes and those with longer grain-filling duration under cold rainfed conditions could enhance yield productivity in Sardari bread wheat ecotypes.
Relationships between grain yield and related traits for 536 ecotypes and three control cultivars over three cropping seasons. Colour online.
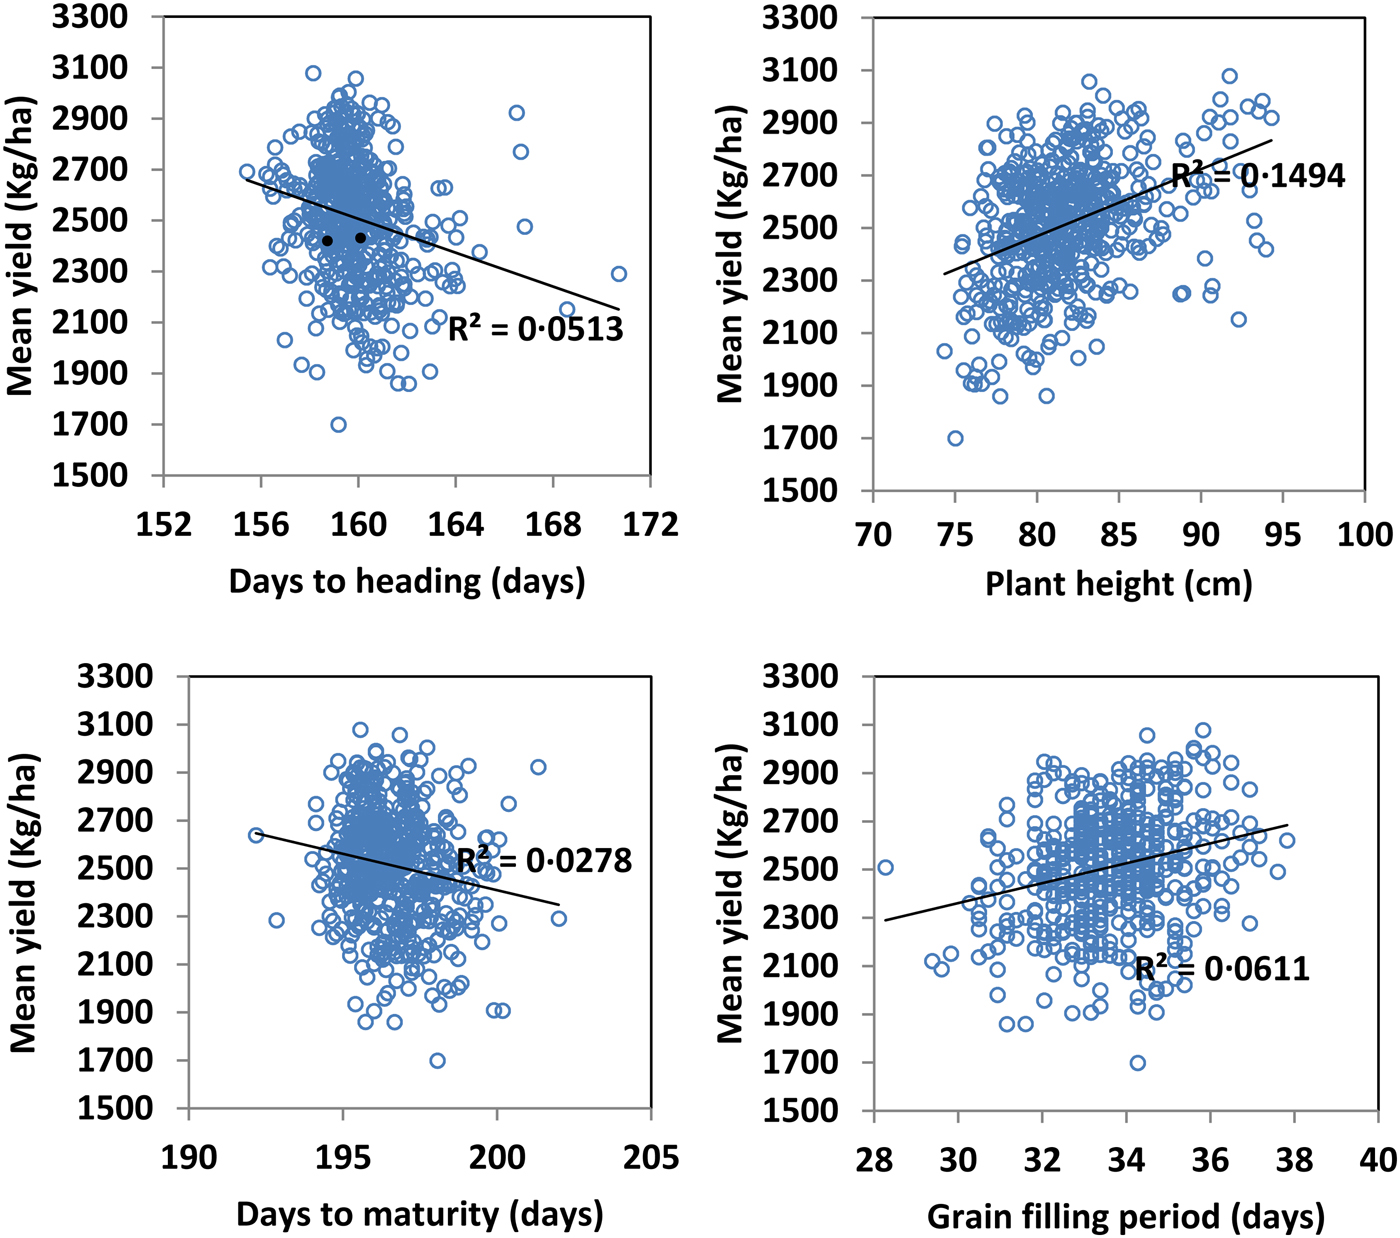
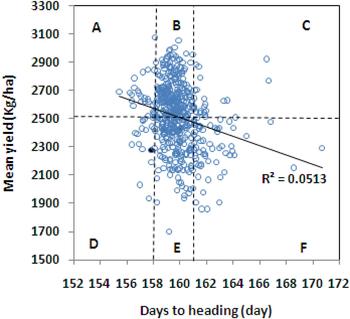
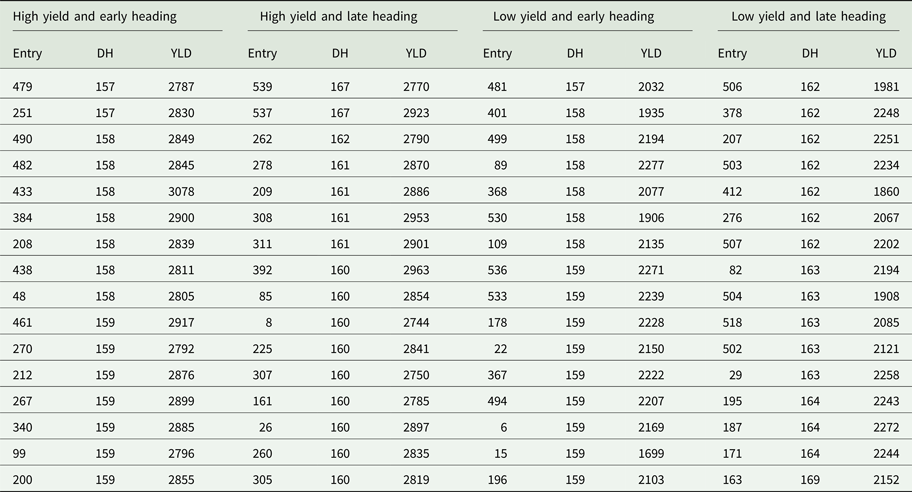
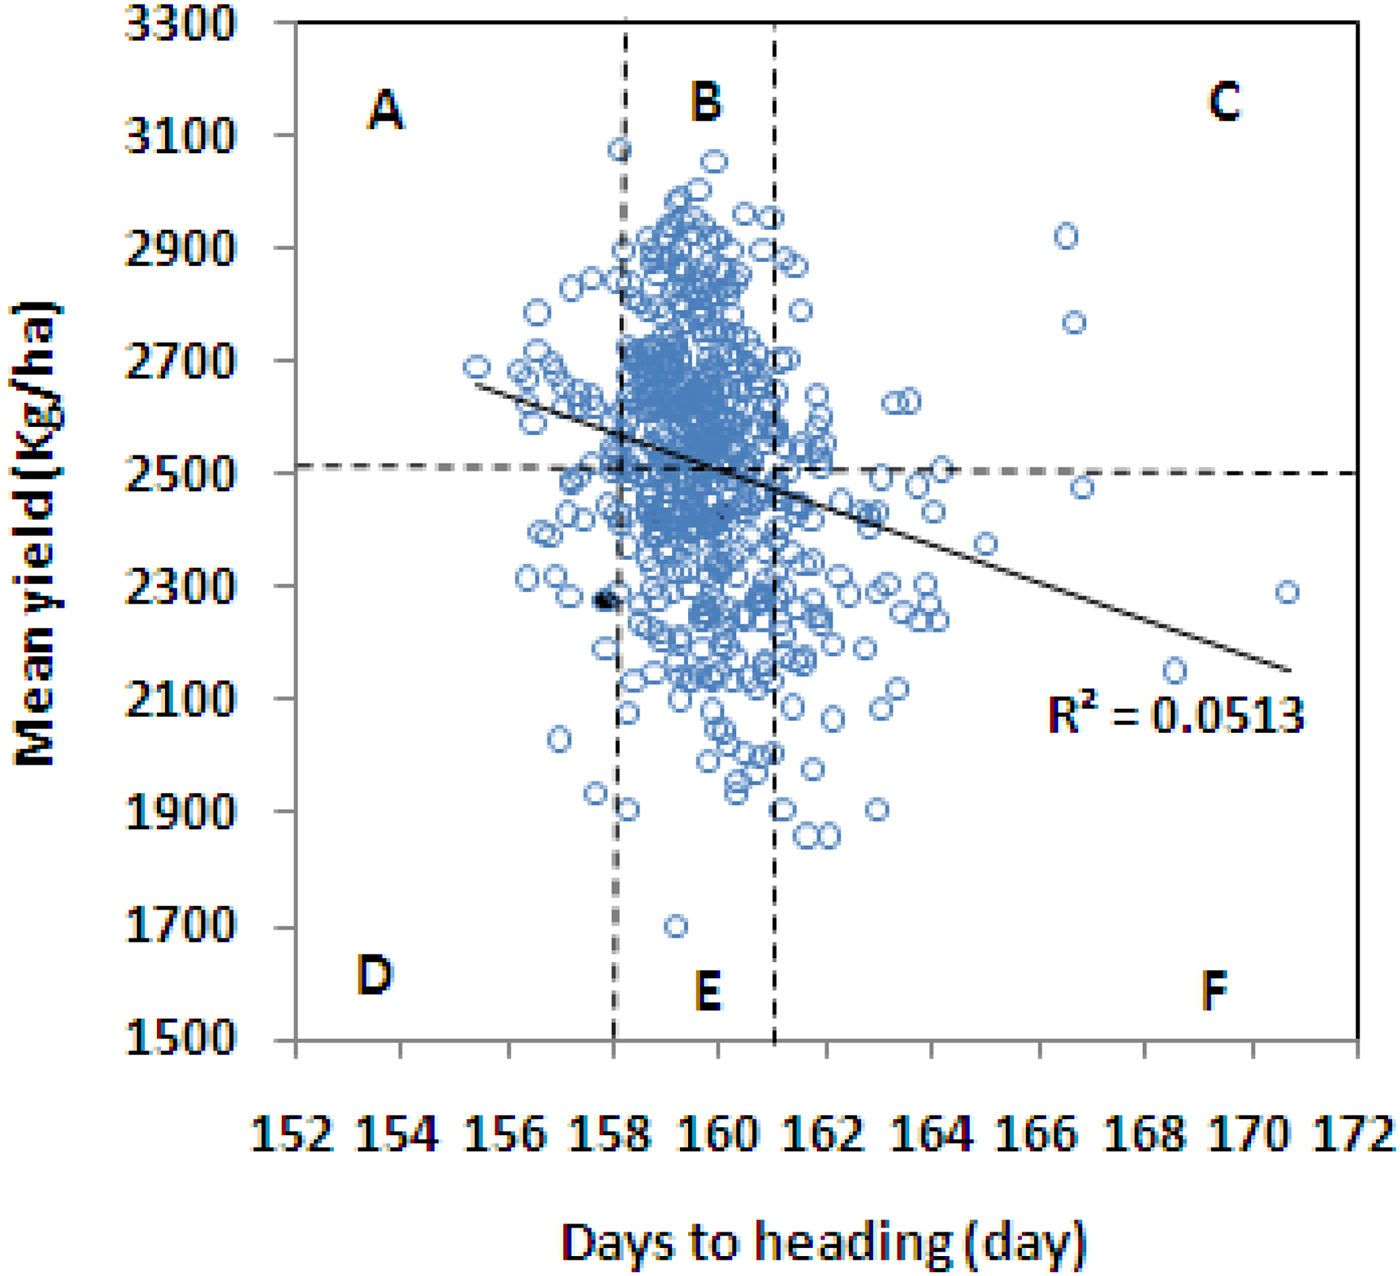
A negative relationship was found between grain yield and days to heading, but there was a large variability in both traits. Based on the selection criteria of ecotypes with mean heading date – 1s.d. and above average grain yield (2512 kg/ha), 34 ecotypes with earlier flowering and high yielding were identified (Fig. 3). Table 4 lists the ecotypes that were identified based on days to heading and grain yield levels, grouped into ecotypes with early heading and high grain yield (157–159 days and 2787–3078 kg/ha), ecotypes with late heading and high grain yield (160–167 days and 2744–2963 kg/ha), ecotypes with early heading and low grain yield (157–159 days and 1699–2277 kg/ha), and ecotypes with late heading and low grian yield (162–169 days and 1860–2272 kg/ha).
Ecotypes that had above average grain yield (2512 kg/ha) and recorded variations in heading date across environments. Quadrants (a) identifies ecotypes which had earlier heading (<mean – s.d.) and high yields, (b) ecotypes with normal heading (between mean ± s.d.) and high yields, (c) ecotypes with late heading (>mean + s.d.) and high yields, (d) ecotypes with earlier heading (<mean – s.d.) and low yields, (e) ecotypes with normal heading (between mean ± s.d.) and low yields and (f) ecotypes with late heading (>mean + s.d.) and low yields. Colour online.
Ecotypes selected based on grain yield (YLD, kg/ha) and heading date (DH, day) over 3 years (2009–12) at Maragheh station, Iran

Multivariate analyses
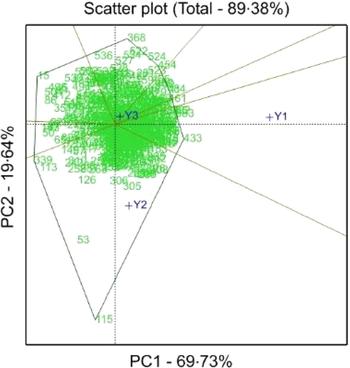
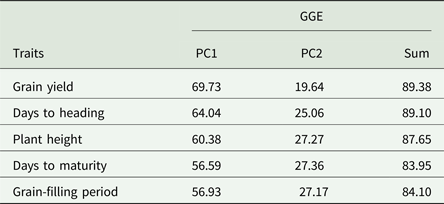
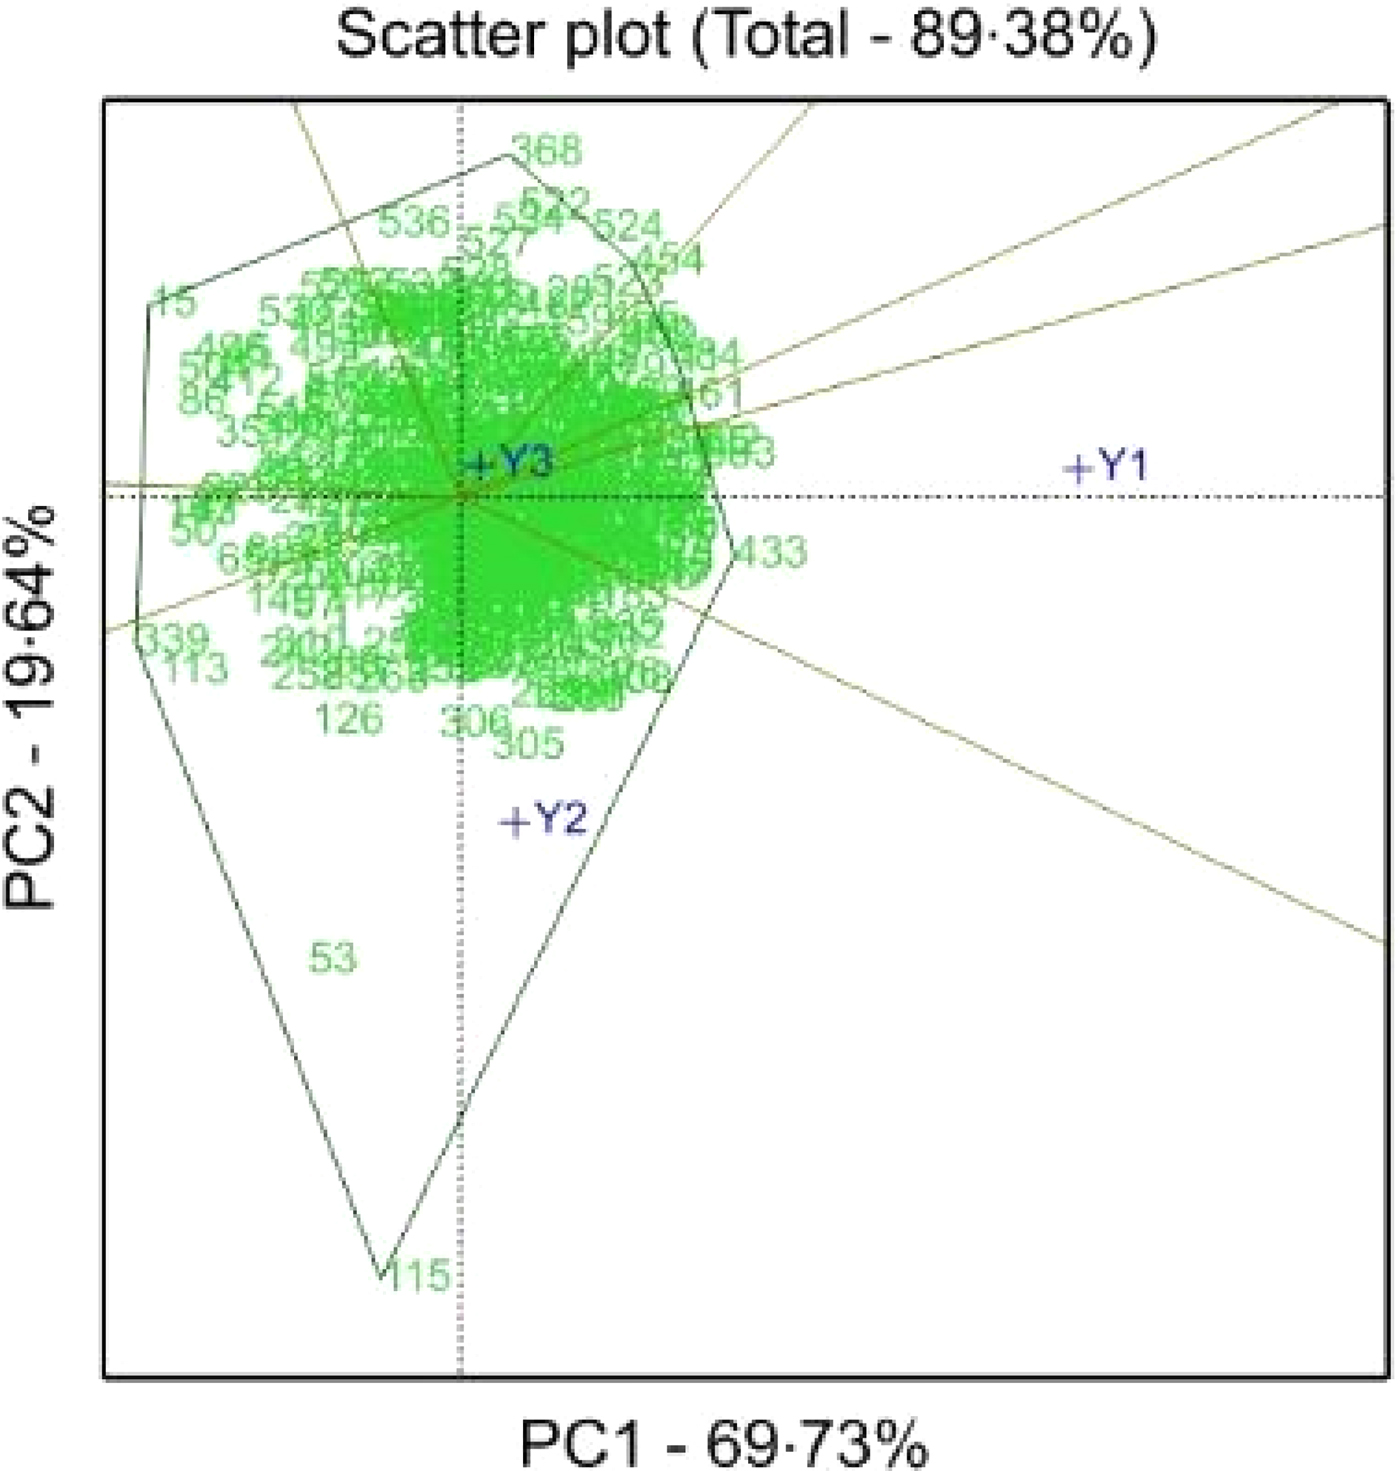
The GE interactions were further explored through a GGE biplot analysis. The first two principal components of the GGE biplots explained 89.38% (PC1 = 69.73% and PC2 = 19.64%) of the total GGE variation for grain yield (Table 5). The summed explained variances of the first two principal components for the other traits are listed in Table 5. For grain yield data, a GGE biplot was constructed with the polygon view to reveal the presence or absence of crossover ecotype × year interaction (Fig. 4). The grouping pattern of years was not repeatable and seemed to be year-dependent. In each year, some ecotypes were grouped together, indicating a relatively high similarity. According to the GGE biplot, the Maragheh location can be considered as a single complex ME, where highly unpredictable ecotype × year interaction is expected.
Genotype and genotype × environment (GGE) biplot for best Sardari wheat ecotypes in different environments for grain yield. Colour online.
Trait-wise principal components 1 and 2 variance (PC1 and PC2) of total GGE variation in the studied traits evaluated over three environments

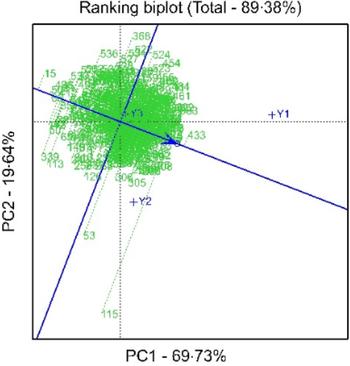
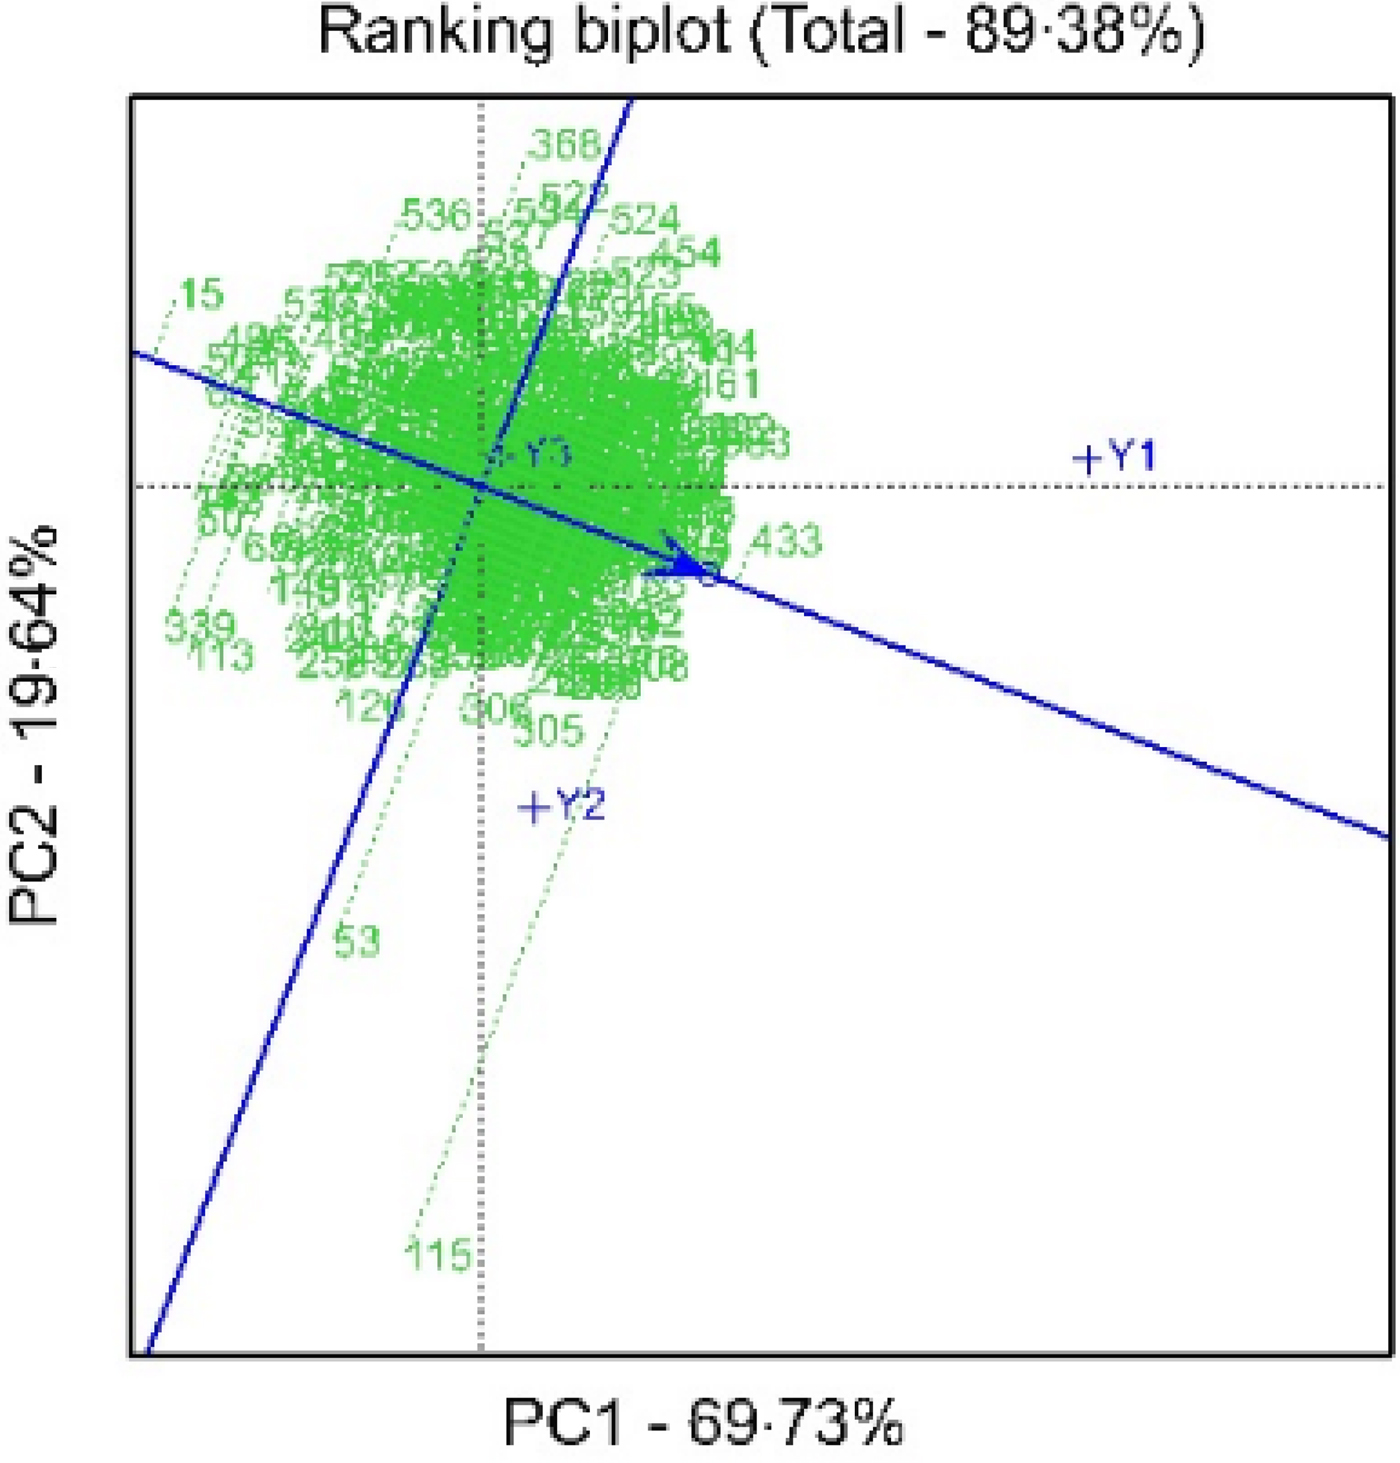
Figure 5 shows mean grain yield and stability performance of the 536 ecotypes based on the ‘average tester coordinate’ (ATC). The mean yield performance of ecotypes is approximated by the projections of their markers on the ATC axis. The length of the average environment vector was sufficient to select ecotypes based on mean yield. About half of the ecotypes had above-average mean yield, whereas the remaining ecotypes had below-average mean yield. Ecotype 433 with high-yielding performance was the most stable ecotype, while ecotypes 115, 53, 305, 306, 454 and 524 with high grain yield were unstable. The results indicated that some ecotypes with higher stability were ranked as top-yielding entries that would be good candidates for further evaluation and recommendation for the cold rainfed areas of Iran.
Genotype and genotype × environment (GGE) biplot showing ranking based on both mean yield and stability of performance of 536 Sardari wheat ecotypes and three controls. Colour online.
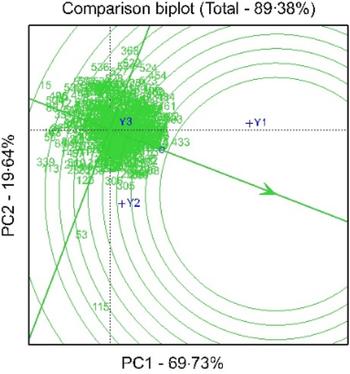
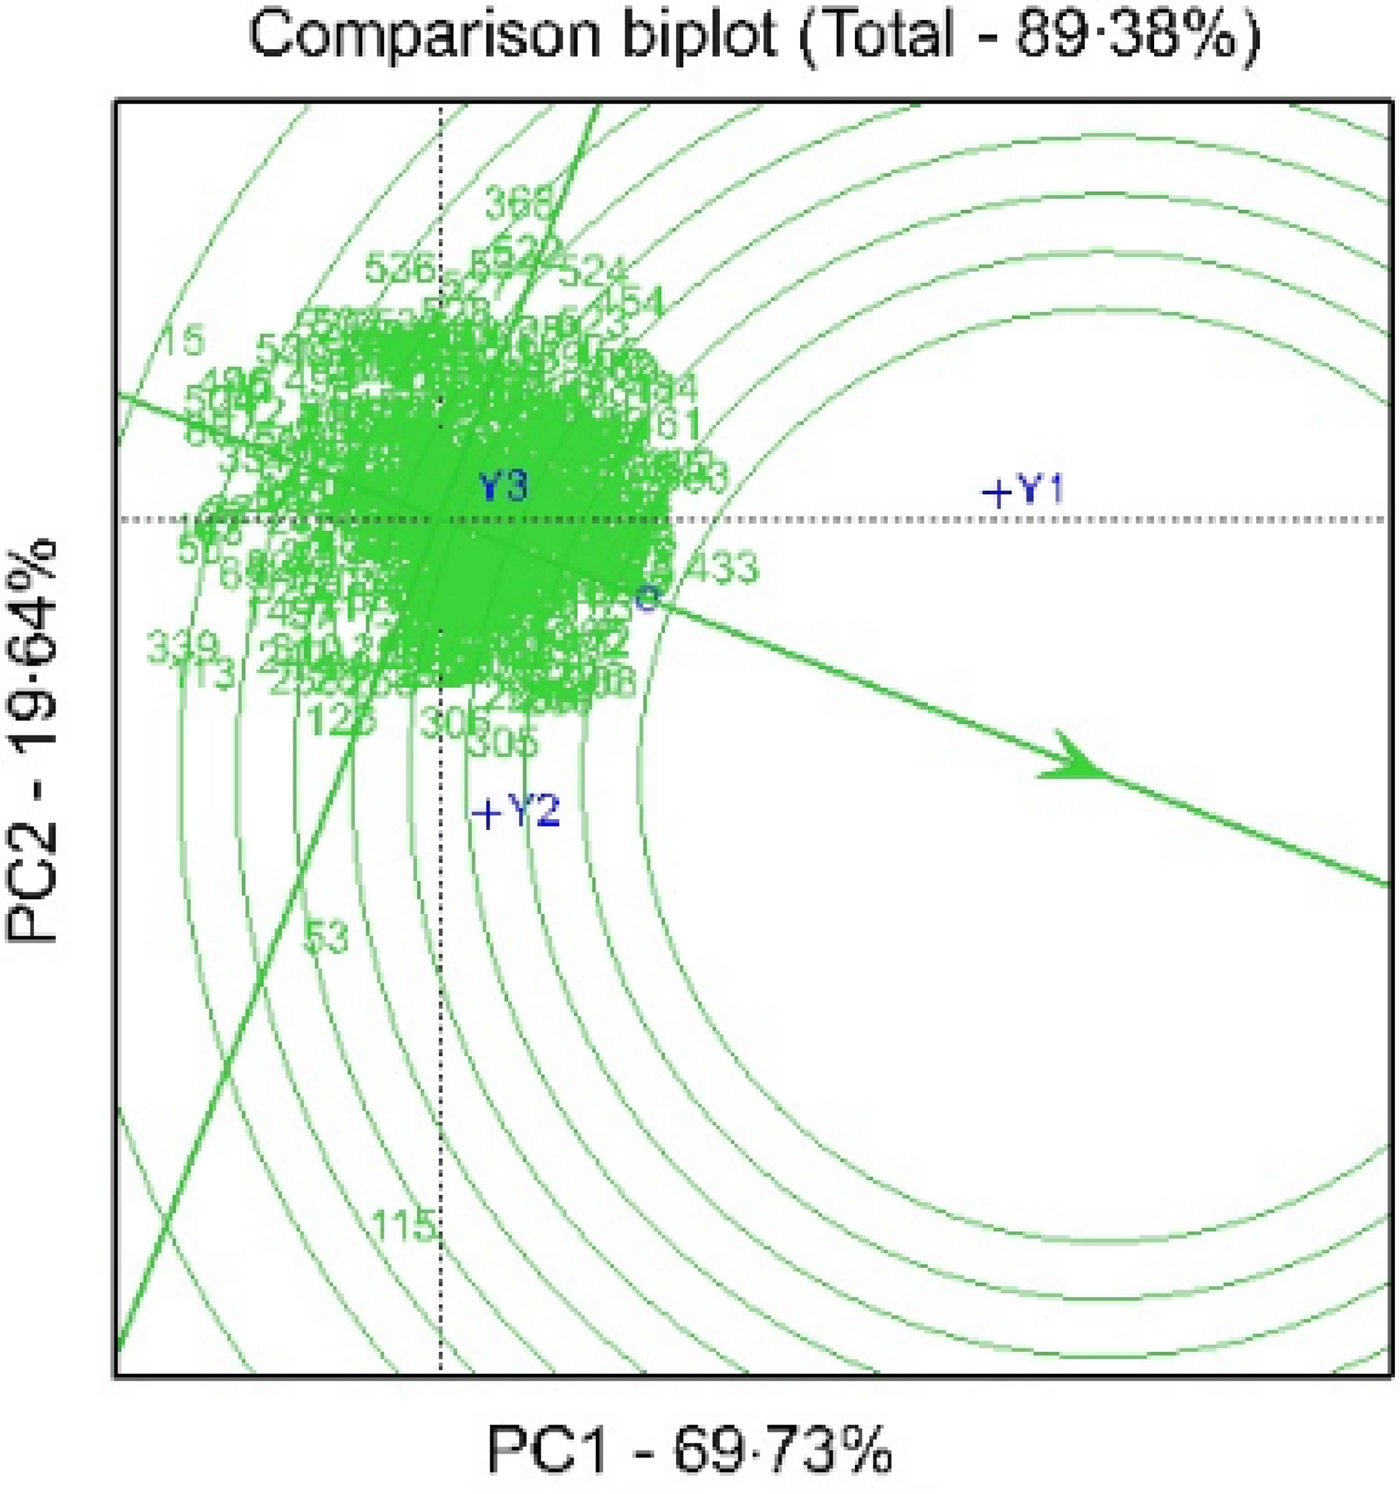
According to the GGE biplot, the ideal genotype must have a high PC1 value (high mean productivity) and a PC2 value near to zero (more stable) (Yan and Kang, Reference Yan and Kang2003). Therefore, ecotype 433 can be regarded as an ideal genotype (Fig. 6): it was stable, as it was located very near the ATC abscissa and had a small projection onto the ATC ordinate. This indicates that its rank was highly consistent across environments. Like ecotype 433, some other ecotypes (i.e., 267, 75, 56, 112, 273, 209, 366, 377, 278) near to the ideal genotype can be found. In contrast, some ecotypes (i.e. ecotypes 115 and 53) with the least stability tended to be specifically adapted to certain environments.
Genotype and genotype × environment (GGE) biplot of ideal genotype and comparison of the 536 ecotypes and three controls with the ideal genotype. Colour online.
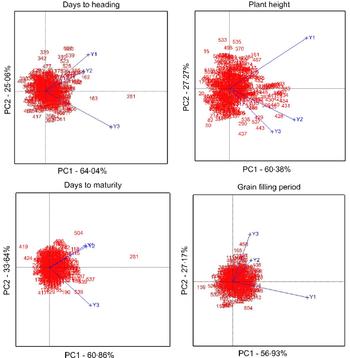
The summary of the inter-relationships among the environments for morphological traits is presented in Fig. 7. The environment vectors drawn from the biplot origin to connect the environments revealed positive PC1 scores for the environments. Depending on trait, there are sharp angles between two out of three environments in the current study, indicating positive correlations among them. These results were confirmed by Pearson's correlations (data not shown). For all traits, environments had moderate-to-high PC2 scores showing that the environments discriminated the ecotypes. This result is supported by the high ratios of GE interaction variance to genotypic variance (Table 1). For the traits of days to heading and maturity, 2011/12 was not correlated with 2009/10 and 2010/11 in ecotype rankings, and for plant height and grain-filling duration, 2009/10 was not correlated with 2010/11 and 2011/12 in ecotype rankings. This indicates that the trait-based ranking of ecotypes varies across environments 2009/10 (with high rainfall) and 2011/12 (with low rainfall).
Genotype and genotype × environment (GGE) biplots for the morphological traits showing the relationship among the environments for days to heading, plant height, days to maturity and grain-filling period. Colour online.
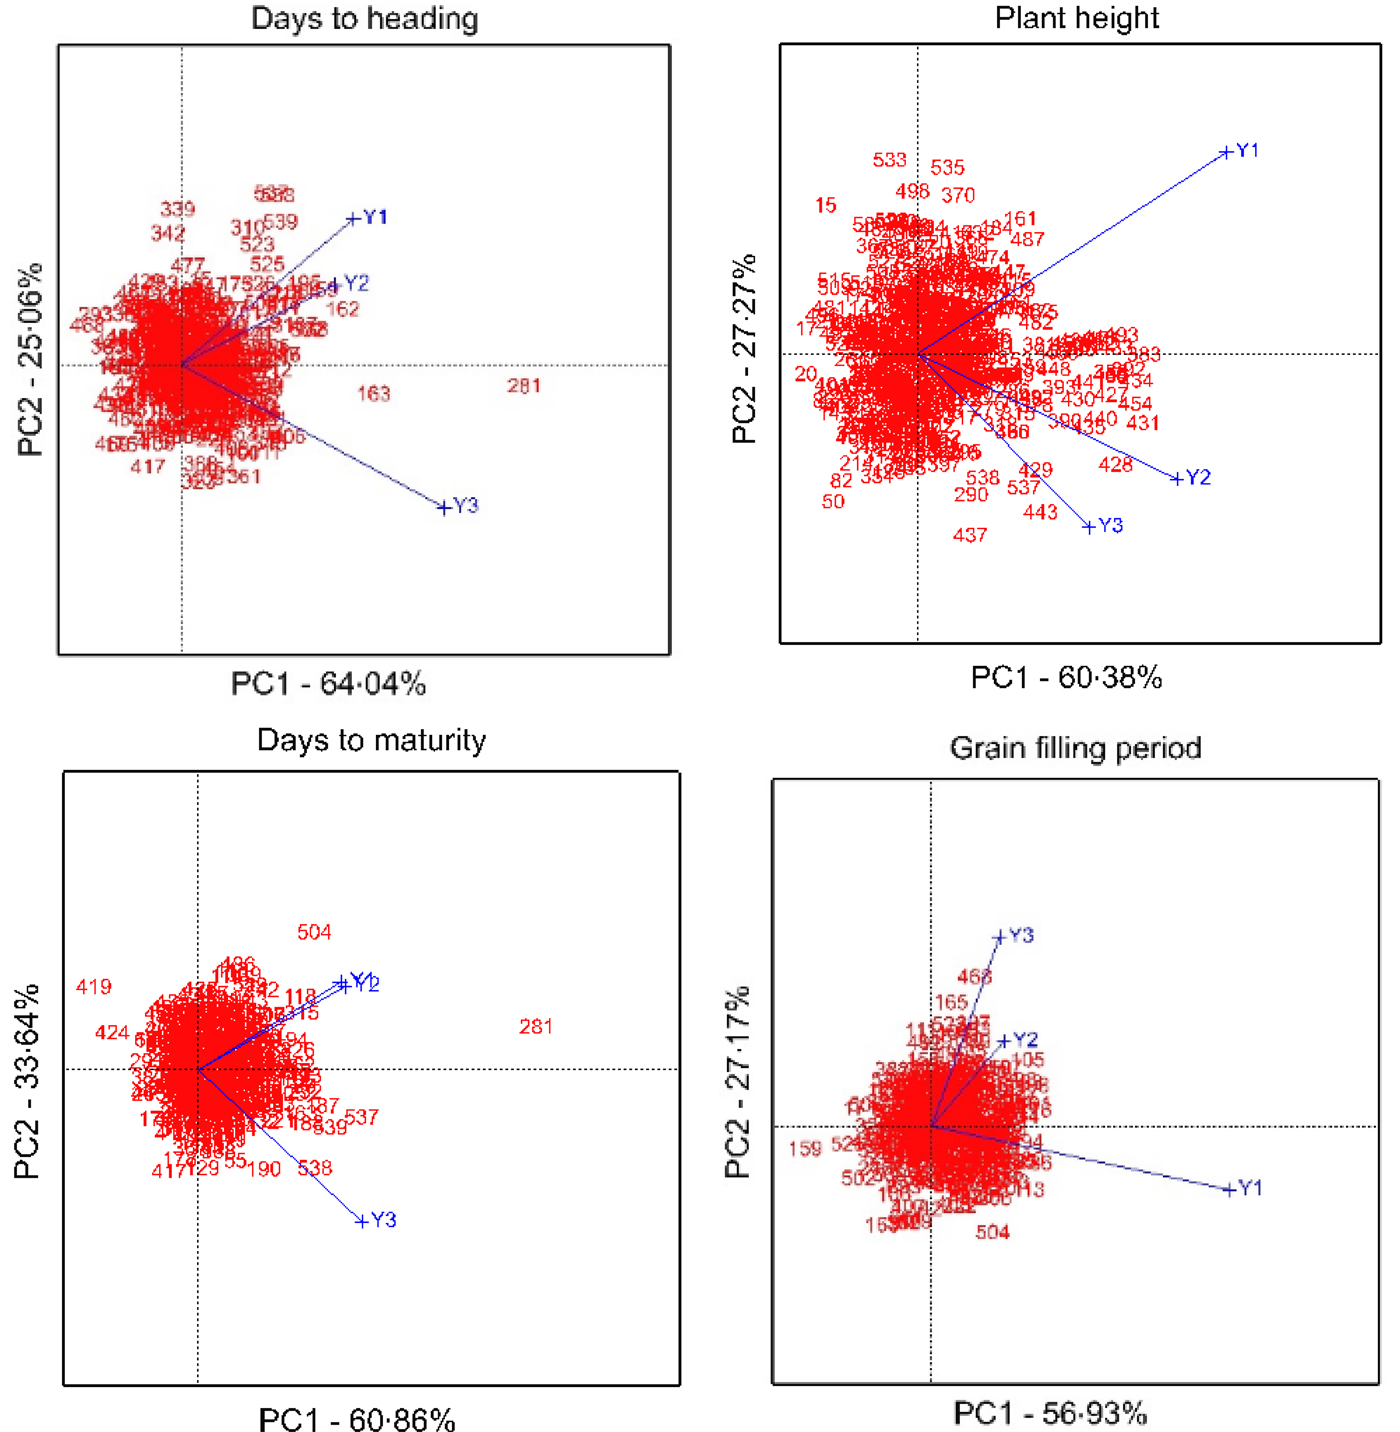
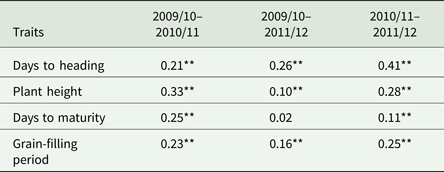
For the trait days to maturity, the environment vectors for 2009/10 and 2010/11 were similar in length and had high PC1 scores. For plant height and grain-filling period, the length of environment vector of 2009/10 was longer than for 2010/11 and 2011/12, thus environment 2009/10 was more capable of discriminating the ecotypes, while for days to heading and maturity, the environment 2011/12 was more capable of discriminating the ecotypes (Fig. 7). The distance between two environments measures their similarity or dissimilarity in discriminating the genotypes (Yan and Tinker Reference Yan and Tinker2006). For the traits of days to maturity and heading, environments 2009/10 and 2010/11 were similar in discriminating genotypes. Also, for plant height and grain-filling duration, 2010/11 and 2011/12 were similar in discriminating ecotypes. This is confirmed by the significant positive correlations between 2009/10 and 2010/11, and 2010/11 and 2011/12 (Table 6).
Pearson's correlation coefficients of traits measured across environments (N = 539)

**P < 0.01.
Discussion
Weather conditions underlying genotype × environment interaction
In Mediterranean environments, rainfall and temperature are unpredictable, resulting in inconsistent environmental conditions for crop growth and large G × E interactions (Mohammadi et al., Reference Mohammadi, Sadeghzadeh, Armion and Amri2011). Due to G × E interaction, the ranking of genotypes might change, so the best genotype in one environment might not be best in another (Falconer and Mackay, Reference Falconer and Mackay1996). Environments (years) in the current study showed wide variation, reflecting contrasting conditions (i.e. 2011/12 as severe stress v. 2009/10 as optimum conditions), as could be deduced from the wide yield range observed (from near crop failure to relatively good yields).
Phenotypic diversity
The high phenotypic diversity observed in Sardari bread wheat ecotypes shows that there is large potential for improvement of bread wheat under rainfed cold conditions. However, this variation is probably only a proportion of the variation that exists in the gathered Sardari ecotypes in some parts of Iran. Thus, further evaluation appears justified to use and conserve this potentially valuable genetic resource. Breeding strategies need to exploit existing variation within the Sardari wheat ecotypes to broaden the genetic basis of currently adapted and commercially grown cultivars. However, the Sardari ecotypes showed continuous variation for the traits studied.
The results indicated a high level of phenotypic diversity among the Sardari bread wheat ecotypes. Probably, cultivation of local Sardari populations over many years and combinations of ecotypes screened by natural selection to be adapted to stressful environmental conditions in different areas have caused such phenotypic diversity. Sadeghzadeh et al. (Reference Sadeghzadeh Ahari, Katata and Rostaei2004) reported that residual impurity in initial purified lines, cross-fertilization (although limited), genetic mutation, mechanical mixture, exchange among fields and single-spike selection can have important roles in the development of genetic variation of the Sardari ecotypes. This variation can be justified by the grain yield stability and adaptation of Sardari wheat ecotypes with diversified environmental conditions in cold and moderate cold dryland areas of Iran.
Heritability is the proportion of phenotypic variance that is attributed to genetic variance. In the Sardari bread wheat ecotypes, heritability was moderate (56–60%) for all traits studied. Moderate heritability indicates high environmental influence on the traits. This medium-estimated heritability for different traits supports the idea that selection for yield under stress conditions is complicated by low heritability and large G × E interactions (Ceccarelli, Reference Ceccarelli, Cooper and Hammer1996). The present results are in accordance with earlier works by Ehdaie and Waines (Reference Ehdaie and Waines1989), Belay et al. (Reference Belay, Tesemma, Becker and Merker1993) and Mohammadi et al. (Reference Mohammadi, Haghparast, Sadeghzadeh, Ahmadi, Solimani and Amri2014), who have reported moderate heritability for different grain yield-related traits in wheat. The comparatively moderate heritability for grain yield of the Sardari wheat ecotypes may be due to the fact that grain yield is a low heritable trait, controlled by many genes. This implies that progress in selection for grain yield trait in wheat under drought is generally slow.
Results indicated high crossover ecotype × year interactions. For the traits with high ecotype × year interaction and moderate heritability, selection can be done at the target environments. Thus, the information on variability and heritability of traits is essential for identifying traits amenable to genetic improvement through selection (Vidya et al., Reference Vidya, Oommen and Kumar2002). The heritability estimates found for the studied traits under unpredictable conditions demonstrated that Sardari bread wheat ecotypes responded differentially across the years. Therefore, phenotypic selection based on these traits would not be highly reliable or effective.
Inter-relationships among test environments
The environments were positively correlated because the angles among them were <90 °. Similar trends in the relationships of environments for wheat were found by Yan et al. (Reference Yan, Hunt, Sheng and Szlavnics2000), Rharrabti et al. (Reference Rharrabti, Garcia del Moral, Villegas and Royo2003) and Mohammadi et al. (Reference Mohammadi, Haghparast, Amri and Ceccarelli2010). However, relationships between environments was not consistent based on all recorded traits. For grain yield, no correlation was found among environments, while for days to heading and maturity, environments 2009/10 and 2010/11 were closely correlated, and for plant height and grain-filling duration, 2010/11 and 2011/12 were closely correlated. In a situation where the same trait is measured on the same genotypes in different environments, indirect selection can be applied. The significant correlation coefficients between test environments suggest that indirect selection for grain yield can be applied across the target environments. However, the higher yielding ecotypes in environment 2009/10 did not show similar responses in the other two environments.
Ecotype adaptation and yield stability
The Sardari bread wheat ecotypes showed variability in adaptation to the target region, thus selection can be performed to develop cultivars adapted to different conditions. However, stability and adaptation are of vital importance in Mediterranean environments, particularly in Iran, where fluctuations in growing conditions are very high (Mohammadi et al., Reference Mohammadi, Sadeghzadeh, Armion and Amri2011). Therefore, by exploiting the good adaptation and stability of these materials, it would be possible to develop high-yielding and well-adapted genotypes. By comparing the ecotypes with controls at the target location, about 0.13 of ecotypes had better yield. Simultaneous selection for yield and stability of performance is an important consideration in breeding programmes (Kang, Reference Kang1993; Kang and Magari, Reference Kang, Magari, Kang and Gauch1996). In the current study, Sardari wheat ecotypes showed high yield and better yield stability than the control cultivars. However, in the long term, selection for grain yield potential will reduce the stability of performance (Loomis and Conner, Reference Loomis and Connor1996). This can be confirmed by Calderini and Slafer (Reference Calderini and Slafer1999), who found that modern wheat cultivars had lower stability performance than the old varieties. This decrease in yield stability was associated with improved capacity of modern cultivars to capture and benefit from better growing conditions without yield reduction under stress environments. Based on the current results, some ecotypes will be of particular interest to breeders because of their significantly superior yield, specific adaptation and stability. The improved mean values for yield, stability and adaptation compared with the controls could reflect the impact of selection for these traits under drought and cold stress conditions of Iran. The results verified that there is a chance of success in breeding and selection for high yield and stability performance by utilizing these ecotypes under rainfed cold conditions.
Significant gains in grain yield and its stability over the environments in comparison to the control cultivars were obtained. Genetic gains in grain yield were observed mostly in the optimal environment (favourable year) rather than the unfavourable environment. This agrees with other reports (Ceccarelli, Reference Ceccarelli, Cooper and Hammer1996; Munoz et al., Reference Munoz, Voltas, Araus, Igartua and Romagosa1998; Donmez et al., Reference Donmez, Sears, Shroyer and Paulsen2001; Mohammadi and Amri, Reference Mohammadi and Amri2013). Although these differences could be attributed to differences in the genetic material tested as well as to differences in the testing environments, the Sardari bread wheat ecotypes showed considerable variability in grain yield stability and adaptation to different environmental conditions that could be explored in wheat breeding programmes for cold rainfed conditions. The results verified that the Sardari wheat ecotypes could be classified based on grain yield and stability performance. Such groupings are useful to wheat breeders in identifying candidate ecotypes that may be released as new cultivars. The results of the current research indicated that some Sardari wheat ecotypes were out-yielded by the best controls in both grain yield and yield stability, which agrees with previous studies (Donmez et al., Reference Donmez, Sears, Shroyer and Paulsen2001; Tollenaar and Lee, Reference Tollenaar and Lee2002; Morgounov et al., Reference Morgounov, Zykin, Belan, Roseeva, Zelenskiy, Gomez-Becerra, Budak and Bekes2010; Xiao et al., Reference Xiao, Qian, Wu, Liu, Xia, Ji and He2012). However, the results of grain yield stability showed that the high grain yield and stability analysis are not mutually exclusive, which is also supported by other reports (Ortiz et al., Reference Ortiz, Wagoire, Hill, Chandra, Madsen and Stølen2001; Tollenaar and Lee, Reference Tollenaar and Lee2002; Morgounov et al., Reference Morgounov, Zykin, Belan, Roseeva, Zelenskiy, Gomez-Becerra, Budak and Bekes2010).
Conclusion
The Sardari bread wheat ecotypes showed considerable variability for the studied traits that could be exploited for crop improvement. Multivariate analysis based on phenotypic traits suggested that the Sardari bread wheat ecotypes could be grouped. Such groupings are useful to wheat breeders in cold rainfed ecologies in identifying potential ecotypes that may be released as new cultivars or used as ‘parents’ in wheat breeding programmes for any of the morphological traits that were studied. Further studies combining morphological and molecular data may facilitate a better understanding of the patterns of genotypic variation between and within the ecotypes and may determine whether the genetic diversity has been conserved ex situ in a favourable way comparable to that in the centre of diversity.
Financial support
This research received no specific grant from any funding agency, commercial or not-for-profit sectors.
Conflicts of interest
None.
Ethical standards
Not applicable.