I. INTRODUCTION
The depth-sensing indentation technique has drawn attention for several decades. Oliver and PharrReference Oliver and Pharr1 proposed a model to calculate Young’s modulus based on the assumption that the material exhibits pure elastic behavior. Data acquired for metals, ceramics, polymers, and composites exhibited a range of behaviors and this prompted researchers to undertake extensive studies to improve the methodology for this technique.Reference LaFontaine, Yost, Black and Li2–Reference Huang, Wei and Lee11 When viscoelastic effects arise between indenter tip and specimen, the Young’s modulus obtained by the Oliver and Pharr method does not produce accurate results. To alleviate this problem, Briscoe et al.Reference Briscoe, Fiori and Pelillo12 suggested imposing a long creep period at the peak load before unloading. Yang et al.Reference Yang, Zhang and Zeng13 proposed a semiempirical elastic–viscoelastic–viscous model to explain the creep behavior of polymers under rapid loading speeds using a Berkovich nanoindenter which employs a three-sided pyramid tip. Tweedie and VlietReference Tweedie and Vliet14 found that linear viscoelastic behavior was not noted in polymers when the creep compliance was measured by a conical or other sharp nanoindenter, regardless of the loading rate. Goodall and ClyneReference Goodall and Clyne15 proposed a power-law creep method to analyze steady-state nanoindentation creep. The above literature failed to explain the whole range of nanoindentation creep displacement curves.
Liu et al.Reference Liu, Lee, Sung and Nguyen10 explained loading and unloading displacement curves by using the viscoelastic Burgers model in which a Maxwell element is connected with a Kelvin element in series. Huang et al.Reference Huang, Wei and Lee11 used the viscoelastic Burgers model and power-law creep model to explain transient and steady-state nanoindentation creep of amorphous polymers. Our laboratory is currently interpreting a series of studies on the nanoindentation of viscoelastic materials. This article focuses on the application of the viscoelastic Burgers model and power-law creep model to polycarbonate (PC) and syndiotactic polystyrene (sPS). Indentation induces chain orientation or crystallinity in these amorphous materials. The purpose of the present study is to verify the validity of previous theories on stress-induced crystalline (or chain orientation) materials.
II. EXPERIMENTAL
Transparent PC (Lexan 9030−112) and opaque pellets of semicrystalline sPS (Qustera QA 102) were obtained from General Electric Company (Fairfield, CT) and Dow Chemical Company (Midland, MI), respectively. The weight average molar masses of PC and sPS are 3.7 × 10⁴ and 3.5 × 10⁵ g/mol, respectively. Sample preparation techniques are described by Liu et al.Reference Liu, Lee, Sung and Nguyen10 PC specimens of 10 × 10 × 1 mm3 were cut from the sheet. The semicrystalline sPS pellets were molded in a Carver 3912 hot press (Wabash, IN) under pressure at 300 °C for 5 min. Specimens were then quenched in ice water (0 °C) to ensure that the matrices were amorphous. After this, sPS appeared transparent and amorphous. Both amorphous sPS and PC specimens were carefully polished with 0.05 μm alumina slurries to obtain a mean roughness of 14.7 and 13.2 nm, respectively. They were annealed at temperatures near their glass transition temperatures (147 and 99 °C for PC and sPS, respectively) in an oven for 24 h. Nanoindentation creep tests were carried out at 25 °C using a Nanoindenter XP (MTS Systems, Oak Ridge, TN) with a diamond Berkovich tip. Samples were ramped to peak load 2.0 mN for PC and 2.5 mN for sPS. The load was held constant until a steady-state was reached. The preload rates were 0.2 mN/s (t R = 10 s), 0.04 mN/s (t R = 50 s), 0.02 mN/s (t R = 100 s), 0.0067 mN/s (t R = 300 s), and 0.002 mN/s (t R = 1000 s) for PC and 0.25 mN/s (t R = 10 s), 0.05 mN/s (t R = 50 s), 0.025 mN/s (t R = 100 s), 0.0083 mN/s (t R = 300 s), and 0.0025 mN/s (t R= 1000 s) for sPS. Nanoindentation tests were performed on six different locations for each specimen per preload rate, with the distance between two nearest locations being approximately 500 μm.
III. RESULTS AND DISCUSSION
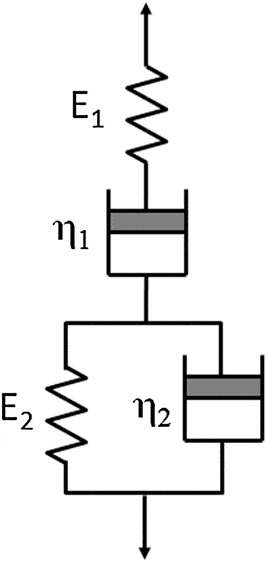
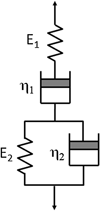
An indentation creep curve consists of a transient stage attributed to viscoelastic behavior and a steady-state attributed to power-law creep behavior. The experimental data for nanoindentation creep studies on PC and sPS are shown in Figs. 1(a) and 1(b). Figure 1 shows that for a given creep time, the displacement increases with decreasing preload period (or increasing preload rate). Note that preload rate is inversely proportional to preload period. The displacement at creep time, t, shown in Fig. 1, is equal to the displacement at t R subtracted from the displacement at (t + t R), where t R is the preload period. The creep displacement is the summation of viscoelastic and power-law creep displacement. The power-law creep component is negligible during the transient stage. Therefore, the transient creep displacement can be interpreted by the viscoelastic Burgers model.Reference Huang, Wei and Lee11 A schematic of the viscoelastic Burgers model is shown in Fig. 2. The viscoelastic Burgers model consists of a Maxwell element (spring and dashpot in series) and a Kelvin element (spring and dashpot in parallel) connected in series. In the following, indices 1 and 2 represent the Maxwell and Kelvin elements, respectively. Symbols K, G, and η stand for bulk modulus, shear modulus, and Newtonian shear viscosity. The transient creep displacement is written asReference Huang, Wei and Lee11
 $$h(t) = h_{{\rm{evc}}} (t + t_{\rm{R}}) - h_{{\rm{evc}}} (t_{\rm{R}}),$$
The transient creep displacement–time curves with various preload periods, t R (or loading rate,  $\dot P$): (a) polycarbonate (PC) and (b) syndiotactic polystyrene (sPS).

Schematic of viscoelastic Burgers model.

where
 $$\eqalignb{ h_{{\rm{e\nu c}}}^2 (t + t_{\rm{R}} ) = \,h_{{\rm{e\nu c}}}^2 (t_{\rm{R}} ) + {{P_{\rm{R}} (t)} \over {4Q_{\rm{e}} \eta _{{\rm{1,c}}} }} + {{P_{\rm{R}} } \over {4Q_{\rm{e}} G_{{\rm{2,c}}} }}( {1 - e^{ - G_{{\rm{2,c}}} t/\eta _{{\rm{2,c}}} } } ) \cr+ {{3G_{1,{\rm{c}}}^2 (\eta _{{\rm{1,c}}} + \eta _{{\rm{2,c}}} )P_{\rm{R}} } \over {4Q_{\rm{e}} \eta _{{\rm{1,c}}} \eta _{{\rm{2,c}}} (3K_{\rm c}^{^*}+ G_{{\rm{1,c}}} )^2 (b_{\rm{c}} - a_{\rm{c}} )}} \cr \{ {[ {{{G_{{\rm{2,c}}} } \over {a_{\rm{c}} (\eta _{{\rm{1,c}}} + \eta _{{\rm{2,c}}} )}} - 1} ]( {1 - e^{ - a_{\rm{c}} t)} } ) - {[ {{{G_{{\rm{2,c}}} } \over {b_{\rm{c}} ( {\eta _{{\rm{1,c}}} + \eta _{{\rm{2,c}}} } )}} - 1} ]( {1 - e^{b_{\rm{c}} ( {t_{\rm{R}} - t} )} } )} \},} } $$
 $$\eqalignb{ h_{{\rm{e\nu c}}}^2 (t_{\rm{R}} ) = \,\amp {{P_{\rm{R}} } \over {Q_{\rm{e}} }}[ {{{1 - \nu _{\rm{d}}^2 } \over {E_{\rm{d}} }} + {{(3K_{\rm{l}}^{^* } + 4G_{{\rm{1,l}}} )} \over {4G_{{\rm{1,l}}} (3K_{\rm{l}}^{^* } + G_{{\rm{1,l}}} )}}} ] + {{P_{\rm{R}} t_{\rm{R}} } \over {8Q_{\rm{e}} \eta _{{\rm{e,l}}} }} + {{{\mathop p\limits^ \bullet} _{\rm{1}} } \over {4Q_{\rm{e}} G_{{\rm{2,l}}} }}( {t_{\rm{R}} - {{\eta _{{\rm{2,l}}} } \over {G_{{\rm{2,l}}} }} + {{\eta _{{\rm{2,l}}} } \over {G_{{\rm{2,l}}} }}e^{ - {{G_{{\rm{2,l}}} t_{\rm{R}} } \over {\eta _{{\rm{2,l}}} }}} } ) + {{3G_{{\rm{1,l}}}^2 (\eta _{{\rm{1,l}}} + \eta _{{\rm{2,l}}} ){\mathop p\limits^ \bullet}} _{\rm{1}} \over {4Q_{\rm{e}} \eta _{{\rm{1,l}}} \eta _{{\rm{2,l}}} (3K_{\rm{l}}^* + G_{{\rm{1,l}}} )^2 (b_{\rm{l}} - a_{\rm{l}} )}}\{ {[ {{{G_{{\rm{2,l}}} } \over {a_{\rm{l}} (\eta _{{\rm{1,l}}} + \eta _{{\rm{2,l}}} )}} - 1} ]} ( {t_{\rm{R}} - {1 \over {a_{\rm{l}} }} + {1 \over {a_{\rm{l}} }}e^{ - a_{\rm{l}} t_{\rm{R}} } } ) \cr \! { - [ {{{G_{{\rm{2,l}}} } \over {b_{\rm{l}} (\eta _{{\rm{1,l}}} + \eta _{{\rm{2,l}}} )}} - 1} ]( {t_{\rm{R}} - {1 \over {b_{\rm{l}} }} + {1 \over {b_{\rm{l}} }}e^{ - b_{\rm{l}} t_{\rm{R}} } } )} \},}$$
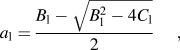 $$a_{\rm{l}} = {{B_{\rm{l}} - \sqrt {B_{\rm{l}}^2 - 4C_{\rm{l}} } } \over 2},$$
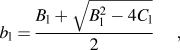 $$b_{\rm{l}} = {{B_{\rm{l}} + \sqrt {B_{\rm{l}}^2 - 4C_{\rm{l}} } } \over 2},$$
 $$B_{\rm{l}} = {{G_{{\rm{2,l}}} \eta _{{\rm{1,l}}} (3K_{\rm{l}}^* + G_{{\rm{1,l}}} ) + 3K_l^* G_{{\rm{1,l}}} (\eta _{{\rm{1,l}}} + \eta _{{\rm{2,l}}} )} \over {\eta _{{\rm{1,l}}} \eta _{{\rm{2,l}}} (3K_{\rm{l}}^* + G_{{\rm{1,l}}} )}}{\rm{,}}$$
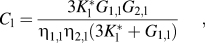 $$C_{\rm{l}} = {{3K_{\rm{l}}^* G_{{\rm{1,l}}} G_{{\rm{2,l}}} } \over {\eta _{{\rm{1,l}}} \eta _{{\rm{2,l}}} (3K_{\rm{l}}^* + G_{{\rm{1,l}}} )}},$$
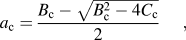 $$a_{\rm{c}} = {{B_{\rm{c}} - \sqrt {B_{\rm{c}}^2 - 4C_{\rm{c}} } } \over 2},$$
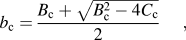 $$b_{\rm{c}} = {{B_{\rm{c}} + \sqrt {B_{\rm{c}}^2 - 4C_{\rm{c}} } } \over 2},$$
 $$B_{\rm{c}} = {{G_{{\rm{2,c}}} \eta _{{\rm{1,c}}} (3K_{\rm{c}}^{^* } + G_{{\rm{1,c}}}) + 3K_{\rm{c}}^{^* } G_{{\rm{1,c}}} (\eta _{{\rm{1,c}}} + \eta _{{\rm{2,c}}})} \over {\eta _{{\rm{1,c}}} \eta _{{\rm{2,c}}} (3K_{\rm{c}}^{^* } + G_{{\rm{1,c}}})}},$$
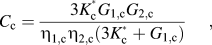 $$C_{\rm{c}} = {{3K_{\rm{c}}^{^* } G_{{\rm{1,c}}} G_{{\rm{2,c}}} } \over {\eta _{{\rm{1,c}}} \eta _{{\rm{2,c}}} (3K_{\rm{c}}^{^* } + G_{{\rm{1,c}}})}},$$
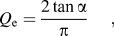 $$Q_{\rm{e}} = {{2\tan \alpha } \over \pi },$$
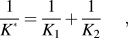 $${1 \over {K^{^* } }} = {1 \over {K_1 }} + {1 \over {K_2 }},$$
The subscripts “l” and “c” stand for the preload and creep periods, respectively. 2α is the effective included angle of the indenter tip. It is important to mention that for the same material, while the shear modulus and Newtonian shear viscosity can be different in preload and creep periods, Poisson’s ratio, ν, is assumed to be same in both stages. Young’s modulus, E (= 2G (1+ν)), is used to replace the shear modulus in the discussion below.
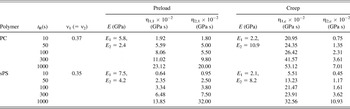
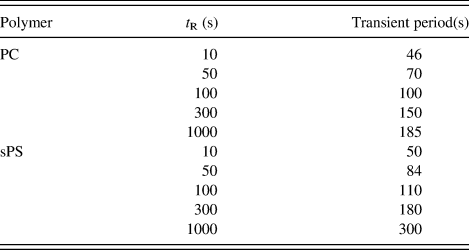
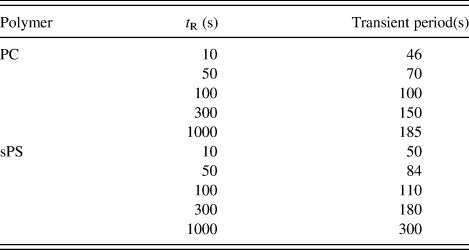
The solid lines in Fig. 1 are obtained using Eq. (1) and the parameters are listed in Table I. The displacement data are in good agreement with the theoretical predictions within a certain time scale or indentation depth. Table I shows that for a given t R, the Newtonian shear viscosity of the Maxwell element is greater in the creep period (η 1,c) than in the preload period (η 1,l), whereas the Kelvin element exhibits an opposite trend. Similarly, the Young’s modulus of the Maxwell element is less in the creep period than in the preload period, while the Kelvin element exhibits the opposite trend. The ratio of η 1,c to η 2,c increases with decreasing preload period. It is interesting that Liu et al.Reference Liu, Lee, Sung and Nguyen10 found that the Newtonian shear viscosity decreases with increasing viscous flow behavior. It appears that the transient displacement is dominated by the viscous displacement of the Kelvin element, since its Newtonian shear viscosity is smaller than that of the Maxwell element. The transient period, t c, and the preload period, t R, for PC and sPS are tabulated in Table II. As seen in Table II, the transient period increases with increasing preload period for both PC and sPS. For a given preload period, the transient period of PC is shorter than that of sPS, and this was explained by Brostow and Hagg Lobland.Reference Brostow and Hagg Lobland16 They reported brittleness values 0.11 × 10⁻¹⁰ and 8.8 × 10⁻¹⁰%Pa for PC and sPS, respectively. High values of viscoelastic recovery correspond to low brittleness, and their results imply that the material with high brittleness exhibits a long transient period in nanoindentation creep. Note that neither the Maxwell model nor the Kelvin model was found to fit the above transient creep data. Although many sets of Maxwell and Kelvin elements were used to fit the experimental data, there is one set that has physical meaning. For a given material, the Young’s modulus and Poisson’s ratio were assumed to be constant and independent of preload period while Newtonian shear viscosity appeared to increase with increasing preload period.
The fitted parameters, E 1, E 2, ν 1, ν 2, η 1,l, η 2,l, η 1,c, and η 2,c of polycarbonate (PC) and syndiotactic polystyrene (sPS) used in Eq. (1) with different preload periods, t R.

Transient periods of nanoindentation creep for PC and sPS with different preload periods, t R.
The Young’s modulus of the Maxwell element for both PC and sPS in the creep period is less than that in the preload period, but that of the Kelvin element has the opposite trend. This phenomenon is different from the Young’s moduli of Maxwell and Kelvin elements in poly(methyl methacrylate) (PMMA), hydroxyethyl methacrylate copolymer (HEMA), and fast-cure acrylic resin where creep period values are the same as those in the preload period.Reference Huang, Wei and Lee11 This was explained by the fact that Young’s modulus is affected by microstructure, and no structural changes were observed in HEMA, PMMA and fast-cure acrylic resin under the applied load at 25 °C. However, when amorphous PC or sPS was subjected to uniaxial drawing, deformation dependent crystallization and/or orientation was observed.Reference Mercier, Aklonis, Litt and Tobolsky17–Reference D’Aniello, Rizzo and Guerra21 Mercier et al.Reference Mercier, Aklonis, Litt and Tobolsky17 reported a viscoelastic stress-induced crystallization in PC annealed for 8 days at 190 °C. WuReference Wu18 observed molecular orientation and alignment without induced crystallization when amorphous PC was subjected to uniaxial drawing with a draw ratio greater than 1.61 at room temperature. Yan et al.Reference Yan, Ajji, Shinozaki and Dumoulin19 revealed that crystallization or formation of a mesomorphic structure in the sPS sample is controlled by drawing stress. They also mentioned that draw stress was draw ratio, draw rate, and temperature dependent. Furthermore, Strojny et al.Reference Strojny, Xia, Tsou and Gerberich20 found that crystallization in polymeric materials enhanced Young’s modulus and toughness. D’Aniello et al.Reference D’Aniello, Rizzo and Guerra21 reported that different polymorphic forms of unstretched sPS films have different elastic moduli and the magnitude increases in the order γ > α > δ>amorphous. The location beneath the nanoindenter tip has a singular stress, which is expected to be greater than the critical stress needed to induce orientation and/or crystallization in PC or sPS.Reference Mercier, Aklonis, Litt and Tobolsky17–Reference D’Aniello, Rizzo and Guerra21 Therefore, one can infer that the difference in Young’s modulus of PC (or sPS) between preload period and creep periods is due to polymeric chain orientation and/or crystallization.
The steady-state displacement is dominated by power-law creep. The power-law creep was proposed by Goodall and ClyneReference Goodall and Clyne15 and Huang et al.Reference Huang, Wei and Lee11 as
 $$\dot \varepsilon _{\rm{p}} = \lambda \sigma _{\rm{p}}^n ,$$
where  $\dot \varepsilon _{\rm{p}}$ and σ p are the effective strain and effective stress at the indenter tip, respectively; λ is a constant and n is an exponent factor. The effective stress at indenter tip is equal to the applied load, F, divided by the projected contact area at time, t,
 $$\sigma _{\rm{p}} = F/A_{\rm{p}},$$
where A p = 24.5 h p2 for the Berkovich tip and h p = h c – h evc. h cis the total creep displacement. The effective strain rate is expressed asReference Huang, Wei and Lee11, Reference Goodall and Clyne15
 $$\dot \varepsilon _{\rm{p}} = {\rm{ }}\left({{\rm{1}}/h_{\rm{p}} } \right)\left({dh_{\rm{p}} /dt} \right).$$
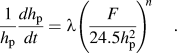
The power-law creep equation can be written asReference Huang, Wei and Lee11
 $${1 \over {h_{\rm{p}} }}{{dh_{\rm{p}} } \over {dt}} = \lambda \left({{F \over {24.5h_{\rm{p}} ^2 }}} \right)^{n} .$$
Using the displacement data at different times with Eqs. (6) and (7), we obtain data points shown in Figs. 3(a) and 3(b) by symbols corresponding to PC and sPS, respectively. For a given stress and polymeric material, the strain rate increases with decreasing preload period. For a given polymeric material and preload period, the experimental data is plotted as a straight line using least squares curve fitting. The span of log10σ for the straight line ( ${\rm{log}}_{{\rm{10}}} \dot \varepsilon _{\rm{p}}$ versus log10σ p) is wider for a shorter preload period. The slope of
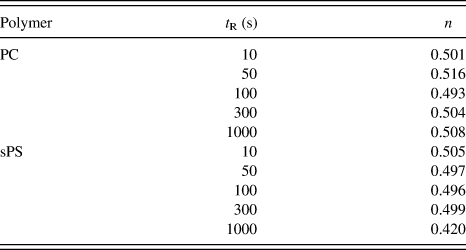
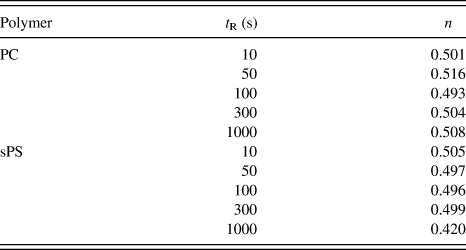
 ${\rm{log}}_{{\rm{10}}} \dot \varepsilon_{\rm{p}}}$ versus log10σ p lines for PC and sPS at different preload periods obtained from Fig. 3 is listed in Table III. The exponent factor is almost independent of preload period and polymeric material with the exception of sPS and t R = 1000 s. The exponent factors for PC and sPS are slight higher than those reported for PMMA, HEMA copolymer, and fast-cure acrylic resin.Reference Huang, Wei and Lee11 Further, the exponent factors of PC and sPS are also less than those of inorganic materials by one order of magnitudeReference Goodall and Clyne15 since polymeric materials are notably softer.
Plot of log10 (strain rate) versus log10 (stress) for steady-state creep with various preload periods, t R (or loading rate,  $\dot P$): (a) PC and (b) sPS.

Exponent factor, n, in the power-law creep equation of steady-state creep for PC and sPS with different preload periods, t R.
IV. SUMMARY AND CONCLUSIONS
This study investigated nanoindentation creep in PC and sPS. Nanoindentation creep consists of viscoelastic and power-law creep deformation. The viscoelastic deformation is explained by the viscoelastic Burgers model, which is comprised of a Maxwell element and a Kelvin element connected in series. The Newtonian shear viscoelasticity of the Maxwell element is greater for the creep period than for preload period, but the Newtonian shear viscosity of the Kelvin element exhibits an opposite trend. The Newtonian shear viscosity is smaller for the Kelvin element than for the Maxwell element, and this implies that the Kelvin element is the major contributor to transient creep. The Young’s modulus of Maxwell element is less for the creep period than for the preload period. Again, the Kelvin element exhibits an opposite trend. The change in Young’s modulus of polymeric materials from the preload period to the creep period is possibly due to stress-induced mesomorphic structure or crystallization. The steady-state strain rate increases with decreasing preload period. The stress exponent factor is independent of the preload period and type of polymeric material.
ACKNOWLEDGMENT
This work was financially supported by the National Science Council, Taiwan.