Implications
To understand better water demand for pasture-based beef and sheep production systems, a water footprint (WF) of individual farms is required. The main objective of this study was to determine the primary contributors to freshwater consumption through a volumetric WF and calculation of associated impacts for the production of 1 kg of beef and sheep meat on a selection of Irish, pasture-based beef and sheep farms for 2 consecutive years, 2014 and 2015.
The average WF of the beef farms was 8391 l/kg carcass weight (CW) of which 98% was green water and 2%, blue water. The average WF of the sheep farms was 7672 l/kg CW of which 99% was green water and 1%, blue water.
This study presented the first WF assessment of beef and sheep farms in Ireland using farm specific data which is an important addition to WF literature. The data presented in this paper can be used to assess the demands of freshwater as a result of beef and sheep production on pasture-based systems.
Introduction
The beef and sheep industries are significant components of the Irish agri‐food sector. Beef exports accounted for 22% or a value of €2.27 billion in exports in 2015, while the sheep meat industry accounted for €218 million. The majority of beef (>90%) and sheep (72%) produced in Ireland is exported to the United Kingdom and continental Europe (BordBia, 2015a). Ireland is the largest net exporter of beef in the European Union (EU) (fifth largest in the world) and the largest net exporter of sheep meat in the northern hemisphere (BordBia, 2015a).
Some 90% of beef produced in Ireland is produced under Origin Green, a sustainability programme that operates on a national scale, which includes farm to fork traceability and documentation of medicine use, etc. (BordBia, 2015b). This scheme has recently been updated to integrate sheep farming through the Sustainable Beef & Lamb Assurance Scheme launched in 2016 (BordBia, 2015b). This program’s carbon footprinting method is independently accredited at farm level by the Carbon Trust (PAS, 2008). The carbon footprint of Irish beef (Casey and Holden, Reference Casey and Holden2006a) and sheep (O’Brien et al., Reference O’Brien, Bohan, McHugh and Shalloo2016) production has been quantified, however a detailed WF of these systems using farm specific data is missing which is becoming important for environmentally conscious consumers (Grunert et al., Reference Grunert, Hieke and Wills2014).
Water footprints have been used to describe and assess water use in agricultural production systems such as dairy and meat production (Mekonnen and Hoekstra, Reference Mekonnen and Hoekstra2012). A volumetric WF includes the sum of consumption of soil moisture due to evapotranspiration of precipitation (green water), and consumption of ground and surface waters (blue water). While green and blue water represent consumed water, grey water represents an emission. It has been argued, therefore, that grey water can be better represented in a life cycle assessment (LCA) impact factor (Pfister et al., Reference Pfister, Koehler and Hellweg2009) such as eutrophication and so was excluded from this analysis. The division into green and blue water sources describes two different pathways of water use in agricultural systems. Partitioning between green and blue water is useful as it can also highlight differences in production systems for a similar output (Rockström et al., Reference Rockström, Karlberg, Wani, Barron, Hatibu, Oweis, Bruggeman, Farahani and Qiang2010).
The volumetric WFs and impacts of water use for beef and sheep production systems in the United Kingdom, Australia and New Zealand have been addressed in the literature (Chatterton et al., Reference Chatterton, Hess and Williams2010; Ridoutt et al., Reference Ridoutt, Sanguansri, Freer and Harper2012a; Zonderland-Thomassen et al., Reference Zonderland-Thomassen, Lieffering and Ledgard2014; Wiedemann et al., Reference Wiedemann, Yan and Murphy2016a and Reference Wiedemann, McGahan, Murphy and Yan2016b), however no current literature exists addressing the water demands of Irish, pasture-based beef and sheep production systems using farm-specific data. It is important for the marketability of Irish beef and sheep meat to have access to information on the freshwater demand of these production systems. This will enable policy makers to make meaningful comparisons, understand the potential for reducing the WF of beef and sheep production systems and potentially achieve a comparative advantage over similar livestock products from other countries. Therefore, a need was identified to assess freshwater use and potential environmental impacts related to water use associated with both beef and sheep production systems in Ireland.
The main objective of this study, therefore, was to determine the primary contributors to freshwater consumption up to the farm gate expressed as a volumetric WF and associated impacts for the production of 1 kg of beef and sheep meat on a selection of Irish, pasture-based farms for 2 consecutive years, 2014 and 2015.
Ridoutt et al. (Reference Ridoutt, Sanguansri, Nolan and Marks2012b) stressed that while a volumetric WF is useful in highlighting the intrinsic role of freshwater resources in livestock production, it is not correlated with the environmental impact of freshwater use. Changes in water availability due to consumption of freshwater resources should also be included. In line with the recent ISO WF standards (ISO, 2014), the WF should indicate potential environmental impacts related to water use. Water scarcity as a mid-point impact indicator of freshwater use can be quantified using the method developed by Pfister et al. (Reference Pfister, Koehler and Hellweg2009). To account for the impacts of water use, we have also included in our analysis, an LCA mid-point indicator, that is, the stress-weighted WF, to account for the environmental impact of blue water use (Pfister et al. Reference Pfister, Koehler and Hellweg2009).
Food Harvest 2020 and the subsequent Food Wise 2025 are national plans for intensification of agriculture which have identified opportunities to increase the economic output of the beef and sheep sectors through sustainable intensification (DAFM, 2010 and 2015). These agricultural intensification measures are expected to lead to an increase of €1.6 billion in output (DAFM, 2010). As a result of these policies the sustainability of forecasted intensification of beef and sheep farms was assessed from a water consumption perspective.
Material and methods
System boundaries
A total of 10 commercial beef farms and six commercial lowland, seasonal grazing sheep farms were selected from the Teagasc advisory database, referred to as study farms. Data were collected from these farms for 2 years (2014 and 2015). The beef farms carried an average of 117 livestock units (LUs) while the sheep farms carried 86 LU. Selection criteria included availability of herd and production data and willingness of the farmer to collect and maintain data accurately. The system boundary was cradle-to-farm gate. Freshwater use required for the cultivation of crops for concentrate feed, on-farm cultivation of grass or fodder and water requirements for animal husbandry and farm maintenance and was expressed per kg CW output. Water use related to energy and fertilizer production was not included in this study.
Data collection and management
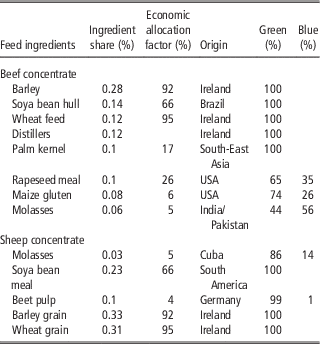
Data on farm infrastructure and animal production were gathered by means of a survey. This included information relating to on-farm water sources (private well/local government supply), stock numbers, concentrate sources and production data. Water meters were also installed on each farm to record water volumes (m3) throughout the farm network. Domestic water consumption was measured separately and subtracted from the total water supply to determine water supply to the farm enterprise only. Water volumes were measured monthly via an online survey with the farmers recording each water meter reading and inputting the data to the online system. Data on farm imports such as concentrate fed and forages fed were also collected monthly. Animal sales and CW data were gathered from each farmer. Concentrate feed composition and ingredient origin was gathered from local feed mills and previous literature (Casey and Holden, Reference Casey and Holden2006b; O’Brien et al., Reference O’Brien, Bohan, McHugh and Shalloo2016). These ingredients are listed in Table 1.
Relative share of concentrate ingredients by dry matter (including country of origin), economic allocation and percentage share of green and blue water requirements for each crop in the concentrate feed mix for beef and sheep study farms

All data were exported to spreadsheets and subsequently used to compute the WF of individual farms. The average, maximum and minimum of the production parameters and WF for each year was computed.
Allocation method
Allocation method refers to the portioning of environmental impacts within a multifunctional process. Five sheep farmers also kept some beef animals, therefore in order to separate the ‘on-farm’ water use between the sheep and beef enterprises, physical allocation was used between the sheep (55%) and beef outputs (45%), which was based on the ratio of sheep : beef LUs on the farms during the period of the study. The LU system is a reference unit which facilitates the grouping of livestock from various species and age through the use of specific coefficients established from the nutritional requirements of each type of animal. One LU is equivalent to one adult dairy cow. To account for the co-production of sheep meat (97%) and wool (3%), economic allocation was used. Previous studies have used economic allocation to separate products of crop systems for concentrate production (O’Brien et al., Reference O’Brien, Bohan, McHugh and Shalloo2016; Murphy et al., Reference Murphy, de Boer, van Middelaar, Holden, Shalloo, Curran and Upton2017), thus this method was used to allocate the environmental impacts of concentrate co-products.
Water required for crop cultivation
Green and blue water consumption required during crop growth was calculated using the method described by Murphy et al. (Reference Murphy, de Boer, van Middelaar, Holden, Shalloo, Curran and Upton2017). Freshwater required to grow a crop can originate from precipitation and soil water (green water) or, in the case where water demand exceeds precipitation, from irrigation (blue water). All irrigation water was assumed to be consumptive, implying that losses in the irrigation system did not return to the same catchment, representing a worst-case scenario. ‘Consumed’ water refers to loss of water when it is evaporated, incorporated into a product or returned to another catchment.
To assess the freshwater requirements for growth for each crop input (concentrates, forages and grass), the evapotranspiration (ET) was computed based on climate data, soil type and actual yield data. First, AQUASTAT, developed by the FAO was used to compute the reference ET (ETo) for each crop location. Second, the potential ET (ETp) over a crops growing period, assuming maximum soil water availability was derived using the crop co-efficient (Kc [t]) and the reference ETo on AQUASTAT using the Penman–Montieth equation (Allen et al., Reference Allen, Pereira, Raes and Smith1998). Third, results from AQUASTAT were then used to derive the rainfed ET of the crop (ETrf). ETrf is an estimate for the volume of water evapotranspired (green water) of a crop over the growth period. Fourth, actual crop yields taken from the FAO (2014) were then used to quantify the consumption of rainwater (green) and irrigation (blue) water in litres per kg of dry matter (DM). The ET from the actual yield of a crop (Eta, mm/ha) was then derived from the relationship between water supply and crop yield described by Doorenbos and Kassam (Reference Doorenbos and Kassam1979). Irrigation was assumed to be absent where ETa⩽ETrf. When ETa⩾ETrf, irrigation volumes were calculated by:
 $${\rm Irrigation}\,{\rm volume\,{\equals}}\,\left( {{\rm ET}_{{\rm a}} {\rm -ET}_{{{\rm rf}}} } \right){\rm \,/\,Ir}_{{{\rm eff}}} $$
Ireff is the irrigation efficiency. A default efficiency of 0.7 was assumed for all crops (Allen et al., Reference Allen, Pereira, Raes and Smith1998).
Grass and silage utilization
The DM intake of grass was estimated according to the net energy (NE) required for animal growth and maintenance (Jarrige, Reference Jarrige1989). Animal weight, growth rates, activity, pregnancy and feed digestibility were based on the surveys collected from the farmers and O’Mara (Reference O’Mara1996). The quantity of grass and silage fed to the animals (kg DM) was then calculated by the difference between the NE provided by external supplements (concentrates and imported forages) and the NE demands for animal growth and maintenance. The WF of the grass grown included a utilization rate of 85% on beef and sheep pasture systems (O’Donovan et al., Reference O’Donovan, Lewis and O’Kiely2011a; Creighton and Kelly, Reference Creighton and Kelly2014) and a residual rate of 15%.
Water stress index
The water stress index (WSI) is a mid-point indicator used to assess the relative impact of freshwater consumption. The impact of freshwater deprivation to the global freshwater system applies to blue water only (Pfister et al., Reference Pfister, Koehler and Hellweg2009). This method can be applied at the country, region and water shed level. To calculate the stress-weighted WF, all total volumes of blue water in each region of consumption were multiplied by the specific regional WSI and summed across the supply chain of the livestock system. To assess the global impact of freshwater use, the stress-weighted WF was normalized by dividing it by the global average WSI, resulting in a quantitative comparison of the pressure exerted from freshwater use through the consumption of a product, relative to the impact of consuming 1 kg of water across the globe (Ridoutt and Pfister, Reference Ridoutt and Pfister2010). The severity of water scarcity of a water shed is ranked as follows: WSI<0.1 low; 0.1⩽WSI<0.5 moderate; 0.5⩽WSI<0.9 severe and WSI>0.9 extreme (Pfister et al., Reference Pfister, Koehler and Hellweg2009). The unit of water stress, L H2O equivalent (H2O-eq), implies that each kg produced contributed to freshwater scarcity, equivalent to the consumption of freshwater by an average world citizen.
Water use through intensification
The Food Harvest 2020 policy targets a 40% and 20% increase in the value of the beef and sheep sector, respectively, by the year 2020 from the reference years 2007 to 2009 (DAFM, 2010). By 2015, through intensification initiatives, Irish beef exports amounted to 524 000 tonnes worth €2.27 billion, representing a 39% increase in value (DAFM, 2015). The sheep sector increased by 19% to €204 million compared with 2010 Food Harvest baseline figures (BordBia, 2015a). The Food Wise 2025 report believes that further growth is achievable by 2025 through an 85% increase in the value of agri-food exports €19 billion (DAFM, 2015); but to date, no specific targets for growth have been outlined for production sectors. In order to maintain sustainable growth in livestock production, an evaluation of the changes in freshwater demands due to intensification is necessary.
To carry out this evaluation, production parameters on specialized beef and sheep farms were taken from baseline production data representative of the time period 2007 to 2009. These data were used to calculate the change in demand for freshwater up to 2015. As grass made up the largest proportion of DM intake on beef (89%) and sheep (91%) farms in this study and the largest portion of total water demand (88%, beef; 87%, sheep), only changes in the water demand for grass growth as a result of intensification were assessed. Data on national herd size on specialized beef and sheep farms were gathered from the agricultural census (CSO, 2012) for 2010 and from the Central Statistics Office for 2015 (CSO, 2015). Average national grass yields were derived from the National Farm Survey in 2010 (Hennessy et al., Reference Hennessy, Kinsella, Quinlan and Moran2010) and from PastureBase for dry stock (beef and sheep) farms in 2015 (Griffith et al., Reference Griffith, O’Donovan, Geoghegan, Shalloo, Hopkins, Collins, Fraser, King, Lloyd and Moorby2014). Long-term average rainfall for the last 30 years was used to avoid yearly variation and represent the ‘normal’ climate of Ireland (Walsh, Reference Walsh2012). Water required for the growth of grass was calculated as described in the previous sections.
Results
General farm characteristics
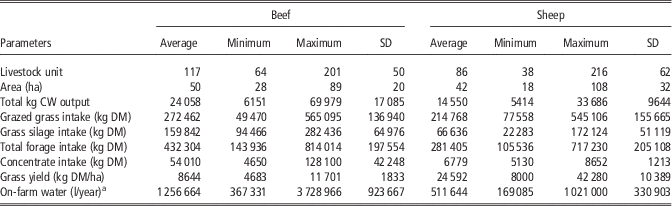
Table 2 (Supplementary Material Tables S1 and S2) summarizes the range of inputs and average production details of the study farms over 2 years (2014 and 2015). The average beef study farm size was 50 ha and produced 24 058 kg CW output. The average grass yield on the beef farms was 8644 kg DM/ha. The average sheep farm size was 42 ha and produced 14 550 kg CW. The average grass yield on the sheep farms was 6779 kg DM/ha. The study farms had greater production parameters than national average production figures; national average CW output per farm was 10 493 kg on beef farms and 9450 kg CW on sheep farms (CSO, 2012). The production figures for study farms were also larger than typical ‘intensive’ beef and sheep production systems analysed in the literature in the recent past (Casey and Holden, Reference Casey and Holden2006a; O’Brien et al., Reference O’Brien, Bohan, McHugh and Shalloo2016). The study farms therefore, represent larger than average beef and sheep farms. This is representative of the improvements in productivity on farms that are expected as a result of the Food Harvest and Food Wise intensification policies (DAFM, 2010 and 2015).
Production parameters for 10 beef and six sheep study farms for 2 years, 2014 and 2015.
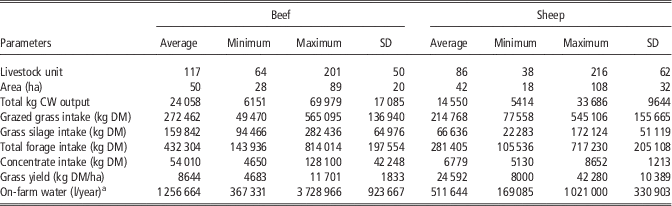
a Metered farm supply.
Green and blue water use
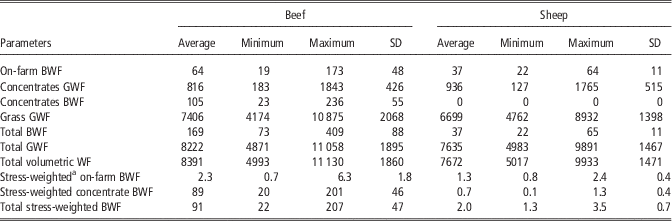
Table 3 (Supplementary Material Tables S3 and S4) summarizes the total green water footprint (GWF), total blue water footprint (BWF) and stress-weighted WF for the on-farm and concentrate BWF for the study farms. Concentrate GWF and BWF and grass GWF are also presented. The sum of the total GWF and total BWF gives the total volumetric WF for each farm which is also indicated.
Calculated blue water footprint (BWF), green water footprint (GWF) and stress-weighted water footprint (WF) of 10 beef and six sheep study farms in litres of water/kg CW output for 2 years, 2014 and 2015

a Stress-weighted=stress-weighted WF, weighted using the water stress index.
Total volumetric water footprint
The average total volumetric WF of the beef study farms was 8391 l/kg CW (range 4993 to 11 130 l/kg CW). The total GWF of the beef systems made up 98% of the total WF with the total BWF making up the remaining 2%.
The average total volumetric WF of the six sheep study farms was 7672 l/kg CW, (range 5017 to 9933 l/kg CW). The GW input into the sheep systems made up 99% of the WF with BW making up the remaining 1%.
On-farm blue water footprint
On-farm BWF refers to the volume of water used for farm maintenance and water consumed by livestock. In all cases this water was sourced from a private well and therefore, included blue water only. The average beef on-farm BWF was 64 l/kg CW (range 19 to 173 l/kg CW). The on-farm BWF made up 38% of the total beef BWF with the remaining BWF consumed for concentrate production.
The average sheep on-farm BWF was 37 l/kg CW (range 22 to 65 l/kg CW). The sheep on-farm BWF made up 99% of the total BWF with the remaining 1% attributed to concentrate production.
Concentrate water footprint
The average volumetric beef WF for concentrate production (sum of green and blue concentrate WF) was 921 l/kg CW (range 206 to 2079 l/kg CW). Green water made up 89% of the water demand in concentrate production. Less than 1% of the total beef WF was for BW use in beef concentrate production, associated with the irrigation of crops such as sugarcane, originating in Cuba for the production of molasses, and beet pulp from Germany.
The average volumetric WF for sheep concentrate production was 936 l/kg CW, (range 127 to 1765 l/kg CW). Almost all of the total water consumed for concentrate production on sheep study farms was attributed to green water use, while only 1% was attributed to blue water.
Grass water footprint
The grass WF refers to the water required for grazed grass and on-farm produced silage. All grass growth was rainfed implying green water use only. The average beef grass GWF was 7406 l/kg CW (range 4174 to 10 875 l/kg CW). The grass GWF accounted for 88% (range 84% to 98%) of the total volumetric WF per kg CW beef.
The average sheep grass GWF was 6699 l/kg CW (range 4762 to 8932 l/kg CW). The grass GWF accounted for 87% (range 73% to 95%) of the total volumetric WF per kg CW sheep.
Stress-weighted water footprint
The average beef stress-weighted WF was 91 l H2O-eq/kg CW (range 22 to 207 l H2O-eq/kg CW), implying that each kg of beef produced contributes to freshwater scarcity, equivalent to the consumption of 91 l of freshwater by an average world citizen. The beef on-farm BWF equates to 2% of the beef stress-weighted WF with the remainder attributed to concentrate water use; 91% of the stress-weighted impact for beef concentrate production was due to the irrigation of rapeseed meal produced in the United States which had a large blue water irrigation demand (Table 1).
The average sheep stress-weighted WF was 2 l H2O-eq/kg CW (range 1.3 to 3.5 l H2O-eq/kg CW), implying that each kg of sheep meat produced contributes to freshwater scarcity, equivalent to the consumption of 2 l of freshwater by an average world citizen. The sheep on-farm BWF equates to 67% of the sheep stress-weighted WF.
Water use through intensification
Table 4 presents the national herd sizes, average farm area for specialized beef and sheep farms in Ireland along with the water consumed for grass growth and the volume of water available through precipitation. The baseline value for the beef and sheep sector (2007 to 2009) referenced in Food Harvest 2020 (DAFM, 2010), and the 2015 sector value is also indicated. The water required for grass growth was 30% and 27% of available freshwater production in 2010 and increased to 36% and 38% in 2015 on specialized beef and sheep farms, respectively.
Production parameters for beef farms in 2010 and 2015 for Food Harvest 2020 targets for specialized beef and sheep farms and volume of water consumed for grass growth

a 30-year long-term average.
b Baseline value of beef industry from 2007 to 2009 (DAFM, 2010).
Discussion
International water footprint comparison
In this study the total volumetric WF for the beef study farms was 8391 and 7672 l/kg CW for the sheep study farms. The largest contributor to the WF for both systems was GW for grass growth, 87% and 91% on the beef and sheep farms, respectively, reflecting the importance of rainfed grass as a source of feed on livestock production systems. High utilization of grass as a source of feed is one of the driving forces behind the competitiveness of rainfed grass-based production systems which require low inputs of concentrates or other forages. The WF of concentrates for the beef and sheep meat production systems in this study was 921 l and 936 l/kg CW with concentrates making up 11% of total DM intake on beef farms and 8% of DM intake on sheep farms in this study. Furthermore, only a small proportion of the components required for the production of concentrate for the beef and sheep study farms required irrigation.
The WF results available in the literature for the production of beef and sheep production vary considerably due to the use of different calculation methods, system boundaries, functional units (CW and live weight (LW)) and assumptions pertaining to feed consumption and composition. As >90% of Irish beef and 72% of sheep meat is exported to international markets, it is important to compare the WF of Irish livestock systems to cognate studies from other regions. A study by Mekonnen and Hoekstra (Reference Mekonnen and Hoekstra2012) comparing the WF of animals and animal products reported an volumetric WF of Irish beef as 5684 l/kg CW (96% GW) and a volumetric WF of Irish sheep meat as 3199 l/kg CW (90% GW). The results presented by the WFN (Mekonnen and Hoekstra, Reference Mekonnen and Hoekstra2012) used data on livestock numbers, feed requirements and system management information from international data sets, rather than data specific to farm scale production systems. Use of national scale data can lead to an over or underestimation of the demands for freshwater at farm level.
A study of the volumetric WF of beef and lamb meat in the United Kingdom (Chatterton et al., Reference Chatterton, Hess and Williams2010) quantified a UK national volumetric WF of beef as 14 967 l/kg CW (99% GW) and a volumetric WF of lowland lamb of 21 831 l/kg CW (99% GW).The WF results of the UK study (Chatterton et al., Reference Chatterton, Hess and Williams2010), calculated using a LCA model, considered the feed requirements based on daily LW gain, utilizing farm-specific data for pasture production, feed composition and consumption. While the production systems studied by Chatterton et al. (Reference Chatterton, Hess and Williams2010) would not be dissimilar to Irish systems, the WF results reported in this study were much lower. The results presented in this study can be considered a more realistic evaluation of the WF for beef and sheep produced in Ireland as fewer assumptions were required due to the nature of data collected from the study farms. This was especially the case for green water required for grazed grass and forage production as well as the metering of on-farm blue water use.
There are a number of international studies which consider blue water use only in their estimation of a WF of livestock production systems. The total volumetric BWF of pasture-based beef farms in this study was 169 l/kg CW which ranged from 19 to 173 l/kg CW. The WF of beef cattle in Australia was computed for six theoretical, geographically defined production systems. The results varied from 25 to 234 l/kg LW, where water use referred to the consumption of freshwater from ground and surface water resources only (Ridoutt et al., Reference Ridoutt, Sanguansri, Freer and Harper2012a). A study by Wiedemann et al. (Reference Wiedemann, Yan and Murphy2016a) calculated the total consumptive blue water use of Australian grass-finished beef production systems in eastern Australia as ranging from 118 to 332 l/kg LW.
The total volumetric BWF of sheep in this study was 37 l/kg CW, which ranged from 22 to 64 l/kg CW. Wiedemann et al. (Reference Wiedemann, McGahan, Murphy and Yan2016b) calculated the total consumptive blue water use of Australian lamb from the major production regions of New South Wales, Victoria and South Australia, reporting a BWF range of 58 to 239 l/kg LW (average LW per lamb was 51 kg). Ridoutt et al. (Reference Ridoutt, Sanguansri, Nolan and Marks2012b) reported a volumetric blue WF of Australian lamb, produced in Victoria, of 1831 l per head of lamb (average LW per lamb=53 kg) with 92% of BW occurring on-farm for livestock drinking water.
The lower WF results presented in the present study were mainly influenced by differences in methodology, climate and differences in farm management. In Australian livestock systems it is often necessary to create dams and water reservoirs for animal drinking supply which can have large evaporative losses. These losses accounted for 40% of the total BW consumption in the study by Ridoutt et al. (Reference Ridoutt, Sanguansri, Freer and Harper2012a). Furthermore, there was a large irrigation component to the BWF of the Australian production systems which is not encountered on pasture-based systems in Ireland.
Impact of water consumption
The greatest contribution (98%) to water stress from Irish beef production systems was through the use of irrigated crops for beef concentrate production. The use of rapeseed meal grown and irrigated in the United States which has a moderate degree of water stress (0.499), accounted for 87% of the share of water stress in the production of concentrates with maize gluten from the United States and molasses from Pakistan (stress index of 0.967) accounting for the remaining impact. The beef on-farm BWF in this study was 2.3 l H2O-eq/kg CW. The average volume of water required on-farm for animal drinking water and cleaning was 1 256 664 l/year; coupled with a low WSI for Ireland of 0.022 (Pfister et al., Reference Pfister, Koehler and Hellweg2009) beef production in Ireland had a low blue water use impact associated with on-farm water use.
The stress-weighted WF result for the beef farms in this study was in the range of previous estimates and averaged 91 l H2O-eq/kg CW. The stress-weighted WF for Australian beef produced in six distinct geographically defined production systems varied from 3.3 to 221 l H2O-eq/kg LW (Ridoutt et al., Reference Ridoutt, Sanguansri, Freer and Harper2012a). The main influence on water stress in the Australian production systems was irrigation of pasture and evaporation from dams used to hold drinking water, depending on the geographic location of the beef system. Another Australian study by Wiedemann et al. (Reference Wiedemann, Yan and Murphy2016a) reported a stress-weighted WF of beef, produced in eastern Australia, ranging from 8.4 to 104.2 l H2O-eq/kg LW. The stress-weighted water use was influenced by regional water stress in Australia which averaged at 0.22 (range 0.02 to 0.85) for irrigation, drinking water and evaporation losses from farm dams. A study in New Zealand of several beef farm classes had a stress-weighted WF of 0.37 l H2O-eq/kg LW (Zonderland-Thomassen et al., Reference Zonderland-Thomassen, Lieffering and Ledgard2014). The main uses of blue water and related blue water use impact were associated with pasture irrigation and the rearing of bull calves from dairy systems which have large WF associated with the feeding of milk powder to these animals as calves. The higher result for the Australian beef systems is mainly attributed to a higher degree of water scarcity in Australia (0.402) than in New Zealand (0.021) (Pfister et al., Reference Pfister, Koehler and Hellweg2009).
The stress-weighted WF result for sheep was 2 l H2O-eq/kg CW. The main contributor to water stress as a result of the production of sheep was on-farm blue water use (65%) for animal drinking and farm maintenance. The average volume of water used over the six sheep farms was 511 644 l/year. Combined with a low WSI for Ireland of 0.022 the overall impact on freshwater resources as a result of sheep meat production was low. For the production of sheep concentrates, 99% of the related water stress was due to the irrigation of sugar cane for the production of molasses from Cuba which has a national WSI of 0.228 (Pfister et al., Reference Pfister, Koehler and Hellweg2009). Our stress-weighted WF results for sheep were comparable with similar studies carried out in Australia and New Zealand systems investigating the water use-related stress from the production of sheep meat. Zonderland-Thomassen et al. (Reference Zonderland-Thomassen, Lieffering and Ledgard2014) assessed sheep production on several different systems, resulting in an average stress-weighted WF of 0.10 l H2O-eq/kg l, of which blue water evapotranspiration on irrigated pasture contributed the most (85% blue water), despite the small areas of land being irrigated (1% of total land area). A study by Wiedemann et al. (Reference Wiedemann, McGahan, Murphy and Yan2016b) of Australian lamb meat indicated a stress-weighted WF range of 2.9 to 137.8 l H2O-eq/kg. The results were influenced by regional WSIs, 0.37 (range 0.01 to 0.82) in lamb production regions.
The specific location of production is a critically important factor when comparing the water use and water stress impact of different production systems internationally, due to regional variation across countries and regions (Pfister et al., Reference Pfister, Koehler and Hellweg2009). The importance of assessing a WF in a specific region is evident from the range of results which have been discussed in the previous sections. Ridoutt et al. (Reference Ridoutt, Sanguansri, Nolan and Marks2012b) warned against generalizations made about the relationship between meat production, water use and issues with water scarcity, as not all species specific livestock production systems are alike. The differences in production systems along with differences in water footprinting methods render informative and useful comparisons of water resource use difficult.
Ridoutt et al. (Reference Ridoutt, Sanguansri, Nolan and Marks2012b) commented on how some livestock production systems (low input, non-irrigated grazing systems) might be considered a sustainable use of the world’s water resources due to its modest impact. Improving grass yields and sourcing feed ingredients from non-water stressed areas will be an important aspect of sustainable livestock production and sustainable water use in the future, since improved efficiency of green water use implies a reduced need for blue water resources for irrigation (Rockström et al., Reference Rockström, Karlberg, Wani, Barron, Hatibu, Oweis, Bruggeman, Farahani and Qiang2010). The results of this study converge with findings of recent research underlining the need to add value to green water (rainfall) rather than blue water (irrigation water) to solve the issue of food security in the 21st century (Rockström et al., Reference Rockström, Karlberg, Wani, Barron, Hatibu, Oweis, Bruggeman, Farahani and Qiang2010). Given that the overwhelming majority of livestock products are exported from Ireland to meet the increasing global demand for animal source food, beef and sheep meat produced on pasture-based systems could be considered a sustainable use of water resources. Further to this, production system information should be communicated to consumers to allow a scientific basis for dietary choices (Grunert et al., Reference Grunert, Hieke and Wills2014).
Effect of intensification on water demand
The water required for grass growth was seen to increase by 6% and 11% to meet the increased beef and sheep productivity required to achieve Food Harvest targets. Murphy et al. (Reference Murphy, de Boer, van Middelaar, Holden, Shalloo, Curran and Upton2017) demonstrated how 38% of freshwater available on dairy farms was consumed for grass growth, which is similar to the green water use for grass growth in this analysis. One of the main drivers of intensification in Ireland is to meet increases in feed demand through increased growth and utilization of grass as a source of feed (O’Donovan and Hennessey, Reference O’Donovan and Hennessey2011b). Grass yields increased by 2.2 tDM/ha from 2010 to 2015 on specialized beef farms and by 2.5 tDM/ha on specialized sheep farms. This aligns with current literature which highlights the importance of increased grass intake on pasture-based systems in Ireland as there is scope to improve yields, reduce feeding costs and improve livestock productivity (O’Donovan and Hennessey, Reference O’Donovan and Hennessey2011b; O’Brien et al., Reference O’Brien, Bohan, McHugh and Shalloo2016).
While intensification of agricultural systems can lead to both an increase in productivity and environmental performances (Casey and Holden, Reference Casey and Holden2006a), our analysis has highlighted an increase in freshwater demand on livestock systems in Ireland. While there is scope to increase water utilization through improved grass yields, continued intensification has been seen to negatively impact water quality which in turn can also negatively affect the growth potential of land (Basset-Mens et al., Reference Basset-Mens, Ledgard and Boyes2009). On the other hand, increasing the share of green water use for animal feed could be seen as a valuable trade off in improving the productivity of pasture-based livestock systems and sustainable water use as the demand for blue water is lessened.
Conclusions
This study presented the first WF assessment of Irish beef and sheep production systems using farm specific data, which was lacking from the literature. This is an important first step in assessing the demands of freshwater as a result of livestock production in Ireland. This study found that green water for grass growth contributed 88% and 87% to the total volumetric WF of Irish beef and sheep farms, respectively. While the associated impact of blue water use in both production systems was low, a future challenge will be to source concentrate ingredients from areas of low water stress or cultivated predominantly from green water resources. This study also evaluated the sustainability of recent intensification initiatives in Ireland and found that the increases in productivity were aided through an increase in green water use to increase grass yields and utilization. Hence, converting the water used to grow grass (i.e. green water) into a human food source (i.e. livestock products) with low impact blue water inputs could be considered a sustainable use of water resources. The evaluation of water use for the production of livestock alone cannot infer complete environmental performance but is useful to the discussion of environmental sustainability of pasture-based livestock production systems.
Acknowledgements
The authors acknowledge assistance from Anne Geoghan and Kevin McNamara, Teagasc for assistance in data collection. This work was supported by the E-Ruminant Research Stimulus Fund, project number 11s143 and the Teagasc Walsh Fellowship Program.
Supplementary material
To view supplementary material for this article, please visit https://doi.org/10.1017/S1751731117002865