


1. Introduction
Since a 2018 US Supreme Court ruling permitted states to decide whether to allow sports gambling, it has spread rapidly. By the end of 2025, online sports gambling was legal in 31 states.Footnote 1 ESPN was actively promoting online sports gamblingFootnote 2 and sports gambling advertisements appeared frequently on television during sporting events, with advertisements growing 10-fold between 2018 and 2021 as the industry established itself (American Gaming Association 2025). “Prediction markets” have recently offered gambling-like products on sports and other events that have expanded access to sports betting even more.Footnote 3 Whether to legalize or roll back legalization is an area of active state policy discussion.Footnote 4
Yet because online sports betting has spread so quickly in the United States, relatively little is known about who is gambling, how much, and sports gambling’s association with financial wellbeing and decision-making. There is reason for concern: being able to gamble anytime and anywhere may make gambling more addictive to more people (Gainsbury Reference Gainsbury2015; Hing et al. Reference Hing, Russell and Browne2017; Naratil and Walker Reference Naratil and Walker2025). Grubbs and Kraus (Reference Grubbs and Kraus2023b) show that greater engagement with sports betting is the primary predictor of high-risk gambling behaviors. Higher engagement is facilitated by easier access to online betting. Outside the United States – where sports gambling was more common before 2018 – online sports gambling seems to be associated with worse outcomes than other forms of gambling (Winters and Derevensky Reference Winters and Derevensky2019; Tran et al. Reference Tran, Wardle, Colledge, Taylor, Lynch, Rehm, Volberg, Marionneau, Saxena, Bunn, Farrell and Degenhardt2024), although participation in online sports betting through “daily fantasy sports” in the United States did not appear to be more harmful than other kinds of gambling before 2018 (Dwyer et al. Reference Dwyer, Shapiro and Drayer2018). Recent studies in the United States have found negative but modest average financial effects from online sports gambling’s spread (Baker et al. Reference Baker, Balthrop, Johnson, Kotter and Pisciotta2024; Hollenbeck et al. Reference Hollenbeck, Larsen and Proserpio2025). Taylor et al. (Reference Taylor, McCarthy and Wilbur2025) point to an increase in potentially problematic gambling, and searches for gambling addiction help increased rapidly after 2018 and particularly rapidly in states that allowed online sports betting (Yeola et al. Reference Yeola, Allen, Desai, Poliak, Yang, Smith and Ayers2025). But there are also significant state revenue gains (Taylor et al. Reference Taylor, McCarthy and Wilbur2025), and others argue that sports gambling is just another form of entertainment that makes watching sports more fun and helps foster a community.Footnote 5
In this article, I use a nationally representative sample survey – the Making Ends Meet survey conducted by the Consumer Financial Protection Bureau starting in January 2025 – to fill in these gaps. The survey had a module of questions on gambling, with particular attention to online sports gambling. In addition, the survey more generally asked questions about financial wellbeing, difficulty paying bills, financial product use, and financial decision-making which I use to examine gambling’s association with financial outcomes.
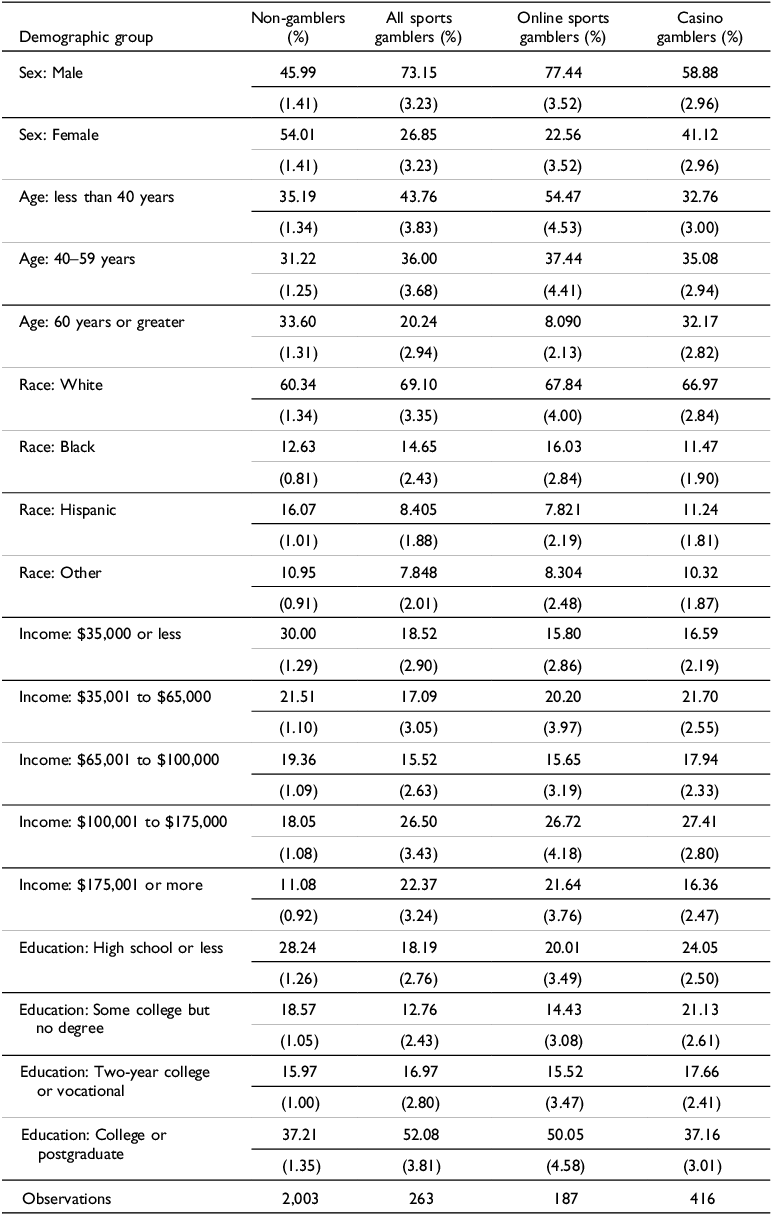
Gambling in a casino was still more common than online sports gambling in early 2025; 15.3 percent of adults gambled in a casino over the previous year, compared to 10.7 percent who placed any sports bet. Most sports gambling was mobile: 71 percent of sports gamblers report using a mobile phone. Meanwhile, 77 percent of sports gamblers were male, and they tended to be younger but had higher incomes than the overall population or casino gamblers. The populations of sports gamblers and casino gamblers were largely distinct, suggesting that online sports gambling is bringing new people to gambling.
Most sports bets were small, and most sports gamblers bet infrequently, but some sports gamblers showed potentially problematic behavior. While 84 percent of sports gamblers placed a bet no more frequently than monthly, 9.4 bet weekly, 4.7 bet a few times a week, and 2.3 percent placed a bet daily. Such frequent betting is facilitated by the mobile nature of betting and may be particularly concerning. And 60 percent of sports gamblers say their average bet was $20 or less and 68 percent reported their largest loss was $50 or less. At the same time, one-third of sports gamblers either placed a bet at least weekly, placed a typical bet that was more than $50, or lost $100 or more in a single day. Such high-intensity gambling might suggest a gambling problem.
Sports betting is not statistically associated with negative financial outcomes on average. Disentangling the relationship between sports gambling and financial outcomes is difficult because most sports gamblers are making small and infrequent bets and sports gamblers have higher incomes than average which is associated with positive financial outcomes. In regressions controlling for income and other demographic attributes, being a sports gambler is not statistically associated with lower financial wellbeing, a higher likelihood of difficulty paying bills, or a higher likelihood of using high-cost credit such as payday loans. Sports gamblers are more likely to revolve credit card debt. Focusing on the small sample of high-intensity gamblers, which may indicate problematic behavior, does not produce significant effects for financial wellbeing or having difficulty. However, while the confidence intervals include zero effects, the confidence intervals also include modest negative financial outcomes, so it is possible that a larger study might find statistical differences.
Yet gambling is sometimes a cause of financial distress. Overall, 40.3 percent of people had difficulty paying a bill or an expense. Among everyone who had difficulty, 63 percent said there was an event or expense that caused the difficulty, and of those 2.4 percent selected “gambling losses” as a cause. It is possible others had difficulty and gambling contributed but was not the primary cause.
Sports gamblers rated their ability to make complex financial decisions higher than non-gamblers, yet they were more impatient and more likely to be overconfident. These differences suggest that online sports gambling may be particularly prevalent among people who mistakenly believe in their own ability to beat the odds. Other research shows that sports bettors are more likely to use cryptocurrencies (Grubbs and Krauss Reference Grubbs and Kraus2023a) and are more likely to engage in other impulsive or addictive behaviors (Grubbs and Krauss Reference Grubbs and Kraus2023c). Sports gambling may thus be part of a wider complex of overconfidence, self-control, and risky behaviors that have financial and health consequences.
Research on sports betting expanded rapidly after 2018 as online sports betting increased. Grubbs and Krauss (Reference Grubbs and Kraus2022, Reference Grubbs and Kraus2023a, Reference Grubbs and Kraus2023b, Reference Grubbs and Kraus2023c) use a non-probability-based internet survey weighted to match the 2019 American Community Survey. The problem with online sports betting in particular seems to be that it facilitates more engagement, leading to more high-risk gambling behavior (Grubbs and Krauss 2023). Baker et al. (Reference Baker, Balthrop, Johnson, Kotter and Pisciotta2024) use individual financial transaction data to show that sports betting seems to replace saving approximately dollar for dollar rather than replacing other consumption. While I show that the typical sports gambler has higher income, some bettors do have lower incomes, and Baker et al. (Reference Baker, Balthrop, Johnson, Kotter and Pisciotta2024) show that when lower-income people do bet, they are doing so with a larger share of their income. Hollenbeck et al. (Reference Hollenbeck, Larsen and Proserpio2025) compare states that legalized sports gambling to others that had not yet done so and find that states that legalized sports gambling had more auto loan delinquencies and debt in collections which results in slightly lower average credit scores. The changes were largest in states that legalized online sports betting. Taken together, these studies are consistent with the evidence in this article that the expansion of online sports betting is having a zero to modestly negative average effect on financial health, driven by bad outcomes for a few people.
A small selection of polls and industry studies confirms the overall demographic attributes of sports gamblers. Grubbs and Krauss, (Reference Grubbs and Kraus2022) similarly find that being male, younger, and having a higher income were associated with higher odds of sports betting. An online poll by Siena College Research Institute (2025) found that sports bettors were disproportionately male. Industry reports suggest that nearly all sports betting is done online.Footnote 6 Of course, there is a much wider literature on gambling and sports gambling, particularly internationally where sports gambling was more common before 2018. Lopez-Gonzalez et al. (Reference Lopez-Gonzalez, Estévez and Griffiths2017), Winters and Derevensky (Reference Winters and Derevensky2019), and Tran et al. (Reference Tran, Wardle, Colledge, Taylor, Lynch, Rehm, Volberg, Marionneau, Saxena, Bunn, Farrell and Degenhardt2024) review the literature. Gainsbury et al. (Reference Gainsbury, Russell, Hing, Wood, Lubman and Blaszczynski2015) and Hing et al. (Reference Hing, Russell, Vitartas and Lamont2016) find a similar demographic distribution of sports gamblers in Australia. Gambling, particularly gambling more than 1 percent of income, was associated with negative financial outcomes in the United Kingdom (Muggleton et al. Reference Muggleton, Parpart, Newall, Leake, Gathergood and Stewart2021).
Relative to the literature, this article makes several contributions. First, because online sports betting has evolved rapidly, it is important to have recent evidence. Online sports gambling, because it is easier to access, may have different outcomes or demographics than other types of gambling. Second, because non-probability surveys or polls from online recruitment (Grubbs and Krauss Reference Grubbs and Kraus2022; Siena College Research Institute 2025) typically have low response rates and may result in systematically different people answering which cannot be adjusted for by weighting, it is also valuable to have evidence from random sample surveys such as the one used here. In addition, as discussed below, the Making Ends Meet survey samples from credit bureau data and so directly weights based on the financial status of both respondents and non-respondents. This weighting may be particularly important for understanding the financial consequences of sports gambling. Third, while several studies have found a negative effect from the spread of sports gambling (Baker et al. Reference Baker, Balthrop, Johnson, Kotter and Pisciotta2024; Hollenbeck et al. Reference Hollenbeck, Larsen and Proserpio2025), the outcomes studied are the ones in the available data rather than direct measures of financial distress. On the other hand, relative to these studies, this article is limited by the available sample size. Nevertheless, one reason this article finds no association between sports gambling and financial distress on average is that most bets were small and infrequent. Finally, this article points to additional psychological factors such as overconfidence that suggest that engaging in sports gambling may be part of a larger complex of attitudes, some of which may have negative financial consequences.
2. Data and methods
I use the recently released Making Ends Meet public use data (N = 2,630) which included several questions on sports and casino gambling.Footnote 7 The survey was conducted by the Consumer Financial Protection Bureau (CFPB) starting in January 2025. The survey protocol started with a letter asking participants to take the survey online with an incentive, a reminder letter in week 2, and a paper survey mailed to non-respondents in week 5. The survey’s sample was drawn from a large panel of credit records maintained by CFPB. The 2025 survey oversampled individuals living in majority African American or Hispanic areas, below median-income areas, with recent medical collections, with any listed medical collection, with 60-day delinquencies, with recent collections, and with very poor or poor credit scores. Because of the oversampling, the survey has more power for people facing financial difficulty. The survey is weighted to be nationally representative of adults aged 18 years and over. All results use survey weights to be nationally representative. The technical documentation provides greater detail on the mixed mode survey method, survey incentives, weighting, sampling, and response rates (CFPB 2025).
The survey asked, “Have you placed a bet on a sporting event or outcome in the last year?” and followed up with “Did you use a mobile phone to place a bet?” and several other follow-up questions about betting behavior described below. The survey asked about gambling over the last year, so should average out any seasonality from specific sports such as American football in the fall. In practice, respondents may recall the most recent bets or sports season more prominently, so the survey, which was conducted starting in January 2025, is likely to better represent online football gambling than, for example, college basketball. It also asked questions on financial wellbeing using the CFPB five-item scale (CFPB 2017; Heck et al. Reference Heck, Ratcliffe and Tibbitts2024), financial product use including on credit cards and payday loans, and financial preferences and behavior.
3. Results
3.1. Sports betting in early 2025
Gambling in a casino was still more common than online sports betting in early 2025; 15.3 percent of adults gambled in a casino over the previous year, compared to 10.7 who placed any sports bet and 7.6 who placed a sports bet using a mobile phone. Figure 1 shows the share of people who reported gambling in a casino, placing a sports bet, placing a sports bet on a mobile phone, and both gambling in a casino and online sports. Most sports betting was mobile: 71 percent of sports bettors report using a mobile phone. This ability to bet anywhere and at anytime is the potentially novel and concerning aspect of online sports betting because it makes it more accessible.
Share of people gambling in 2025 by method.
Notes: Share of US adults who reported gambling this way in the previous year. Options are not exclusive; for example, some people who gambled in a casino also placed a sports bet. 95% confidence intervals. Source: Author’s calculations from the 2025 Making Ends Meet survey, using survey weights to be nationally representative.

Online sports betting and casino gambling were mostly by distinct people. Only one-fifth of casino gamblers also placed a mobile sports bet, although close to half of mobile sports bettors also engaged in casino gambling. The relationship suggests that online sports betting is expanding the gambling population, rather than replacing casino gambling.
3.2. Sports gambling demographic attributes
Table 1 shows that online sports gamblers are overwhelming male and typically younger. The table shows the demographic distribution of non-gamblers, all sports gamblers, sports gamblers who placed a bet online, and casino gamblers. The first column excludes all gamblers, but the other columns are not exclusive; online sports gamblers are also sports gamblers, and some casino gamblers are also sports gamblers. I focus on online sports gamblers who make up most sports gamblers (see Figure 1). While the non-gambling population was evenly split between male and female, and casino gamblers were only slightly more male in the survey, 77 percent of online sports gamblers were male. Sports gamblers were also younger and somewhat more likely to be White or Black than non-gamblers, although the estimates are not always statistically distinct. These demographic results are similar to the results in polls conducted by Grubbs and Krauss (Reference Grubbs and Kraus2022) and Siena College Research Institute (2025).
Demographic distribution of non-gamblers, online sports gamblers, and casino gamblers

Table 1. Long description
A table comparing demographic distribution of non-gamblers, all sports gamblers, online sports gamblers, and casino gamblers. The table has 15 rows and 5 columns. The columns are labeled as Non-gamblers (%), All sports gamblers (%), Online sports gamblers (%), and Casino gamblers (%). The rows are labeled with demographic groups including sex, age, race, income, and education. Each cell contains a percentage value with a standard error in parentheses. The table shows the distribution of various demographic groups across different types of gamblers and non-gamblers. For example, the percentage of males and females, different age groups, races, income levels, and education levels are compared across the four categories. Notable trends include a higher percentage of males among online sports gamblers and a higher percentage of younger individuals in the same group. The table provides a detailed comparison of demographic characteristics across different gambling categories.
Notes: Each cell shows the proportion in the demographic group. The proportion within each group sums to 100 percent up to rounding errors. Standard errors are in parentheses. The first column excludes all gamblers, but the other columns are not exclusive; online sports gamblers are also sports gamblers, and some casino gamblers are also sports gamblers. Source: Author’s calculations from the 2025 Making Ends Meet survey, using survey weights to be nationally representative.
Online sports gamblers generally had higher incomes than non-gamblers. Consistent with their higher incomes, online sports gamblers have substantially higher education levels. Having higher income and education makes understanding the impact of sports gambling more difficult because higher income and education are generally associated with better financial outcomes and higher-income people may be engaging in sports betting as a form of social consumption. At the same time, while the sports betting is more common for high-income people, some low-income people also engage in sports betting.
3.3. Sports gambling frequency, bet size, and losses
Most sports gamblers bet infrequently and for small amounts. Figure 2 shows what proportion of people who placed a sports bet (including mobile and non-mobile sports gamblers) placed bets at different frequencies. Half of sports gamblers bet only a few times in the year up to January 2025 and 22 percent only once. At the same time, some people bet frequently. While 84 percent placed a bet no more frequently than monthly, 9.4 percent bet weekly, 4.7 percent bet a few times a week, and 2.3 percent placed a bet daily. Such frequent betting may be especially enabled by being able to bet on a mobile phone which is constantly available and the existence of prop bets which allow sports gamblers to take positions on outcomes within a game. This engagement is associated with potentially worse outcomes (Grubbs and Kraus 2023).
Among sports bettors, “How frequently did you take part in sports betting in the past year?”
Notes: 95% confidence intervals. Source: Author’s calculations from the 2025 Making Ends Meet survey, using survey weights to be nationally representative.

Most sports bets were small, and most losses were for $50 or less in a single day. Figure 3 shows how large sports gamblers reported their typical wager was. Sixty percent of wagers were for $20 or less. At the same time, 5.5 percent of wagers were typically for more than $250. Figure 4 shows the distribution of what sports gamblers said was their largest loss in a single day. While 68 percent reported their largest loss was $50 or less, 5 percent lost $500 or more in a single day, a share similar to the share with the largest wager size in Figure 3.
Among sports bettors, “In the past year, how much money did you wager for a typical bet?”
Notes: 95% confidence intervals. Source: Author’s calculations from the 2025 Making Ends Meet survey, using survey weights to be nationally representative.

Among sports bettors, “In the past year, what was your largest loss in a single day?”
Notes: 95% confidence intervals. Source: Author’s calculations from the 2025 Making Ends Meet survey, using survey weights to be nationally representative.

Together, Figures 3 and 4 suggest that while most wagers are small, some people place either enough small wagers or large enough wagers that they can lose substantial sums at once. Combining these measures into a single measure of high-intensity gambling: 33.8 percent (s.e. 3.6) of sports gamblers and 3.6 percent (s.e. 0.45) of the overall population either placed a bet at least weekly, placed a typical bet that was more than $50, or lost $100 or more in a single day. While high-intensity betting is not necessarily a sign of problematic gambling, it does suggest substantial engagement, either because bets are frequent or because the financial implications are large. In the next section, I explore whether high-intensity gambling has an association with financial outcomes.
3.4. Association with financial outcomes
In this section, I show a series of regressions examining the association between sports and casino gambling and financial outcomes. These regressions are not causal in the sense that they capture the effect of randomly assigning some people to have access to sports gambling. Instead, they capture whether, after controlling for other factors such as that sports gamblers have higher incomes, people who choose to gamble on sports have different average financial outcomes than other similar people who did not gamble. Table 1 shows that sports gamblers have higher income and education than non-gamblers. Higher income and education are correlated with higher financial wellbeing and lower difficulty paying bills (Fulford et al. Reference Fulford, Kalish, Wilson, Kruse, LeBuhn and Cotter2024) which can confound simple comparisons of sports gamblers to non-gamblers.
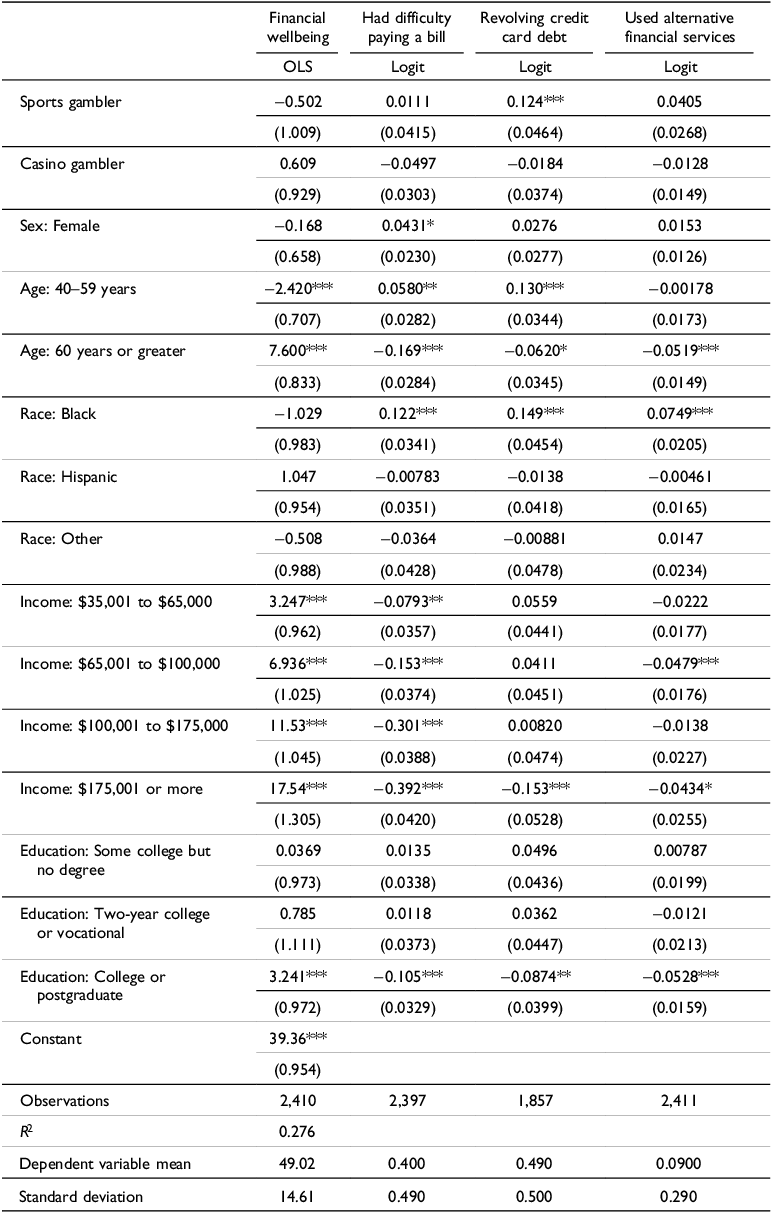
Table 2 shows a series of financial outcomes regressed on the demographic attributes in Table 1 and binary variables for being a sports gambler and a casino gambler. Financial wellbeing is created from the five-question CFPB scale which measures financial wellbeing from 0 to 100 (CFPB 2017). Having difficulty is a binary variable for answering yes to a survey question for having “difficulty paying a bill or expense” in the previous 12 months. Revolving credit card debt is, among those who have a credit card, not fully paying the last credit card bill. And using alternative financial services is answering yes to taking out a payday loan, an auto title loan, or a pawn shop loan in the past year. While financial wellbeing is continuous and the regressions use ordinary least squares, the other variables are binary, so the other regressions use a logit and the coefficients shown are the marginal effect at the mean (the change in the probability of the outcome given a one-unit change in the dependent variable, measured at the mean of the dependent variables, not the logit coefficients which are difficult to interpret). The bottom of the table shows the mean and standard deviation of the dependent variable to help scale effect sizes.
Regressions showing association between gambling and financial outcomes

Table 2. Long description
The table presents financial outcomes regressed on demographic attributes and binary variables for being a sports gambler and a casino gambler. It includes columns for financial wellbeing, difficulty paying a bill, revolving credit card debt, and use of alternative financial services. The table has 24 rows and 5 columns. Column headers are Financial wellbeing, Had difficulty paying a bill, Revolving credit card debt, and Used alternative financial services. Row labels include Sports gambler, Casino gambler, Sex: Female, Age: 40-59 years, Age: 60 years or greater, Race: Black, Race: Hispanic, Race: Other, Income: $35,001 to $65,000, Income: $65,001 to $100,000, Income: $100,001 to $175,000, Income: $175,001 or more, Education: Some college but no degree, Education: Two-year college or vocational, Education: College or postgraduate, and Constant. The table also includes observations, R-squared, dependent variable mean, and standard deviation at the bottom. Each row provides coefficients and standard errors for the respective variables. Notable trends include significant coefficients for age, income, and education levels, indicating their impact on financial outcomes.
Notes: Logit regressions report the marginal effects for each group, not the coefficients. The excluded group is male, age < 40 years, White, income $35,000 or less, high school or less education. Sports gambler and casino gambler are binary variables. Financial wellbeing is the financial wellbeing score (CFPB 2017). Alternative financial services are an indicator for using payday, auto title loan, or pawn loans in the past year. Revolving credit card debt is only among people with a credit card. Standard errors in parentheses. ***p < 0.01, **p < 0.05, *p < 0.1. Source: Author’s calculations from the 2025 Making Ends Meet survey, using survey weights to be nationally representative.
Being a sports gambler is not statistically associated with negative financial outcomes in Table 2 except for an increase in the likelihood of revolving credit card debt. The sample size of gamblers is not large, so it is possible that a larger sample could detect statistical effects. The point estimates are for a minor negative financial outcome, and the 95 percent confidence intervals around the coefficients typically include a modest negative effect size; the 95 percent confidence interval includes a fall of 2 points in financial wellbeing or an increase in the probability of having difficulty of 8 percentage points; yet the confidence intervals also include modest positive consequences for financial outcomes as well.
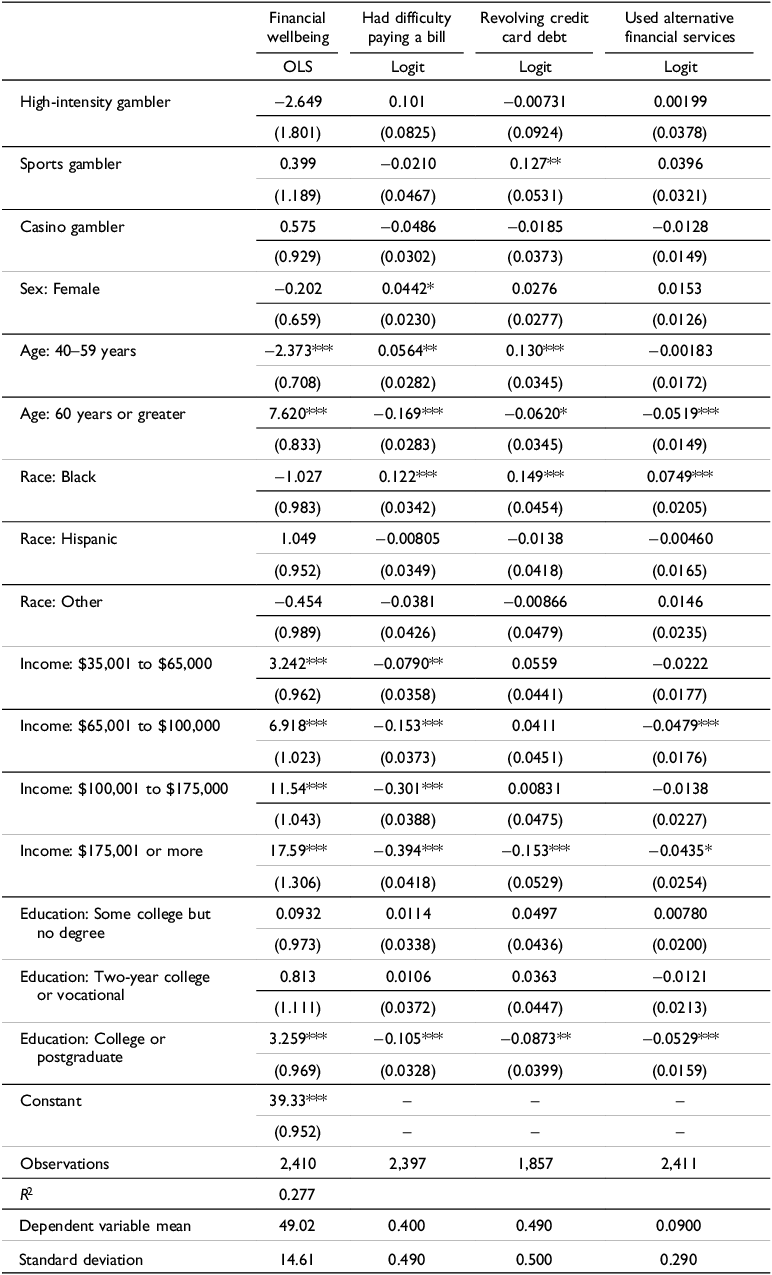
It is possible that, while the average sports gambler may not have negative outcomes, problem gamblers do. To partially explore this issue, Table 3 defines a binary variable for high-intensity gambling as someone who either placed a bet at least weekly, placed a typical bet that was more than $50, or lost $100 or more in a single day. High-intensity gambling may not be problem gambling but is a sign of engagement that could indicate addictive behavior and that financial losses could be large enough to be a problem. There are only 93 high-intensity gamblers by this definition in the data set, so the results are limited by a small sample. Table 3 shows the same regressions as in Table 2 now comparing high-intensity gamblers to everyone else. Being a high-intensity gambler is never conventionally significant, but its sign is always toward increasing financial problems (reducing financial wellbeing, increasing difficulty paying bills, increasing revolving, and increasing alternative financial services use), and it occasionally approaches conventional significance thresholds.
Regressions showing association between high-intensity gambling and financial outcomes

Table 3. Long description
A table comparing financial wellbeing, difficulty paying bills, revolving credit debt, and use of alternative financial services among different types of gamblers and demographic groups. The table has 24 rows and 5 columns. Column headers are Financial wellbeing, Had difficulty paying a bill, Revolving credit card debt, and Used alternative financial services. Row labels include High-intensity gambler, Sports gambler, Casino gambler, Sex: Female, Age: 40-59 years, Age: 60 years or greater, Race: Black, Race: Hispanic, Race: Other, Income: $35,001 to $65,000, Income: $65,001 to $100,000, Income: $100,001 to $175,000, Income: $175,001 or more, Education: Some college but no degree, Education: Two-year college or vocational, Education: College or postgraduate, and Constant. Each column contains regression coefficients and standard errors for different variables. Notable trends include significant negative associations between high-intensity gambling and financial wellbeing, and significant positive associations between age and financial wellbeing. The table also shows varying impacts of income and education levels on financial outcomes.
Notes: Logit regressions report the marginal effect for each group, not the coefficients. The excluded group is male, age < 40 years, White, income $35,000 or less, high school or less education. High-intensity gambler is a sports gambler who bet at least weekly, whose typical bet was more than $50, or lost $100 or more in a single day. Financial wellbeing is the financial wellbeing score. Alternative financial services are an indicator for using payday, auto title loan, or pawn loans in the past year. Revolving credit card debt is only among people with a credit card. Standard errors in parentheses. ***p < 0.01, **p < 0.05, *p < 0.1. Source: Author’s calculations from the 2025 Making Ends Meet survey, using survey weights to be nationally representative.
Finally, some people pointed to gambling as a cause of financial distress. After asking whether someone had “difficulty paying a bill or expense” in the previous year, the survey asked whether an event caused the difficulty with a list of potential, non-exclusive causes. 40.3 percent (s.e. 1.2) percent of people had difficulty and 39.7 percent of online sports gamblers had problems, not controlling for anything else as in Table 2. Among the people who had difficulty, 62.9 percent said there was an event or expense that caused the difficulty. And among all people who had difficulty and could point to an event, 2.4 (s.e. 0.75) percent selected “gambling losses” as a cause. Among sports gamblers, 2.3 (se. 1.1) percent had difficulty and selected sports gambling as a cause. Among sports gamblers who had difficulty and said there was a cause, 10.2 (s.e. 4.9) percent listed gambling as a cause for their difficulty. Among casino gamblers who had difficulty and said there was a cause, 12.0 (s.e. 4.2) percent listed gambling as a cause. Of course, even if respondents did not point to sports betting as being the cause of their financial distress, it may have contributed without being the primary cause.
The sample size for gamblers experiencing difficulty is small, however, so the main conclusion is that gambling was the direct cause of some financial distress according to the people experiencing financial distress, even if it was not associated with significant distress on average. For comparison, 38.4 (s.e. 2.3) percent of people who had difficulty and could point to a cause listed auto repairs as one of the causes.
3.5. Sports gambling and financial decision-making
Sports gamblers rated their ability to make complex financial decisions higher than non-sports gamblers, yet were more impatient, and made clear financial mistakes more frequently. Figure 5 Panel (A) shows the distribution of how people responded to “I know how to make complex financial decisions” with a scale ranging from “completely” to “not at all.” While 1.7 percent of non-sports gamblers selected not at all, no sports gamblers did, and sports gamblers were more likely to select that the statement described them completely. While the confidence intervals do not reject equality within each segment between sports gamblers and non-sports gamblers, when tested jointly sports gamblers statistically rate themselves as better able to make complex financial decisions than non-gamblers at a 99 percent confidence level. I examine later whether these differences could be explained by other differences between sports gamblers and non-gamblers.
Self-assessed ability to make complex financial decisions and willingness to delay receiving money by sports betting.
Notes: 95% confidence intervals. Discount ranges are implied by the answers to three questions. “Suppose you won a prize and could decide when you would get the amount. Would you rather get:” Question 1: “$1000 in one month or $1050 in six months;” Question 2: “$1000 in one month or $1100 in six months;” Question 3: “$1000 in one month or $1150 in six months.” Only respondents who answered consistently (Fulford and Shupe Reference Fulford and Shupe2026) are included. Source: Author’s calculations from the 2025 Making Ends Meet survey, using survey weights to be nationally representative.

Figure 5. Long description
Two bar graphs compare financial decision-making ability and implied annual discount rates between non-sports bettors and sports bettors. Panel A shows responses to the statement I know how to make complex financial decisions. This statement describes my situation. The horizontal axis represents percent, and the vertical axis lists response categories: Completely, Very well, Somewhat, Very little, and Not at all. Non-sports bettors and sports bettors are represented by different colors. Non-sports bettors have higher percentages in the Completely and Very well categories, while sports bettors have higher percentages in the Somewhat and Very little categories. Panel B shows implied annual discount rates from money earlier or later questions. The horizontal axis represents percent, and the vertical axis lists discount rate ranges: less than 11.1 percent, 11.1 to 20.4 percent, 20.4 to 28.4 percent, and greater than 28.4 percent. Non-sports bettors and sports bettors are again represented by different colors. Non-sports bettors have higher percentages in the less than 11.1 percent and 11.1 to 20.4 percent ranges, while sports bettors have higher percentages in the 20.4 to 28.4 percent and greater than 28.4 percent ranges.
At the same time, Figure 5 Panel (B) shows that sports gamblers were more impatient than non-sports gamblers. The survey asked a series of “money earlier or later questions” as described in Fulford and Shupe (Reference Fulford and Shupe2026) which divide respondents into a range of annual discounts. Sports gamblers were less likely to have a low discount rate (less than 11 percent) and more likely to have a high discount rate (above 28 percent). A joint test confirms that sports gamblers have a higher discount factor with 99 percent confidence. These “money earlier or later” questions measure whether someone is willing to take an investment, or the “required rate of return” for delaying payment (Cohen, et al. Reference Cohen, Ericson, Laibson and Myles White2020). Despite their widespread use, these questions measure time preferences only under narrow circumstances (Fulford and Shupe Reference Fulford and Shupe2026), so an alternative interpretation is that sports gamblers believe, perhaps overoptimistically, that they have better investment opportunities than non-gamblers and so are willing to turn down lower-return investments.
Finally, the survey asked respondents to give the probability of experiencing “a major out-of-pocket medical or dental expense in the next year.” Even for healthy young adults, this probability is not zero, although it may be low (Fulford and Low Reference Fulford and Low2024), so answering zero is a sign of overconfidence which may lead to a financial mistake. Yet 20.3 percent (s.e. 3.4) of sports gamblers placed zero probability of medical expenses, compared to 16.4 percent (s.e. 1.1) of non-gamblers, although the confidence intervals do not reject equality between the two groups. It is possible that this variable captures a misunderstanding of probabilities, rather than overconfidence. Yet it is striking that in Figure 5 Panel (A), sports gamblers rated themselves better able to make complex financial decisions yet incorrectly assigned zero probability more frequently.
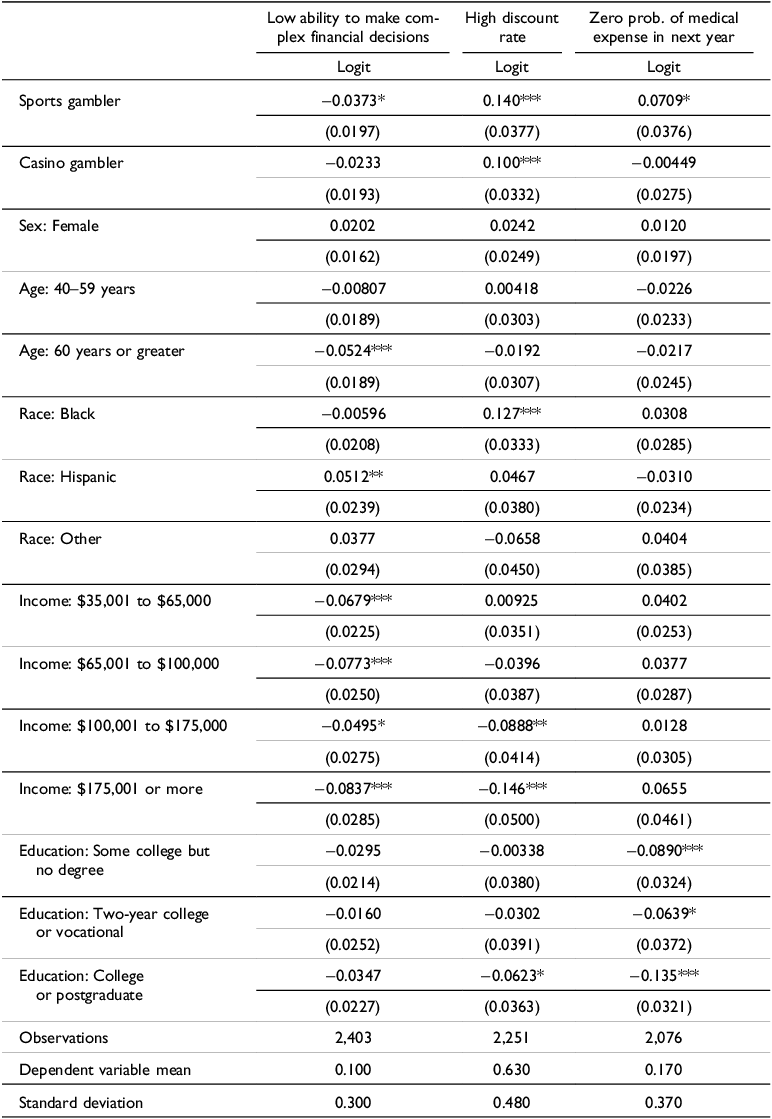
Because sports gamblers differ systematically from non-gamblers in Table 1, it could be that these differences are explained by having higher education or income. Table 4 shows logit regressions (the reported coefficients are the marginal effects at the mean) which control for the demographic characteristics in Table 1. The outcomes are binary variables for reporting that “I know how to make complex financial decisions” describes them “very little” or “not at all” (“Low ability to make complex financial decisions”), having the highest discount rate in Figure 5, or reporting there was a zero probability of an out-of-pocket medical expense in the next year.
Regressions showing association between gambling and financial decision-making

Table 4. Long description
A table showing regression analysis of the association between gambling and financial decision-making. The table has 18 rows and 12 columns. The columns are labeled as follows: Low ability to make complex financial decisions (Logit), High discount rate (Logit), and Zero probability of medical expense in next year (Logit). The rows are labeled with different categories: Sports gambler, Casino gambler, Sex: Female, Age: 40–59 years, Age: 60 years or greater, Race: Black, Race: Hispanic, Race: Other, Income: $35,001 to $65,000, Income: $65,001 to $100,000, Income: $100,001 to $175,000, Income: $175,001 or more, Education: Some college but no degree, Education: Two-year college or vocational, Education: College or postgraduate. Each cell contains regression coefficients with standard errors in parentheses. Notable trends include significant associations for sports gamblers and casino gamblers with high discount rates, and various significant associations for different income and education levels across the three outcomes.
Notes: All regressions are logit regressions reporting the marginal effect for each group, not the coefficients. The excluded group is male, age < 40 years, White, income $35,000 or less, high school or less education. Sports gambler and casino gambler are binary variables. Financial wellbeing is the financial wellbeing score. Alternative financial services are an indicator for using payday, auto title loan, or pawn loans in the past year. Revolving credit card debt is only among people with a credit card. Standard errors in parentheses. ***p < 0.01, **p < 0.05, *p < 0.1. Source: Author’s calculations from the 2025 Making Ends Meet survey, using survey weights to be nationally representative.
Controlling for other factors, sports gamblers were 3.7 percent less likely to have a low self-assessed ability to make complex financial decisions, 14 percent more likely to have the highest discount rate, and 7.1 percent more likely to give a zero probability of medical expenses.Footnote 8 Thus, despite rating themselves as better able to make financial decisions than other people with similar attributes, sports gamblers were more likely to overoptimistically assess their medical expense risk to be zero. These findings are consistent with Grubbs and Krauss (Reference Grubbs and Kraus2023a) who show that sports bettors are more likely to use cryptocurrencies and Grubbs and Krauss (Reference Grubbs and Kraus2023c) who show that sports bettors are more likely to engage in other impulsive or addictive behaviors. The evidence suggests that, compared to a similar population, sports gamblers are particularly likely to be people who mistakenly believe in their own ability to beat the odds.
4. Discussion and conclusion
The results in this article suggest that the spread of online sports gambling is not as financially problematic on average as it might initially appear. Sports gamblers have higher income and education than non-gamblers. Most bets were small, and most sports gamblers were not betting often or for large amounts. As a result, on average, sports gamblers did not have more negative financial outcomes statistically, controlling for income and other demographic attributes, although the point estimates are modestly negative and some people point to gambling as a cause for financial difficulty. It is possible a larger sample might detect significant effects. Future studies might benefit from collecting information that can distinguish sports gambling, which is not generally associated with negative outcomes, from problematic gambling, such as the problem gambling index (Ferris and Wynne Reference Ferris and Wynne2001) used in Grubbs and Kraus (Reference Grubbs and Kraus2022). In addition, because survey space and respondent attention are always limited, developing or refining questions that measure gambling intensity and problems without burdening respondents is important.
Yet the rapid spread of online sports betting is concerning because it makes gambling available to more people and makes it continuously accessible. When gambling was limited to certain locations – the track or a casino – gamblers had to physically go there which limited access and made it harder to develop an addiction. Online sports gambling makes gambling constantly available and so potentially more addictive. The harm could thus be concentrated among a few people, and, indeed, some people do point to gambling as a cause of their financial distress. A third of sports gamblers exhibited high-intensity gambling behavior in 2025 by placing a bet at least weekly, placing a typical bet that was more than $50, or losing $100 or more in a single day. At the same time, there are significant state tax revenue gains from online betting (Taylor et al. Reference Taylor, McCarthy and Wilbur2025). Policy makers will need to weigh these distributed entertainment and tax revenue gains against potentially more concentrated harms.





 Open access

