Introduction
Precision agriculture (PA) is commonly defined as the adoption of new technologies for managing spatial and temporal farming variation for improving overall efficiency and economic return. Precision agriculture technologies have been available for several decades; however only specific technologies have been readily adopted. Of these technologies, farms have, until recently, by and large focused on the adoption of those characterized as ‘embodied knowledge’ technologies – that is, the adoption of technologies where no additional skills are needed by the individual to enhance the value embodied in the technology (e.g. automated guidance) (Griffin et al., Reference Griffin, Lowenberg-DeBoer, Lambert, Peone, Payne and Daberkow2004). Unlike ‘embodied technologies’, ‘information intensive’ technologies provide extra information that can be useful in decision making, but in order to fully capitalize on these technologies they require specialized skills and additional time investment by the farmer (e.g. variable rate seeding).
Farm-level utilization of individual or combinations of ‘information intensive’ technologies however, is still not well understood. Beginning in 2015, Kansas Farm Management Association (KFMA) farmer-members’ historic utilization of precision agriculture technologies was appended to the KFMA databank, which provides annual farm-level production and cost data to its members. This study uses the results of the survey to describe the adoption path of three information intensive PA technologies (yield monitor, precision soil sampling, and variable rate). Specific objectives include; 1) determining the technologies that farmers adopt, and 2) estimating the probability of transitioning from one bundle of technologies to another. To meet the first objective, farms were classified as having adopted one of eight possible technology ‘bundles’ (i.e. states of the world) - seven combinations of one or more of the three technologies in addition to a possible ‘no technology adopted’ category. Markov transition probabilities were then estimated to show the probability or likelihood of transitioning from one bundle of technology to another.
Literature Review
For information intensive technologies, the introduction of yield monitor technologies with or without global navigation satellite systems (GNSS) was an important step for integration of PA in farming systems (Erickson and Widmar, Reference Erickson and Widmar2015). Adoption rates for information intensive technologies have been documented from several researchers (Griffin et al., Reference Griffin, Lowenberg-DeBoer, Lambert, Peone, Payne and Daberkow2004; Daberkow et al., Reference Daberkow, Fernandex-Cornejo and Padgitt2003; Popp et al., Reference Popp, Griffin and Pendergrass2002). The latter studies presented fluctuations on the level of adoption, generally increasing from the 1990’s until the mid-2000’s, emphasizing potential barriers to adopting PA technologies (Fountas et al., Reference Fountas, Blackmore, Ess, Hawkins, Blumhoff, Lowenberg-DeBoer and Sorensen2005; Kitchen et al., Reference Kitchen, Snyder, Franzen and Wiebold2002; Popp et al., Reference Popp, Griffin and Pendergrass2002). A more updated study portraying a recent historical trend (2000–2016) was pursued via utilization of the Kansas Farm Management Association (KFMA) databank to include farm-level adoption of PA technologies (Griffin, Reference Griffin2016; Griffin et al., Reference Griffin, Miller, Torrez, Ciampitti and Sharda2016; Miller, et al., Reference Miller, Griffin and Bergtold2016; Torrez et al., Reference Torrez, Miller, Ramsey and Griffin2016). Although this study uses a unique dataset to evaluate whole-farm profitability with respect to PA adoption, at least three other similar studies have been conducted (Lambert et al., Reference Lambert, Paudel and Larson2015; Olson and Elisabeth, Reference Olson and Elisabeth2003; Schimmelpfennig and Ebel, Reference Schimmelpfennig and Ebel2016). Olson and Elisabeth (Reference Olson and Elisabeth2003) examined whole-farm impacts of PA adoption in Minnesota during the infancy of PA technologies. They reported that 59 of 212 farms surveyed used at least some precision technology in their operation – but they were unable to discern differences between adopters and non-adopters due to the relatively small sample size of their study. Most studies on technology adoption and profitability have been disjointed however, focusing solely either on farm-level adoption or profitability of technology. Schimmelpfennig and Ebel (Reference Schimmelpfennig and Ebel2016) used USDA data to report sequential adoption of combine yield monitors with and without GNSS along with variable rate application technologies. They examined the cost differences between adopters and non-adopters of precision technology. Lambert et al. (Reference Lambert, Paudel and Larson2015) evaluated cotton farmers’ adoption of precision technology and reported that farmers have adopted technologies in bundles. The most recognized report of PA technology utilization addresses service providers such as agricultural retailers rather than at the farm-level (Erickson and Widmar, Reference Erickson and Widmar2015). However, the use of PA at the retail level translates to the technology being used on farmers’ fields.
Also missing from the literature are studies that evaluate the sequence of technology adoption (i.e. the movement by a farm from one technology bundle to another). Knowledge of the adoption path with respect to the sequence of individual or bundles of technology can help inform farmers regarding the activities of their peers. Potentially more important, this knowledge provides both farmers and sales forces with information on what sequence was associated with persistent use of technology or alternatively, total abandonment. The sequence of technology adoption can be evaluated with Markov methods (Eddy, Reference Eddy1998). Markov transition probabilities have been applied to soil erosion classification (Skaggs and Ghosh, Reference Skaggs and Ghosh1999), farm size distribution (Gillespie and Fulton, Reference Gillespie and Fulton2001; Hallberg, 1969), health and medicine (Jung, Reference Jung2006), land use change (Muller and Middleton, Reference Muller and Middleton1994), and persistence of farm profitability states (Stabel et al., Reference Stabel, Griffin and Ibendahl2016). This technique has yet to be applied to the sequential adoption of technology by farms.
Data, Descriptive Statistics and Methods
Beginning in the fall of 2015, the KFMA dataset was appended with farmers’ adoption of PA technologies (Griffin, Reference Griffin2016). Each KFMA economist asked farmer-members if specific technology was used on their farm and if so, when the technology was first employed during regularly scheduled annual visits. The electronic KFMA databank includes detailed farm-level agronomic and financial information from 1973 to 2015. By August 2016, 348 farms reported their respective adoption and utilization of PA technologies. Building upon previous KFMA research reports (Griffin, Reference Griffin2016; Miller et al., Reference Miller, Griffin and Bergtold2016), the current analysis evaluates the sequence of individual PA technologies adopted as bundles and estimates the probability of transitioning between bundles of technology.
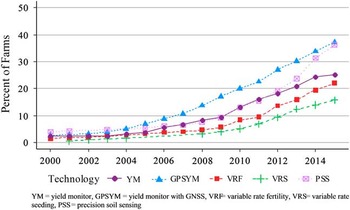
The adoption of yield monitors has historically been the yardstick to measure adoption of PA technologies. Currently, nearly all new combine harvesters come equipped with yield monitors although this does not imply full utilization at the farm level. Even for farms purchasing used combines, there is a substantial likelihood that these machines will have a yield monitor already installed. Less than half of farmers have adopted yield monitors (Figure 1), which is consistent with the USDA-ARMS estimates (Schimmelpfennig and Ebel, Reference Schimmelpfennig and Ebel2016). Unlike USDA ARMS survey, the KFMA data suggests relatively more yield monitors being associated with GNSS than without GNSS (Figure 1).
Utilization of precision agriculture technologies in Kansas, 2000 to 2016.

Kansas farms make use of precision soil sampling although adoption rates are still less than half of the number of all farmers reporting to the KFMA study (Figure 1). Roughly one in four and one in five farms make use of variable rate technology for application of fertilizer and seed, respectively (Figure 1). These results are consistent with USDA ARMS reports.
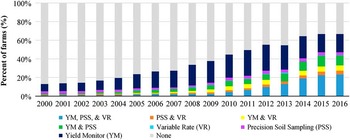
The three information intensive technologies examined included 1) yield monitor (YM) with or without GNSS 2) variable rate application of inputs (VR), and 3) precision soil sampling (PSS). The number of farms that adopted these three technologies either individually or in bundles from 2000 to 2016 is presented in Figure 2. The proportion of non-adopters steadily declined by over 60% over the last 15 years, with a pronounced reduction over the last six years. Of the farms with only one PA technology, YM was the most widely adopted, while VR was the least adopted single technology. The prevalence of YM may partially be due to it becoming standard equipment on most North American combine harvesters since about 2005. It should be noted that in many years there were no farms with only VR and even recently only one farm had VR as the sole PA technology. When considering farms with two of the three PA technologies, the greatest number of farms adopted YM with PSS. More farmers used PSS with VR from 2000 to 2004 than YM with VR; however, this trend generally reversed since 2007. The complete bundle of all three information intensive technologies became more pronounced from about 2010 and has steadily increased over the last six years. Currently, among all PA categories examined, the number of farms with the complete PA bundle is only exceeded by the number of YM-only farm operations (Figure 2). However, non-adopters remain the largest proportion of the eight categories at one-third of all farms in 2016.
Information intensive technology utilization in Kansas, 2000 to 2016, N=348.

The probability of transitioning from one bundle of PA technology to any other bundle was estimated over a 17-year time period from 2000 to 2016 (17 year period leading to 16 observations of transitions (t−1)). Transition probabilities were estimated to indicate the likelihood that a farmer would stay with the same bundle of technologies or transition to a different bundle in a given year. Markov transition probabilities of transitioning from one state of the world to any other state can be estimated with a one-step Markov chain (i.e. one year of memory). These probabilities indicate the likelihood that an individual would stay in their respective state or transition to a different state by the next time period. A one-step transition probability matrix, P, from one state to another state, was estimated. The transition probability matrix, P, is the matrix consisting of one-step transition probabilities, p ij , defined as
 $$p_{{ij}} =Pr\left\{ {X_{t} =j{\rm \:\mid }X_{{t{\minus}1}} =i} \right\}$$
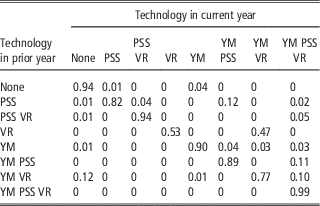
where p ij is a one-step transition probability equal to the probability of being in technology bundle state j given the individual farm was in technology bundle state i in the previous year, t–1. The underlying assumption of these models is that the state of the world in time t is only a function of the previous time period, time t–1. The probability of transitioning from adoption of one bundle of PA technologies to another bundle was estimated for the KFMA database subset for the historical period 2000 to 2016 (Table 1).
Transition probabilities between information intensive precision agriculture technology bundles, 2000–2016 (n=348)

Results
Overall, farmers tended to remain in the same bundle of technology, however transitions between bundles were observed. For example, the values in each row show that farms changed from using the given technology (in the row) to another technology-use category or stayed in the same category (in the columns) (Table 1). Consider the bundle of YM and PSS in row 6 of Table 1. The likelihood that farms keep using YM and PSS from one year to the next year is approximately 89%; however, the likelihood of farms adding variable rate technology (VR) to this bundle of PA technologies is approximately 11%. Where the probabilities along the principle diagonal are the highest value in each row, it is said that persistence occurs (i.e. farms are likely to remain in their current state the following year). Persistence was observed for all eight possible bundles. When a farm had only YM in the previous year there was a 90% likelihood that the farm would only have YM in the current year. However, when a farm with only yield monitor in the previous year added another technology, then most of the time they adopted PSS followed by VR or a combination of VR and PSS. This suggests that adoption of these new technologies is a longer process than some may anticipate, given the persistence.
Given the normal sequence of adoption, consider the behavior of non-adopters (i.e. ‘none’). For a farm that had none of the three technologies, the probability that the farm would have multiple technologies (YM and VR, YM and PSS, PSS and VR, or YM, PSS, and VR) in the following year was very slight, with all probabilities below half of one percent. The probability of non-adopters adopting an individual technology was greater than the probability of adopting a bundle of technologies, albeit still small. When non-adopters do adopt a technology, they most likely adopt YM and to a lesser extent PSS. However, the least likely transition was from no technology to the YM and PSS bundle. This makes some sense given that both YM and PSS are data collection technologies and VR relies upon these data to make applications. For farms that had no technology bundle in the previous year, the probability of still having no PA technology the next year was relatively higher than other values along the principal diagonal of the transition matrix. Specifically, the likelihood of remaining a non-adopter is 94%, second only to the probability of farms that had all three technologies (YM, PSS, and VR) in the previous year persisting with the same bundle the following year.
Consider the least likely bundle that non-adopters transition to, YM and PSS. The likelihood that farms keep using YM and PSS from year to year is approximately 89%. A moderately strong likelihood exists (11%) that these farms will add VR to their VM and PSS bundle of precision agricultural practices the following year.
When considering the adopters least likely to remain in the same category the following year, the focus shifts to VR. Farms that persist with only VR do so about half of the time (0.53). The other half of the time (0.47), VR farms add YM the following year. This bundle of technologies is interesting given the behavior of those farms using the YM and VR bundle. These farms persisted with the YM and VR bundle only about three-fourths (0.77) of the time. Twelve percent of the time YM and VR farms transitioned to no technology in the next time period (i.e. they disadopted all PA technologies). Ten percent of the time, farms with the YM and VR bundle add PSS, thereby adopting the most persistent combination of technologies (0.99). When all three available information intensive technologies were adopted, farmers tended to persist with that bundle indicating that some sort of optimal combination had been achieved.
The farms with either no technology or the complete bundle tend to persist with current technology utilization relative to the remaining farms that have adopted only one or two technologies. In all cases, farms tended to remain with the given level of technology adopted in the previous year. For instance, when a farm had only YM in the previous year there was 90% likelihood that the farm would only have YM in the current time period. However, when a farm with only yield monitor adds a second technology, PSS was adopted most of the time followed by either VR on its own or a combination of both VR and PSS.
Conclusion
Results suggest that farms inhabiting either end of the adoption spectrum (i.e. those with no technology bundles and those with all three available information intensive technologies) behave differently than those farms that have adopted only one or two technologies – they are more steadfast in their stance towards technology adoption. Farms that adopted all three information intensive technologies were likely to remain with that bundle in the next year; thus indicating saturation or arrival at an optimal combination of technology. Firms in the agricultural industry vying to become ‘big data’ service providers are likely to avoid working with farms that only have specific technologies such as ‘only YM’ or ‘only VR’. These big data companies are more apt to work with farms that use all three technologies to ensure that the farm is likely to continue providing site specific data. Results provide useful information for policymakers trying to promote adoption of PA technologies. For example, adoption of PA technologies has been promoted using financial incentives in USDA, Natural Resource Conservation Service programs, such as the Environmental Quality Incentives Program (USDA-NRCS, 2016). Policymakers wishing to promote adoption need to be aware of the generally slow rate of adoption of PA technologies and allow programs to be available long enough to achieve desired adoption rates and conservation goals. Further insights into farm decision-making regarding technology adoption can be explored from a deeper analysis of the current KFMA database.
Future research includes tagging adoption data to agronomic and financial characteristics to farms in the KFMA databank. Results from future analyses are expected to indicate the financial and demographic characteristics of adopters and also those adopters who made use of PA technology such that they profited more than their comparison group.
Acknowledgements
The authors appreciate the contributions of KFMA farmer members, the KFMA economists, Koren Roland with KMAR-105, Emily Carls, and Kevin Herbel. The K-State Research and Extension (KSRE) Precision Ag Team assisted with defining the survey instrument and technologies.