Introduction
Human capital improves labor productivity and is famously difficult to measure directly (Romer Reference Romer1990). In competitive markets, the consequence of greater human capital is greater labor demand, higher wages, and greater employment. Especially in historical cases, it is difficult to identify individuals with greater or lesser human capital. Using US Census data between 1850 and 1910, we compare human capital investment decisions and economic outcomes between the hearing and deaf populations – who intrinsically differ by endowed human capital composition. Historically, deafness was unique among human capital endowments because it was irreversible and usually occurred congenitally or prior to other measured human capital investments. Examining the deaf population also provides insight into how individuals respond to differing human capital endowments. In addition to documenting some stylized facts about the historical deaf population, we use simple ordinary least squares and probit models to find that being deaf resulted in less physical and educational human capital accumulation and commensurately lower economic benefits.Footnote 1 Ultimately, about a 9.4 percentage point employment gap and 5 percentage point literacy and earnings gaps persisted between the deaf and hearing populations throughout adulthood.
The lack of hearing is inseparable from the social details that shaped the lives of deaf people of the period. For example, deaf people typically attended specialized state or residential schools away from their homes. Whereas the larger population of hearing students in the country or in a particular state might be expected to share the same fundamental educational content, deaf schools differed starkly across time and location. Such differences included emphases on sign language, signing letters, articulated speech, and lip reading.Footnote 2 Economic outcomes for deaf adults may have been due specifically to human capital differences, less ability to effectively interact with much of hearing society, or animus discrimination exercised by the hearing majority. These three mechanisms for the cause of economic development differences provide an opportunity to evaluate corroborating evidence, such as by including deafness in a human capital production function. Regardless of the mechanisms by which differences arose, we illustrate systemic economic differences between the historical hearing and deaf populations. Though most US states introduced subsidies for schools for the deaf and successfully increased deaf enrollment, the period is useful to study due to the lack of other government social support for either the deaf or hearing populations. That the late nineteenth-century census data identify hearing status provides a unique opportunity to model human capital differences without the complicating factors of disability services or insurance administered by employers or states.
As of 2022, about 3.7 percent of the US population experienced “difficulty hearing” and the modal estimate of American Sign Language (ASL) users was about 0.17 percent in 2005 (Mitchell et al. Reference Mitchell, Young, Bachelda and Karchmer2006; Ruggles et al. Reference Ruggles, Flood, Sobek, Backman, Chen, Cooper, Richards, Rogers and Schouweiler2024). Most modern research on deaf people occurs in the fields of Deaf Studies or Disability Studies. The three dominant models of deafness are the medical, social, and cultural models. The medical model considers deafness to be a physical defect or a disability that may be resolved or accommodated with clinical, surgical, or counseling interventions (Bergeron et al. Reference Bergeron, Berland, Demers and Gobeil2020; Kushalnagar et al. Reference Kushalnagar, Claire Ryan, Spellun and Gulati2020; Lahlou et al. Reference Lahlou, Daoudi, Ferrary, Jia, De Bergh, Nguyen, Sterkers and Mosnier2022). In contrast, the social model focuses on shared experiences between deaf people and their environment (Franz Reference Franz2016). This school of thought emphasizes that deafness is not a disability and that it is only broadly considered as such because society has produced institutional and technological innovations that presume hearing as normal. The cultural model explores power dynamics and hierarchies to focus on women and minority experiences (Friedner Reference Friedner, Burch and Kafer2010). Insofar as we can tell, there has been no economic analysis of the deaf population using the theoretical toolkit that the field of economics provides.
Apart from contemporary US Census reports, no study has quantitatively examined the US deaf population during the sample period, though researchers conducting regression analysis commonly use deafness as a control variable (Becker and Woessmann Reference Becker and Woessmann2008; Reference Becker and Woessmann2009) or strike deaf people from samples entirely (Lennon Reference Lennon2016). We argue that including a simple indicator variable for deafness in regression analysis is inappropriate when there may be substantially different life-cycle timings, such as with school attendance and employment. Studies that are sensitive to life-cycle differences should conduct separate analyses by subpopulation or use age-interaction variables to avoid misestimating coefficients. We also find that as schools for the deaf opened in states across the US, deaf children began attending schools at dramatically higher rates. Using variation in the timing of these school openings, we argue that access to schools for the deaf resulted in deaf adults choosing to consume the relational goods found in the larger deaf community in lieu of higher earnings.
We proceed as follows: Section 2 provides a baseline of contextual details concerning the nineteenth-century deaf population and their education in the United States. Section 3 introduces the analytical model and Section 4 summarizes the statistical differences between the hearing and deaf populations. Section 5 introduces and analyzes the data using probit and ordinary least squares models with standard errors clustered by state. Section 6 concludes the article.
Nineteenth century deaf education and employment
The number of deaf people who lived in the US was thought to be underestimated by contemporary census reports (US Census Bureau 1853; 1864; 1872). Depending on the context, “deaf” may not have implied zero ability to hear. The 1894 national census report used the standard of “unable to hear loud conversation” (Billings Reference Billings1894: 1). Some census enumerators noted ability to hear separately from ability to speak, while others ignored the distinction. Further, being merely “dumb” often connoted that one could not speak, while being “deaf-mute” or “deaf and dumb” connoted congenital deafness or pre-verbal onset.Footnote 3 The vast majority of deaf-mute individuals had been so for the preponderance of their lives. The same report measured that 45 percent of deaf-mutes had been so since birth, 41 percent since prior to 5 years of age, 8.8 percent since prior to 10 years of age, and 3.5 percent since prior to 20 years of age. Our analysis includes both the deaf-speaking and non-speaking populations.
Mason Cogswell, a prominent Hartford physician and father of a young deaf daughter, successfully lobbied the General Association of Congregational Ministers in Connecticut to enumerate the state’s deaf population for the first time. Finding 84 deaf individuals and estimating about 400 in all of New England, Cogswell raised private funds to send his neighbor, Thomas Gallaudet, to research the state of European deaf education in 1815. After beginning briefly in Britain, Gallaudet was ultimately welcomed by Laurent Clerc who, after being a pupil, was an instructor of manual sign language in Paris. Gallaudet was so impressed by the instruction that he offered Clerc a three-year teaching contract in a bid to establish a school for the deaf in the US. Clerc agreed and by the summer of 1816, the pair began a fundraising tour of the US northeast in which Clerc lectured by signing enthusiastically and replying to audience questions while Gallaudet interpreted. After great success and approval of the Connecticut legislature in 1817, the first school for the deaf, the American School for the DeafFootnote 4 , was founded in Hartford (Edwards Reference Edwards2012, 14–15, 20–24). Eleven-year-old Alice Cogswell was the school’s first student.
In Europe, two methods of deaf instruction were popular. The oral method, dominant in Britain, emphasized the ability of deaf students to lip-read and speak audibly. The manual method, popular in Paris, emphasized communication by making hand signals – sign language. Not a mere difference in style, advocates of the two methods would debate throughout the nineteenth and early twentieth century the relative merits of the two teaching methods. Each method was often associated with particular social goals for deaf students and the society that would interact with them. The American School for the Deaf employed the manual method along with learning to read and write English. Sign language enabled deaf individuals to converse fluently with one another while emphasizing literacy provided a means by which deaf and hearing people could interact with a single, reciprocal standard for communication. The alternative of lip-reading and speaking orally was largely reserved for communication between deaf and hearing individuals, often requiring strained effort on the part of both (Gallaudet Reference Gallaudet1900).
Most American deaf children in the first quarter of the nineteenth century briefly attended schools for the hearing or remained at home. Teachers at schools for the hearing were not trained to teach deaf students, who often withdrew in frustration. Given the thin distribution of deaf people throughout most of the US, many deaf people developed idiosyncratic gestures that could be used to communicate with their relations (Baynton Reference Baynton1996: 113; Edwards Reference Edwards2012: 60, 69). As a result, many deaf individuals did not know of other deaf people nor would they have been able to communicate with them even if they had (Edwards Reference Edwards2012: 12).
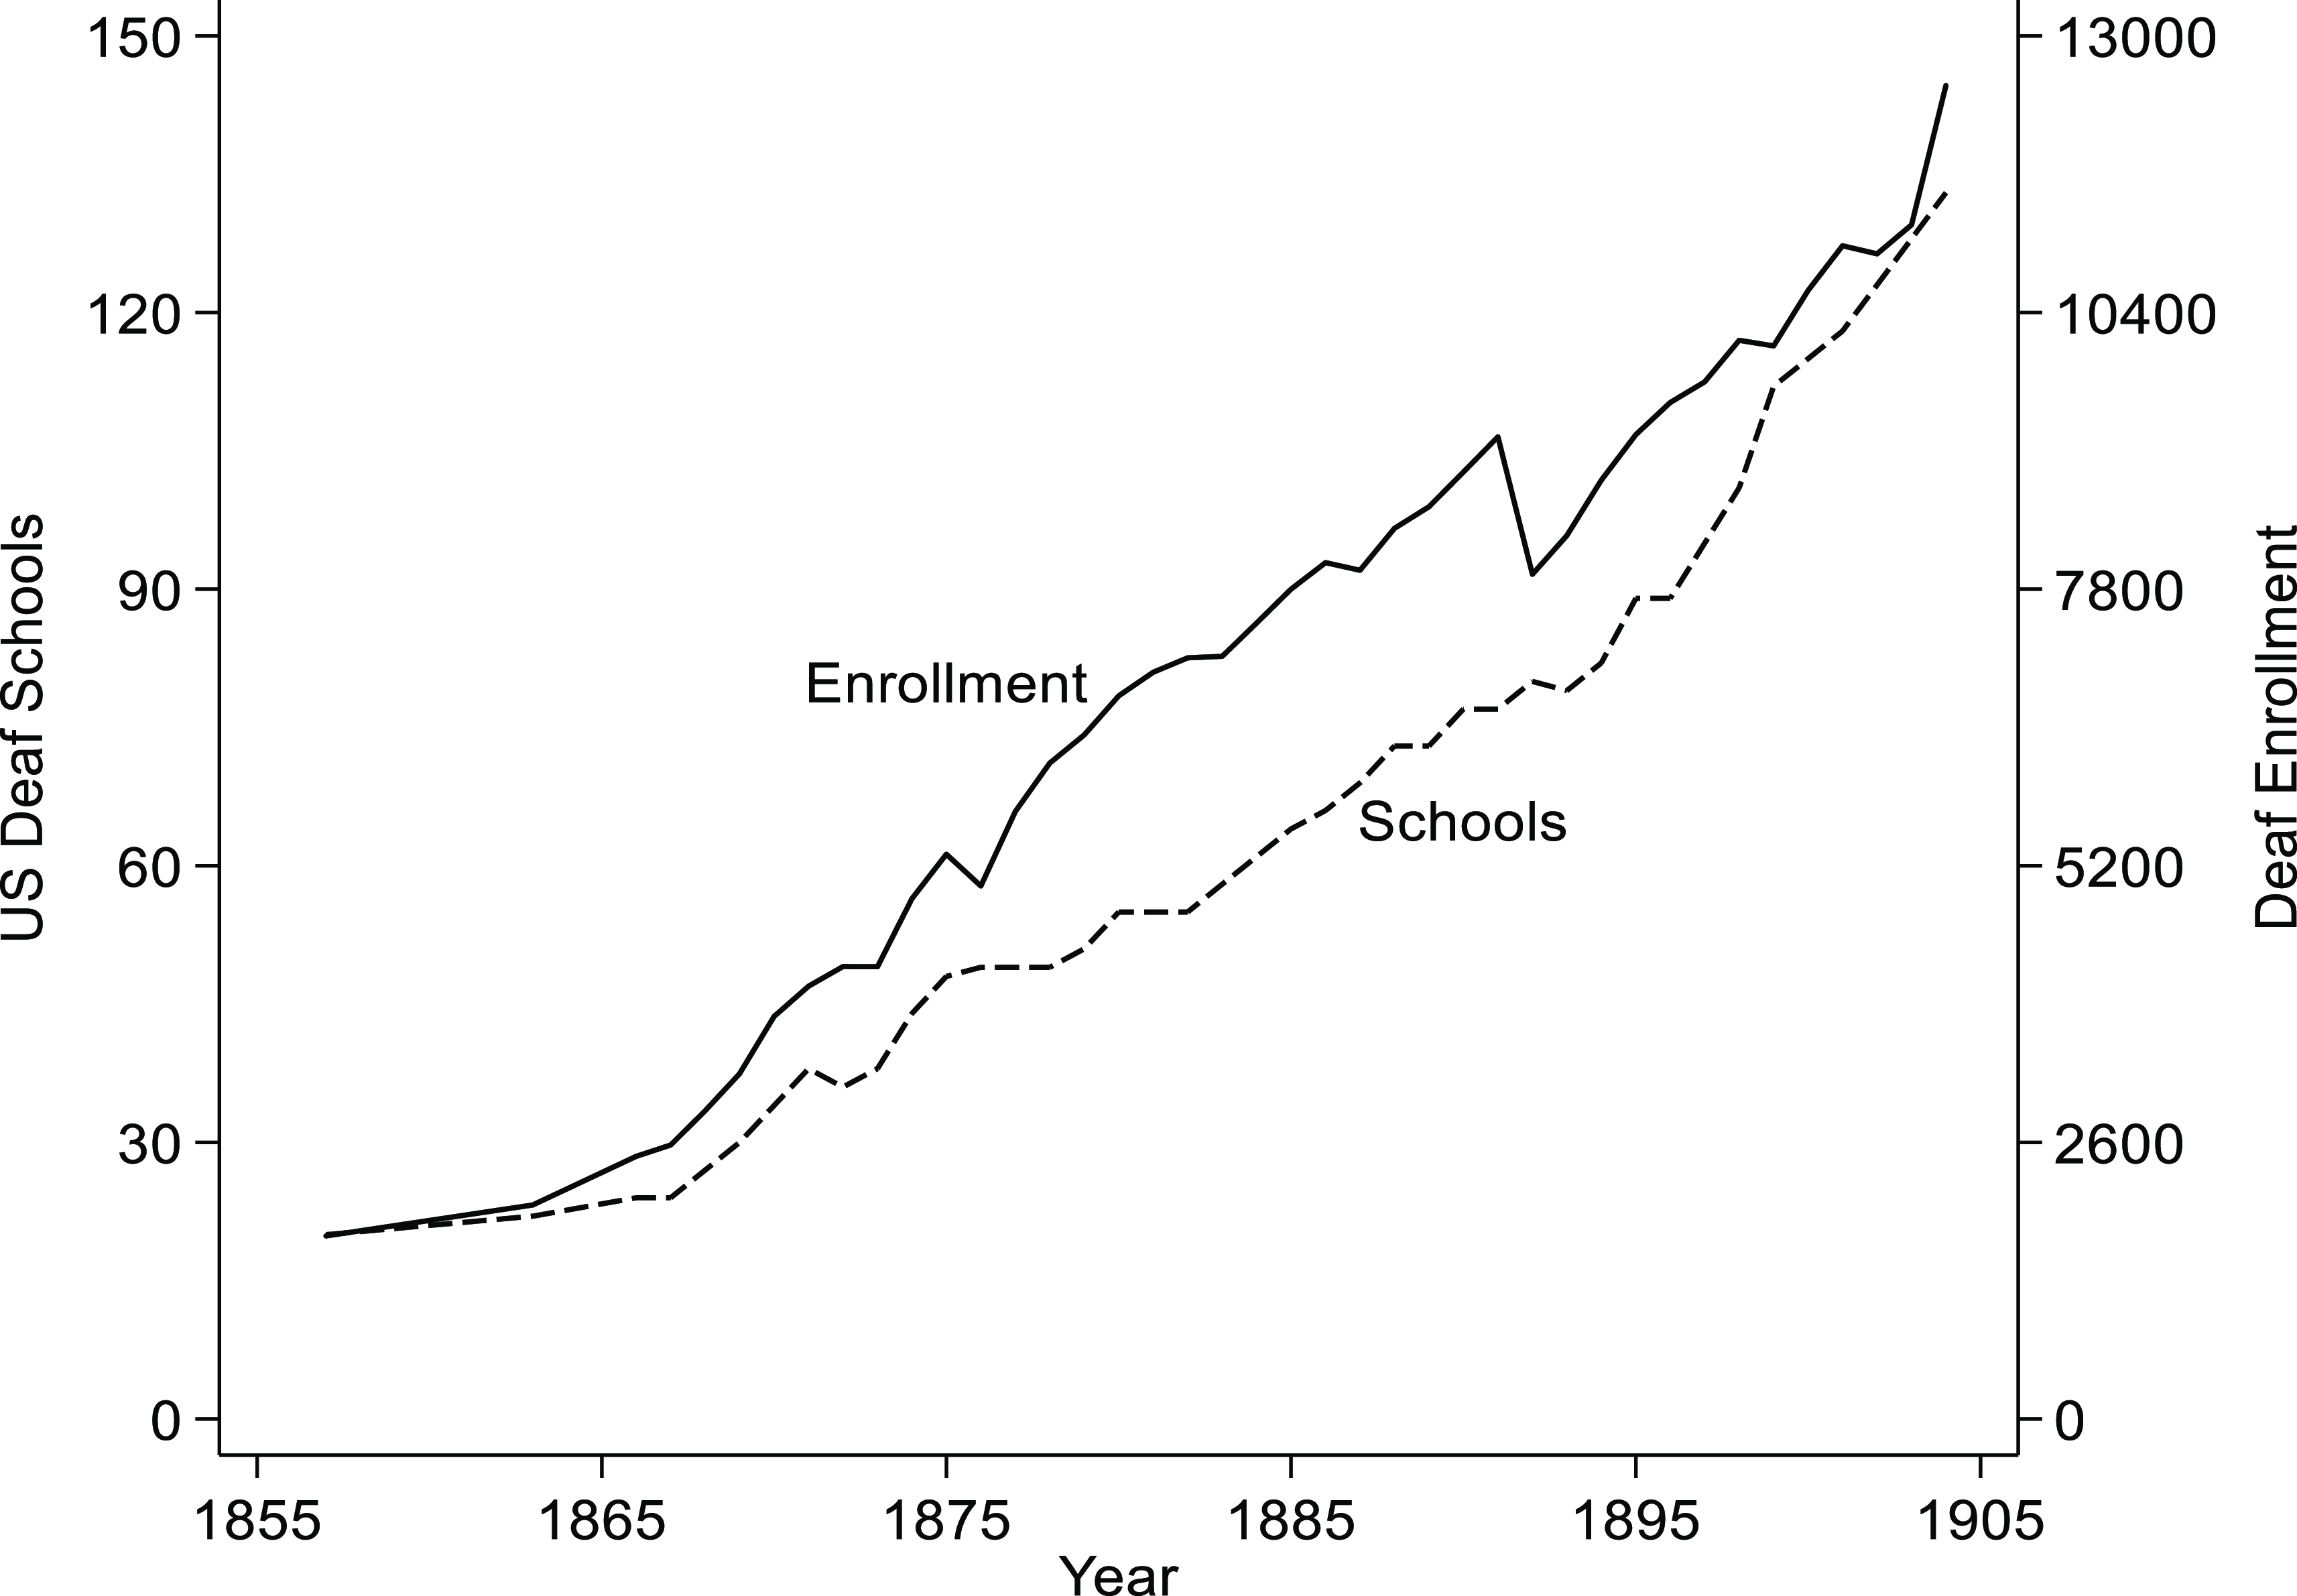
Following the American School’s founding, a proliferation of schools for the deaf helped to standardize what is now American Sign Language. As the century progressed, day-schools and residential schools for the deaf expanded in number and almost all were connected to the American School.Footnote 5 State governments quickly began to allocate funds for deaf education – decades prior to general compulsory schooling laws. By 1850, nearly every state between New York, Illinois, and Georgia provided or funded a residential school for the deaf and sign language was the primary means of instruction (Hill and Brown Reference Hill and Brown1918). By the end of the century almost all states funded schools for the deaf or had deaf education provisions in their constitutions such that the 1890 census counted 42 percent of deaf white people younger than 20 years of age attending school (Billings Reference Billings1894; Edward Allen Fay Reference Fay1893, 1: 102). By 1893 there were 61 public and 18 private schools for the deaf, and an additional 36 schools that had operated in the US before closing (Fay Reference Fay1893: ix). Figure 1 plots the total enrollment at deaf schools in the latter part of the nineteenth century (Bell Reference Bell1906: 86).
US Schools for the deaf and their deaf enrollment.
Source: Bell (Reference Bell1906; Public Domain).

Schools employing the oral method of instruction became increasingly popular approaching the turn of the century. The proportion of students taught audible speech increased from 27.4 percent in 1884 to 67.2 percent in 1904. Similarly, students who were chiefly or exclusively taught by the oral method increased from 19.9 percent in 1884 to 48.3 percent in 1904 (Bell Reference Bell1906). Though the efficacy of learning to communicate by the oral method was generally regarded as poor, it was often desired by the hearing parents of deaf children. Such instruction often prohibited sign language, the most popular means of deaf-to-deaf in-person communication, reducing both the social and human capital of deaf students. Throughout the literature, advocates of the oral method are implicated in attempting to eliminate any social sign of deafness (Buchanan Reference Buchanan1999; Edwards Reference Edwards2012; Van Cleve Reference Van Cleve1989).
The first college for the deaf, later renamed after Thomas Gallaudet, was established in 1864 with three faculty and five students (Gallaudet Reference Gallaudet1864; Reference Gallaudet1865). Though initial enrollment was small, the school was symbolic of the intellectual potential of deaf students and educational institutions (Edwards Reference Edwards2012, 107). Enrollment grew steadily, reaching 14 faculty and 107 students by 1900 (Fay Reference Fay1900). Faculty like Edward Allen Fay meticulously documented and preserved a history of deaf individuals, education, and culture before the formal field of “Deaf Studies” existed. With Thomas Gallaudet’s son, Edward, as the long-time president, the university remained a stalwart of the manual method, preserving seamless communication and fostering social cohesion within deaf society (Gallaudet Reference Gallaudet1900).
Many primary schools for the deaf included vocational components. Obtaining a skill improved employment prospects because it both improved human capital and guided students toward productive activities that could be more insulated from animus discrimination.Footnote 6 The motivations are illustrated by an opinion piece in The Silent Worker, a newspaper for the deaf: “A deaf-mute has to run the race of life under a heavy handicap, and he cannot afford to load himself with any extra weight … Again, if you are looking for a place, you will find that many people do not want to hire a deaf person” (The Silent Worker 1888). Having economically valuable skills increased the opportunity cost of animus discrimination from those who would otherwise exercise it.
On the surface, white collar and vocational training at schools for the deaf was effective. An 1886 survey of graduates from the American School includes a list of occupations. Besides farming, the most popular occupations for men were factory operative, mill operative, mechanic, shoemaker, carpenter, and teacher. The most popular occupations for women were mill operative, teacher, and seamstress (Fay Reference Fay1893: 17). Judging by the complete list, most occupations were types of manufacturers or clerks. Most such occupations allowed deaf workers to participate in competitive labor markets where animus discrimination by consumers was difficult.
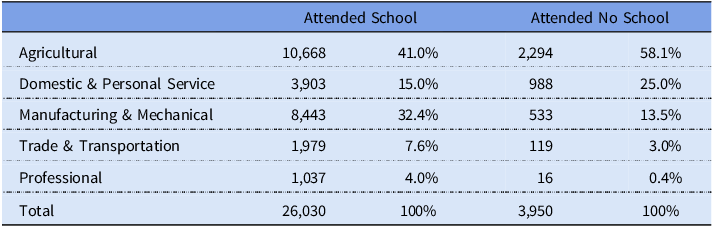
Underestimated census counts of the deaf population does not preclude compositional inferences. Table 1 displays the distribution of occupational class by whether the individual ever attended school (Bell Reference Bell1906: 147). Agricultural and personal and domestic services were all less popular among deaf individuals who had attended school while manufacturing, trade, and clerical occupations were more popular. Employment was also available through the US Civil Service Commission, established in 1883.Footnote 7
US deaf occupations by school attendance in 1900

Source: Table LXIX of the 1900 Census Special Report for The Blind and Deaf (Public Domain).
Note: The type of school was unstated among a third of respondents.
The modern reader may wonder whether deaf people faced particular legal barriers or exceptions that would have hindered their economic progress apart from their human capital composition. The best historical and legal account is provided by Harry Best (Best Reference Best1914: 50). Few states had legislation concerning deaf people and the less savory laws were archaic by the mid-nineteenth century. Overall, laws were often selectively and prudentially enforced for the benefit of deaf individuals. Legislation regarding wills or estates made allowance for written rather than verbal utterance by deaf persons. Other legislation addressed abuses such as when young deaf individuals might qualify for guardians, when interpreters were necessary, or when injury against deaf individuals carried greater penalties. Rarely, deaf adults were excused from paying poll or property taxes. Best also outlines that courts were deferential to the competency of deaf people and that most special mentions regarded the mental capacity of particular deaf individuals: “The deaf […] were generally held fully answerable for crimes” and “held capable of entering into all contractual relations” (Best Reference Best1914: 53). Overall, legal differentiation faced by deaf people was rare and not exceptional beyond practicalities of legal participation.
Best also documents that deaf civic organizations strove to avoid legislated privileges. For example, several deaf people in Austin, Texas petitioned the state legislature to remove the exemption from the poll tax for deaf adults (Fay Reference Fay1905). Further, the 9th congress of the National Association of the Deaf resolved that “stringent laws should be enacted making it a penal offense to ask pecuniary aid on account of deafness or on pretense of being ‘deaf and dumb’” (Fay Reference Fay1915). Eleemosynary programs administered or funded by the state gave no special provision to deafness except to the extent that economies of scale were beneficial. For example, some states cared for elderly and infirm people who had no family. If the number of such deaf people was adequate, then they would be cared for under a single roof. That they received aid was unrelated to their deafness (Best Reference Best1914: 61).
In short, the US deaf population began the nineteenth century as geographically and socially isolated, depended on family support, received little or no education, and were largely unable to communicate with strangers (Edwards Reference Edwards2012: 64). In economic terms, their possible choice set was highly constrained by the unavailability of schools and common language. By the end of the century, they had curated and spread a new language, attended schools, entered professions, maintained newspapers and civic organizations, and led lives of practical independence. Not merely beneficiaries, an entire swath of humanity made new contributions to the fruits of civilization and gained, in large part, its commensurate dignity in the eyes of society – though stories of social discrimination were common. While the quick advancement was nothing short of miraculous, most accounts that sketch the transformation lack the clear definition of systematic statistical illustration.
Deaf and hearing differences
The primary difference between deaf and hearing people is one of initial endowment: deaf people can hear partially or not at all. We model deafness as an input in the production functions for human capital and outputFootnote 8 . Following Romer (Reference Romer1990), each person has an endowment that can be divided into two categories that are relevant for individual productivity and wealth maximization: physical skills such as eye-hand coordination, strength, and hearing sensitivity, and educational skills that are acquired in primary and secondary school. Both interact with the endowments of health, nutrition, and childhood home environment. We model deafness discretely as a binary indicator. While deafness does not include a cognitive disability, the inability to hear may hinder the accumulation of educational skills despite the use of ASL or the accumulation of work experience if sound is an important characteristic of a workplace.
Individuals can invest in additional physical skills by gaining work experience, which is partially determined by the home environment and other endowments. More years of employment imply greater investment in accumulating work experience. Similarly, more years of school attendance imply greater educational human capital investment. Deafness is modeled as part of the endowment for both forms of human capital production. This framework permits deafness to affect the decision to acquire an additional year of work experience or school attendance. For greater flexibility, human capital due to work experience and educational experience comprise separate inputs of the output production function (Lockheed et al. Reference Lockheed, Jamison and Lau1980).
For simplicity, we divide a person’s life into a human capital investment period and the subsequent productive period. During the human capital investment period, individuals face a trade-off between time spent on leisure, physical skill investment, and educational investment. We consider the first 30 years of life as the human capital investment period and the older ages as the production period. This permits a liberal span for human capital investment, though our results do not hinge on the age of 30 in particular. A production function can illustrate the marginal product of work, work experience, years of education, and deafness. We model employment separately from work experience in order to differentiate the decision to work now versus the forward-looking decision to have worked some amount by the time of output production.
The production function provides a logical structure by which to interpret evidence. First, less educational and work experience is associated with less economic achievement. Second, whether one is deaf can affect the return on additional human capital investment and the productivity of labor. That is, investing in education and work experience is a forward-looking decision. Clearly, young children attend school at the direction of their parents. However, given the higher rates of truancy, child labor, and the older age of deaf students, the decision to continue attending school or to work included a high degree of individual discretion. The existence and magnitude of any deafness effect can be described by the output difference between the average hearing and deaf person. Importantly, it is not a forgone conclusion that the effect of deafness on productivity is negative. Compensatory sensory improvement has been documented among modern deaf individuals and may contribute to either physical or educational skills (Papagno et al. Reference Papagno, Cecchetto, Pisoni and Bolognini2016; Pimperton et al. Reference Pimperton, Ralph-Lewis and MacSweeney2017). That people may develop compensatory skills makes the net effect of deafness on human capital investment and output theoretically ambiguous.
We provide evidence that, consistent with negative impacts on productivity, deaf people invested in less human capital by attending school and working less during the early part of their lives when most human capital investments would occur. We also provide evidence that the average deaf person was economically worse off than their hearing counterparts later in life, implying that they had not invested in or otherwise developed unobserved human capital that entirely offset the impact that the lack of hearing had on productivity.
The technological contingency of human capital is importantly worth noting. The skills that qualify as human capital and an augmentation to production are not universal. Rather, human capital is characterized by the impact on an output production function for the task at hand given the methods and available capital. Modern credential inflation and the sheepskin effect make clear that additional years of educational attainment do not always reflect additional human capital accumulation (Rodríguez and Muro Reference Rodríguez and Muro2015; van de Werfhorst and Andersen Reference van de Werfhorst and Andersen2005). We take care to avoid the hubris of assuming which activities constitute human capital investment. In that vein, the relevance of being deaf for human capital accumulation is not constant. Technological and social differences across time may interact with deafness differently in degree and nature. For example, greater literacy and cheaper writing supplies lowered the cost of communication between hearing and deaf co-workers. The ability to quickly communicate with a notepad and pencil reduced the language barrier that existed between them. Therefore, we keep the analysis of deaf individuals narrowly focused on the sample period. Regardless of the narrow conclusions, the broader implication is that human capital accumulation depends on the underlying matrix of institutions and technology that help to reveal and solicit productive investments.
Data summary
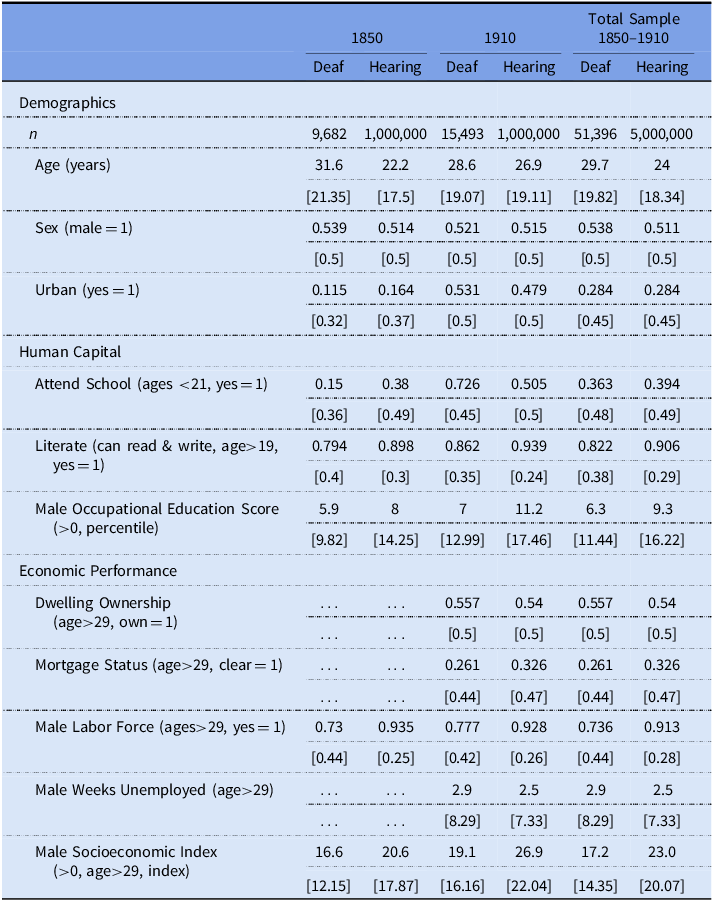
All data are from the full-count cross-sectional IPUMS samples for 1850, 1860, 1870, and 1910; and the 10 percent sample for 1880. We use the same data for hearing individuals, except that we cap random samples at one million individuals per census year. We classify as deaf those who could neither hear nor speak as well as those who merely could not hear. We also omit from our sample all persons enumerated by the census as blind, insane, maimed, or idiotic.Footnote 9 Although our primary analysis narrowly focuses on the hearing and deaf populations that the US Census identified as white, results for the black deaf population are similar when sample sizes permit (see online supplementary material). Means and standard deviations for the deaf and hearing samples are in Table 2.
Means and Standard Deviations for the US deaf and hearing

Source: Data for deaf sample is from the full-count 1850, 1860, 1870, and 1910 IPUMS samples and the 1880 10 percent sample. Data for the hearing is a one million-person random sample.
Note: Occupational data excludes females.
Unfortunately, most US Census data for 1890 is missing, deafness was not documented on the primary schedule of the 1900 general census, and the IPUMS deafness data for 1880 is only partial. At the time of this analysis, linking individuals across the entire sample period would result in highly incomplete panel data. However, the census data are constantly improving and will soon permit such analysis.Footnote 10
Both false positive and false negative deaf designations serve to underestimate the magnitude of deaf-hearing differences that we illustrate (Hill and Brown Reference Hill and Brown1918). The 1860 census notes that there were consistently greater numbers of congenitally deaf adolescents than either younger or older cohorts (US Census Bureau 1864). Deaf adults would sometimes intentionally misreport their hearing status due to stigma or because they did not trust census enumerators. Similarly, parents would often refuse to report small children as deaf in the hope that another affliction could be identified and resolved. A sizeable number of children were only legally designated as deaf after they began to attend a school for the deaf that reported them as such. Finally, some people had hearing loss as a result of aging, sickness, or an accident that occurred later in life after some or all human capital investments had been made (US Census Bureau 1882). All said, while it is thought that the deaf designations were substantially undercounted prior to 1880, compositional deviations from reality serve to underestimate differences between the two groups.
Was deafness exogenous to other determinants of human capital endowments? It is easy to imagine that parent characteristics might cause deafness in utero or in early childhood. Some parents may have been exposed to more sickness, worked in occupations that risked poisoning, lived in unsafe home environments, or even carried genetic markers that could result in deafness of their child (Groce Reference Groce1985). However, the list of household head characteristics that were correlated with having a deaf child is short (results omitted for brevity). The presence of a deaf rather than a hearing head of household was the largest predictor of having at least one deaf child at a 3.8 percent greater incidence. More importantly, neither age, sex, literacy, nor any other occupation-based measure of earnings, education, or status significantly predict whether a deaf child would live in a householdFootnote 11 . The only other statistically significant predictor of having at least one deaf child was being employed (+0.1 percent), which is possibly due to unemployed parents sending their deaf children to live with other family or elsewhere.Footnote 12 Deafness was largely exogenous to observable decisions made by parents.
A final consideration for measuring the differences among the deaf and hearing populations concerns our use of occupational scores as measures of economic and social achievement. As of 1970, occupational variation accounted for only one-third of income variation among individuals, resulting in underestimated earnings gaps when using occupation-based income scores (Abramitzky et al. Reference Abramitzky, Boustan and Eriksson2014). In addition, changes over time in the income distribution of occupations can result in misidentifying earnings convergence or divergence if patterns of deaf and hearing occupation changes differ (Inwood et al. Reference Inwood, Minns and Summerfield2019). Despite these issues, occupational scores are used widely in the economics and sociology literatures to measure relative income differences (Feigenbaum Reference Feigenbaum2015). However, they may be less dependable among identifiable demographic subgroups (Saavedra and Twinam Reference Saavedra and Twinam2020). Regardless, deafness appears to have been uncorrelated with other human capital investment determinants, and the census sampling biases and statistical properties of occupational scores likely serve to underestimate the ex-post statistical differences between the hearing and the deaf populations.
Demography
Deaf-hearing demographic differences reflect the sense of historical writers. Deaf people were male in a greater proportion, older, more often never married, had fewer children, and were less often the head of a household. Urban residents were likely to be undercounted generally, implying a worse survey of deaf individuals whose proportion was more urban than the hearing as of 1880 (King and Magnuson Reference King and Magnuson1995).Footnote 13 This is, in part, due to inaccurate self-reporting, best-guesses by enumerators, undercounting people who lived at their place of employment, and undercounting boarded persons. Being a small proportion of individuals, it is difficult to say how representative the census data are for the deaf population.
Educational skills
While years of schooling would be a useful metric for human capital investment, such data are not available for the time period. Whether adolescents attended school or worked during the year prior to each census is available, however. Despite the thumb of state subsidies to schools for the deaf weighing on the scale, deaf people attended school at lower rates than did hearing people until the twentieth century. Fewer years in school and lower economic achievement imply that deaf people had less educational human capital than did hearing people even after human capital investments had been made. Though a low bar for human capital acquisition, a lower proportion of deaf adults were literate.
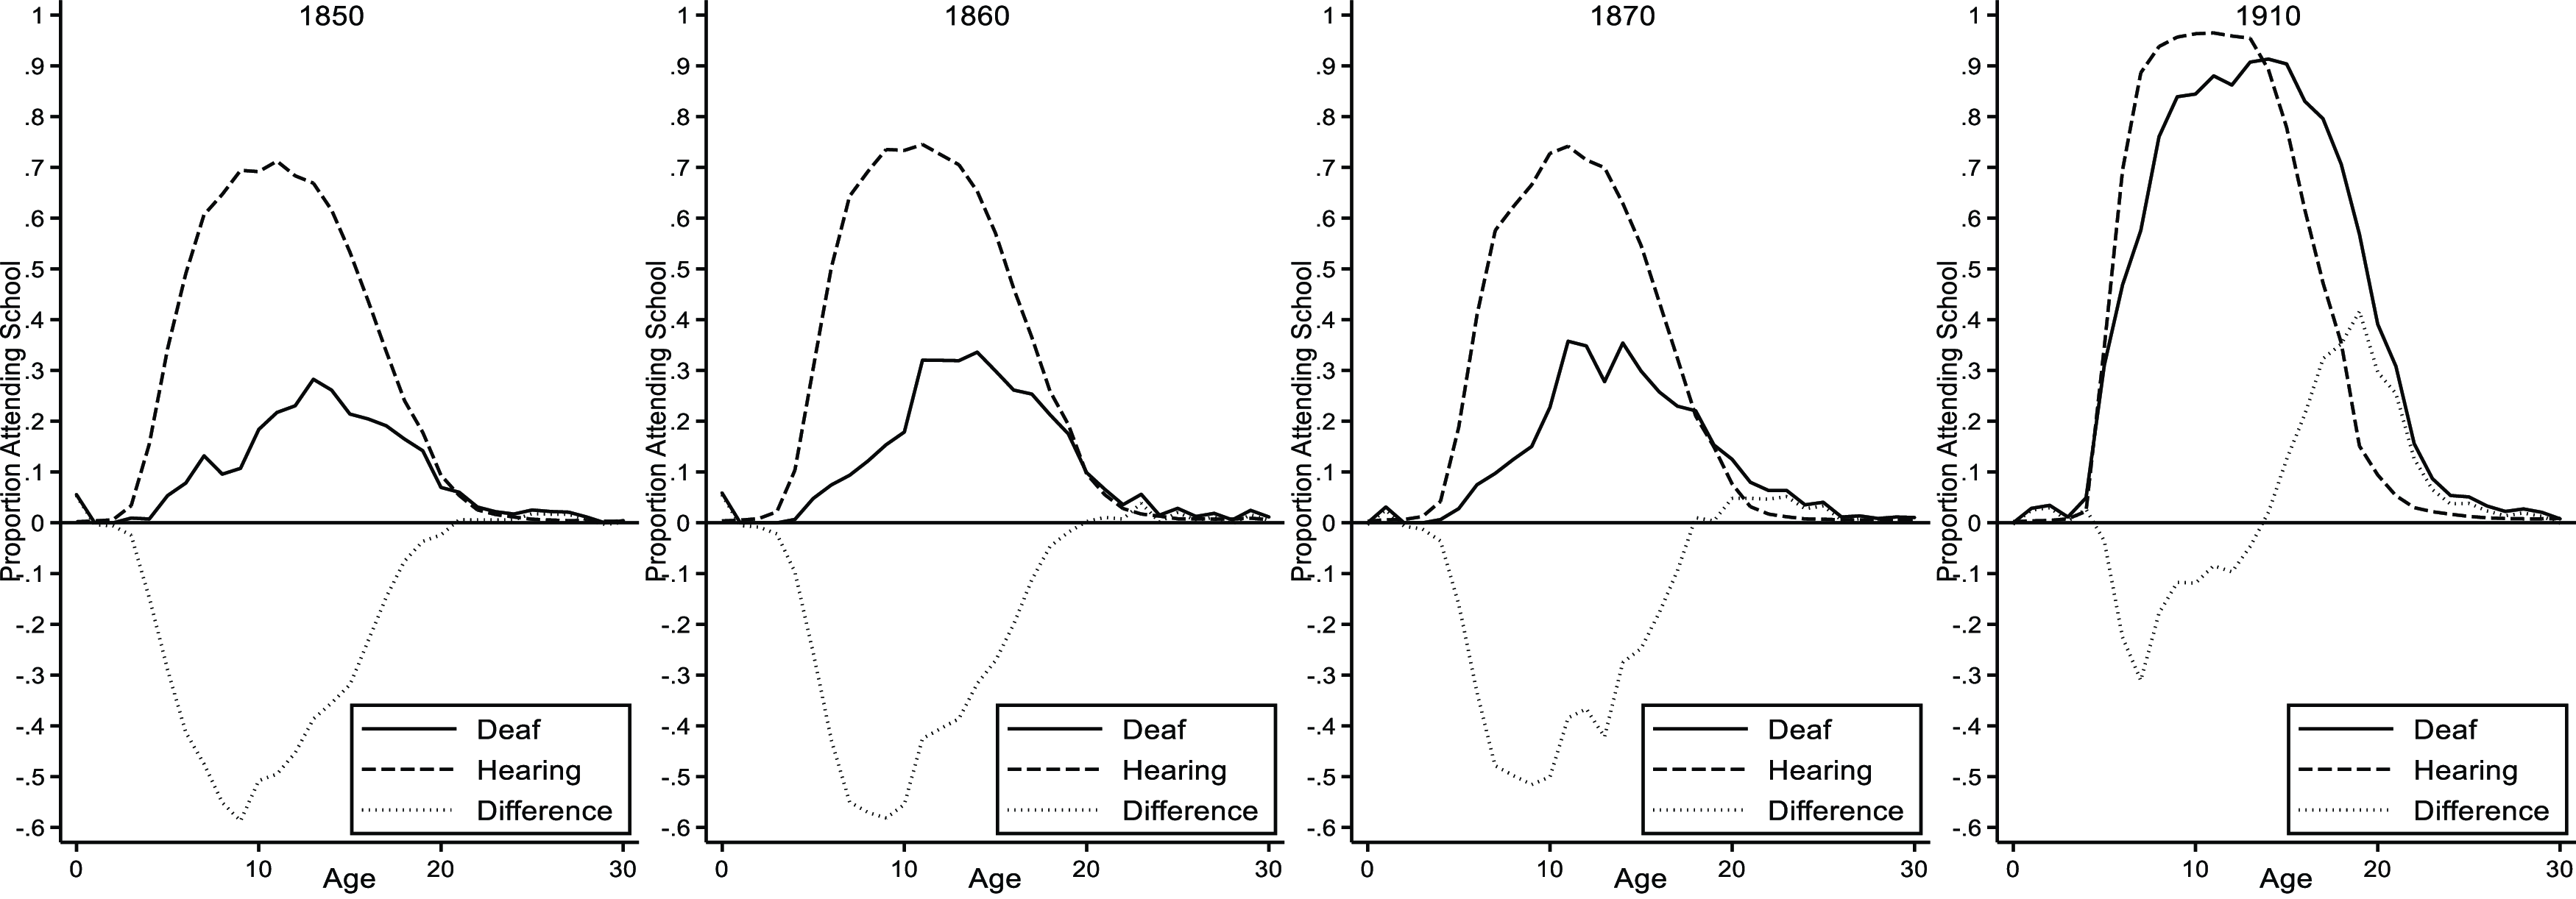
State funding of schools for the deaf increased across the US dramatically over the course of the nineteenth century – well prior to universal state compulsory attendance laws. However, the age of attendance for deaf children was not standardized. For example, the American School accepted students aged 10–30 until 1842. Without the local norms of a dense deaf population, parents of deaf children often discovered that schools for the deaf existed after their child met the minimum age requirement. Another important cause for lower deaf attendance at young ages was that schools for the deaf were often residential schools in which children were separated from their families during the weeks of instruction. Small children would have had less “capacity” to care for themselves, increasing the age of initial attendance (Best Reference Best1914: 162). This last explanation, however, is at odds with the falling age of entry over the course of the nineteenth century (Jones Reference Jones1918). Attending school while an adult over the age of 20 was always more common for the deaf than for the hearing population, both as a proportion of students and as a proportion of persons. Importantly, while children may have attended school at the direction of their parents, adults were free to choose whether to remain enrolled, allowing us to interpret their decision as revealing the relative value of their alternatives. Figure 2 illustrates the proportion of persons aged 30 and younger who attended school by age and deafness in the year prior to the 1850, 1860, 1870, and 1910 censuses. Although the age distributions among the deaf and hearing populations became more similar over time, there is a persistent pattern of relatively few deaf students under the age of 10 and relatively more deaf students over the age of 15. This pattern persists throughout the sample period and suggests that deaf students attempted to compensate for the missed years of attendance that resulted from starting school at an older age.
US School attendance by hearing status.
Source: Data for the deaf is from the full-count IPUMS sample. Data for the hearing is a 1 million-person random sample from the full-count IPUMS sample.

Figure 2 carries an econometric implication. The patterns of attendance imply that simple comparisons among deaf and hearing by age are not appropriate. Regression analysis attempting to estimate the effect of deafness on school attendance merely by using a deaf indicator variable would provide a biased coefficient depending on the distribution of sample of ages. Merely controlling for age is insufficient because the attendance gap was neither uniform nor of the same sign throughout adolescence. Therefore, any deafness measure must interact with age in order to account for the different timings of educational investment. The implications reach beyond school attendance. Employment among young deaf adults was lower due in part to still elevated school attendance rates. By completing school earlier, hearing adolescents were able to devote more time to work experience as teenagers and young adults, ultimately accruing more physical human capital. Modeling employment and productivity using simple deaf and age indicators would produce biased coefficients due to lifecycle timing differences. Deafness and age must be interacted in order to detect the effects on attendance and employment conditional on age.
If the primary human capital difference was merely due to timing, then we should observe comparable measures of human capital after the investment period is concluded. School attendance among both the hearing and deaf populations was negligible by the age of 30 and employment rates reached levels comparable to those occurring through the prime working ages. We split the data into two age ranges, younger and older than age 30, to reflect the human capital investment period and the subsequent period during which the returns to human capital investment were enjoyed.
Work experience
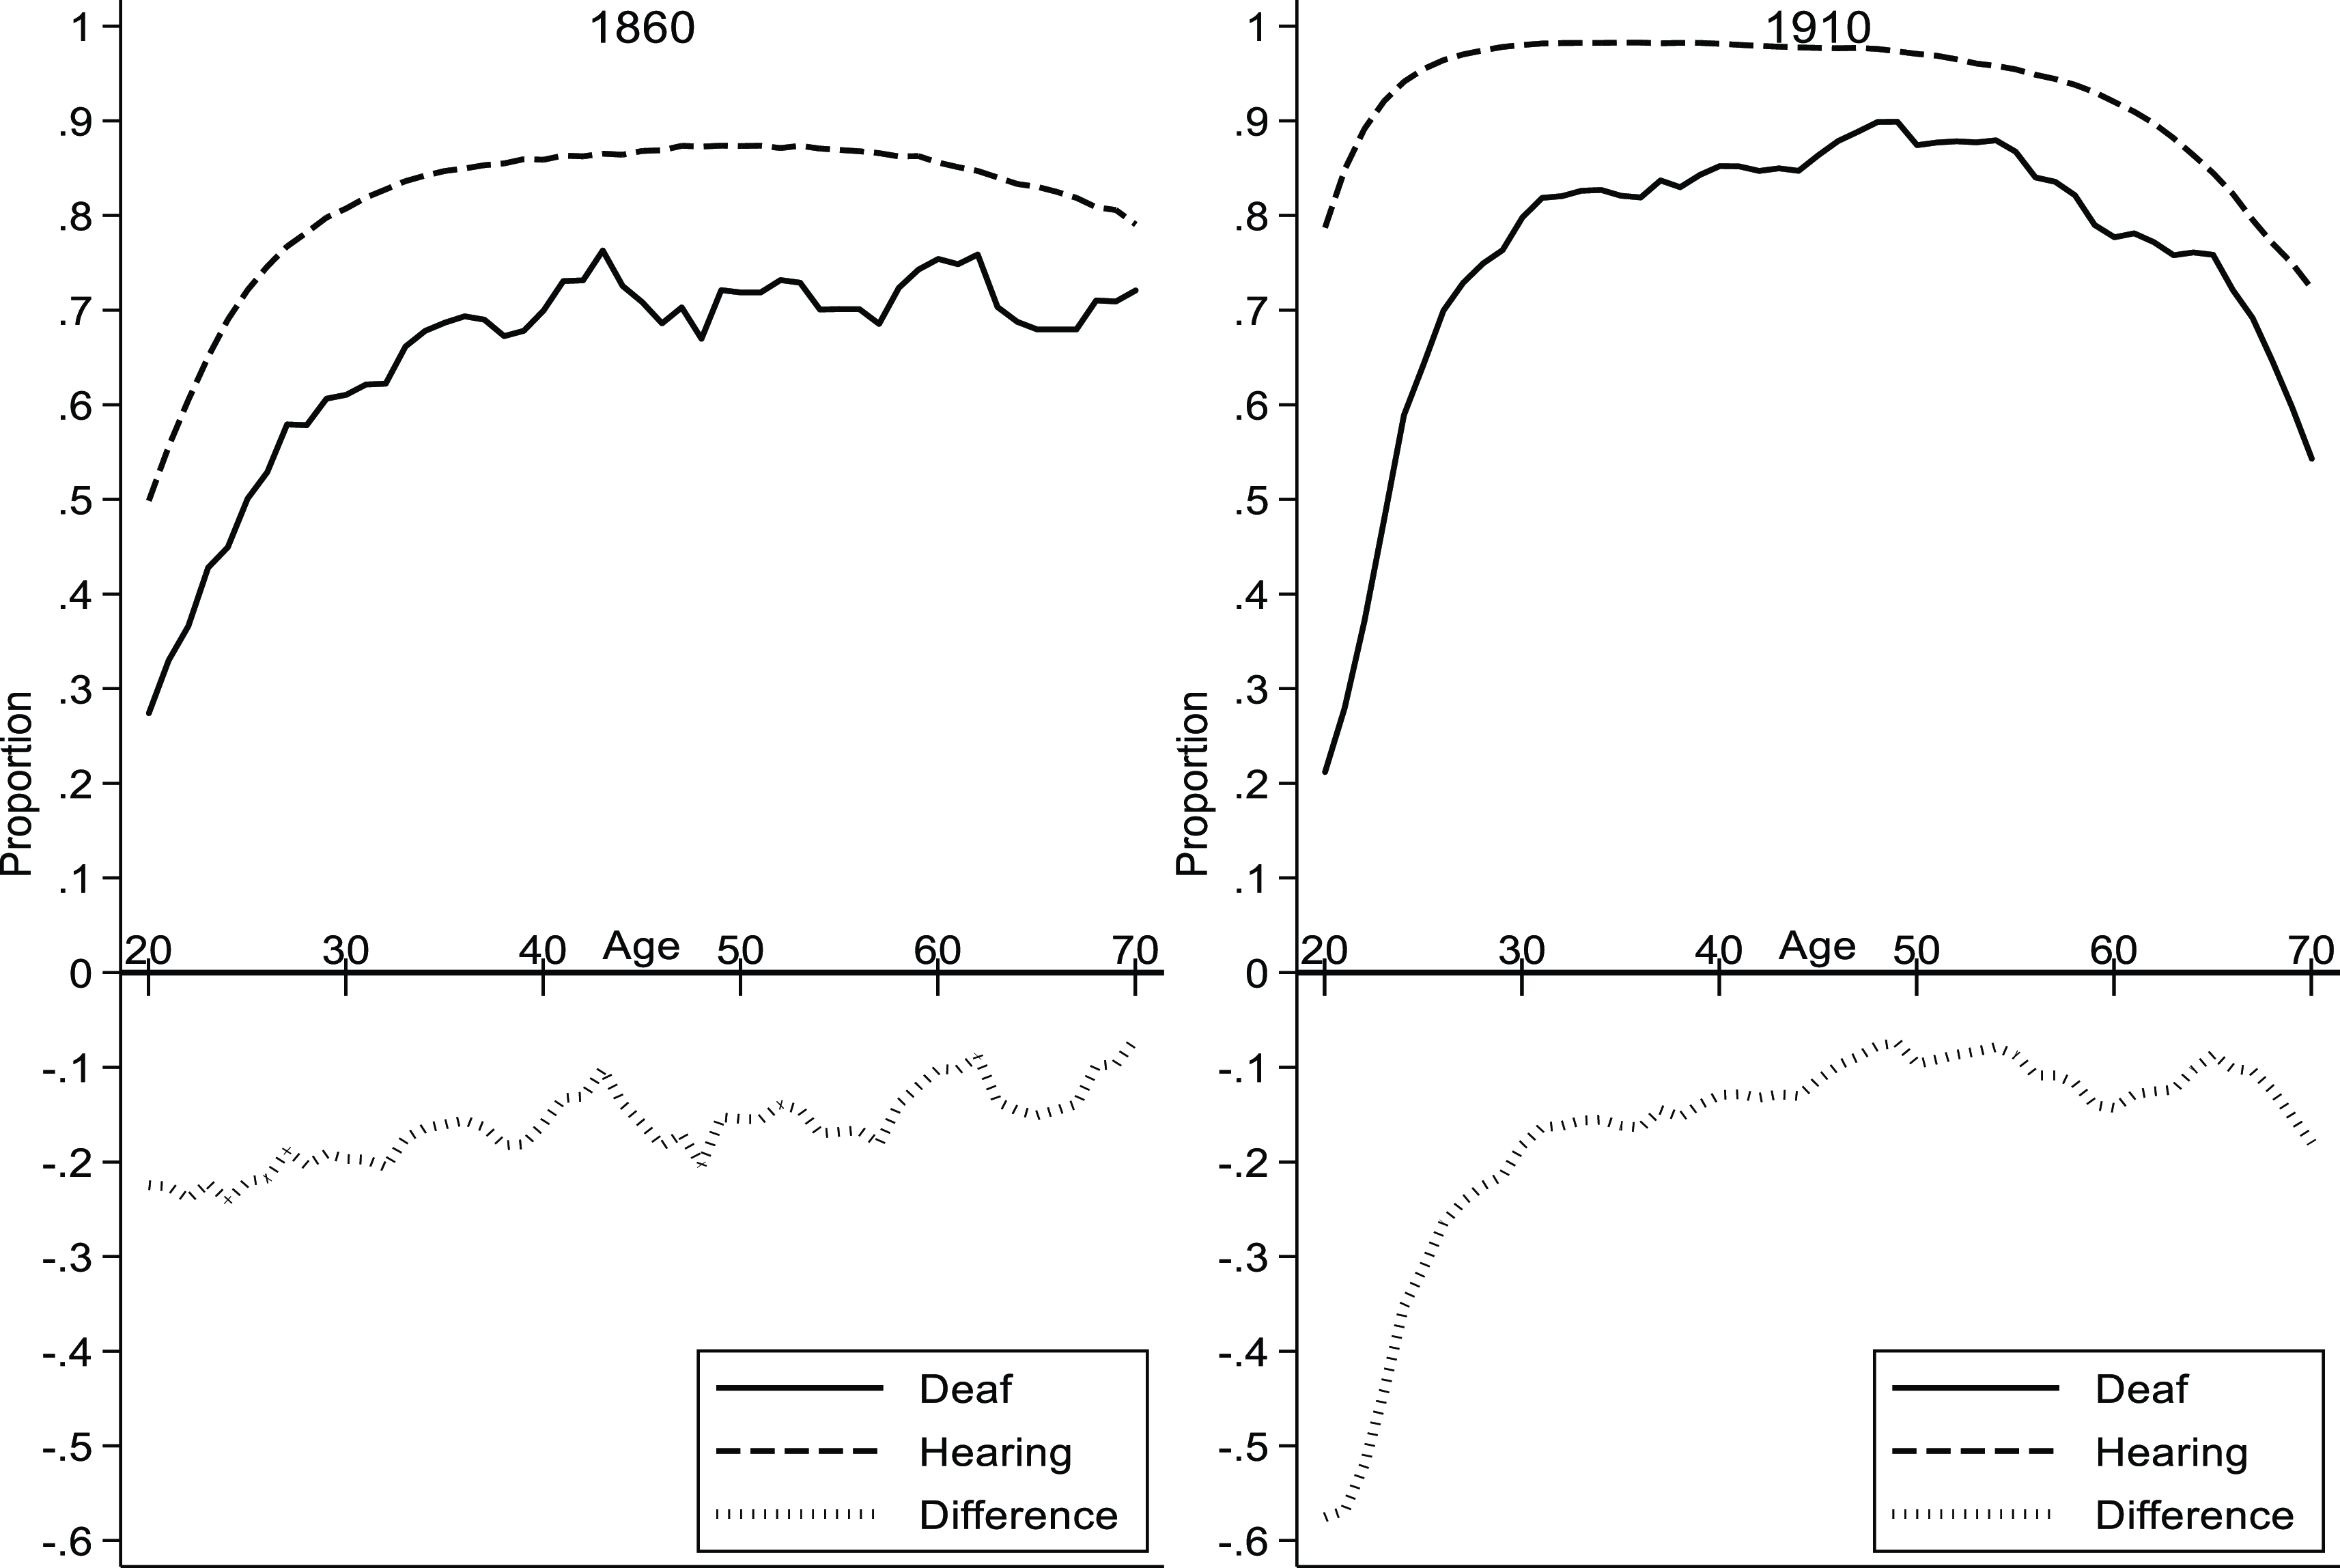
Despite deaf children attending school at lower rates than their hearing counterparts in the nineteenth century, they were not disproportionally investing in human capital alternatives. Lacking educational opportunities or an awareness of schools for the deaf, the opportunity cost of additional work experience was lower. Figure 3 illustrates that deaf adolescents and young adult males were not investing in observable work experience prior to the spread of schools for the deaf. The rate of labor force participation, meaning “reporting any gainful occupation” (Ruggles et al. Reference Ruggles, Flood, Foster, Goeken, Pacas, Schouweiler and Sobek2021), among deaf persons was lower than that of hearing persons for every year of the sample at all ages less than 30. While dependable labor force participation is not available below the age of 16, extrapolation is reasonable given all other evidence. Especially at young ages, many deaf children would likely have been able to communicate with a smaller set of people, mostly family and maybe neighbors, implying a lower marginal product of impersonal labor market participation. Likely, a greater proportion of deaf children engaged in unobserved domestic work, though this work experience would have yielded returns commensurate with having few alternatives.
Proportion of US male gainful employment by age and hearing status.
Source: Data for the deaf sample are from the full-count IPUMS samples. Data for the hearing sample are a 1 million-person random sample from the full-count IPUMS sample.
Note: Displayed is the 5-year trailing average for males.

Students at a school for the deaf quickly learned to communicate with instructors and peers, which would less likely be the case in a workplace with a lower concentration of deaf people. By 1910, opportunities for school attendance improved among young deaf people such that the employment gap widened, though by more than the increase in school attendance. Conditional on the institutions and technology at the time, young deaf people likely had a comparative advantage in acquiring educational human capital rather than physical human capital. Remaining in school during later adolescence helps to explain the widening deaf-hearing employment gap among the young. We discuss in the next section how it might also explain the widening gap among those older than 30.
Unfortunately, the censuses did not include the number of years of schooling completed until 1940, after our sample period. There were periodic special reports about the deaf population, however, the data are not yet digitized. Although compulsory school attendance became popular among states in the latter half of the nineteenth century, they were difficult to enforce and truancy was widespread (Landes and Solmon Reference Landes and Solmon1972). While it is true that states with compulsory attendance legislation enjoyed higher attendance rates among children, enforcement was not uniform among the hearing population, much less the deaf population. In fact, enforcement typically did not necessitate more than verbal persuasion by truancy officers because parents were broadly disposed to sending their children to school (Bureau of Education 1891: 510). In regard to deaf children, superintendents generally encouraged parents to send their deaf children to school given that one was available. The contrast between written law and informal implementation resulted in an incomplete record of truancy enforcement details (Bureau of Education 1891: 517).Footnote
14
A crude national approximation of education years, equation (1),
 $\overline {{S_t}} $
is the summed proportion of individuals attending school by age and year through age 30.Footnote
15
We use the same method to estimate average years of work experience
 $\overline {{Z_t}} $
by age 30.
 $$Average\;Years\;of\;Attendanc{e_t} = \overline {{S_t}} = \sum _{a = 0}^{30} \sum_{i = 1}^n {{{x_{i,t}}} \over {{n_{a,t}}}}$$
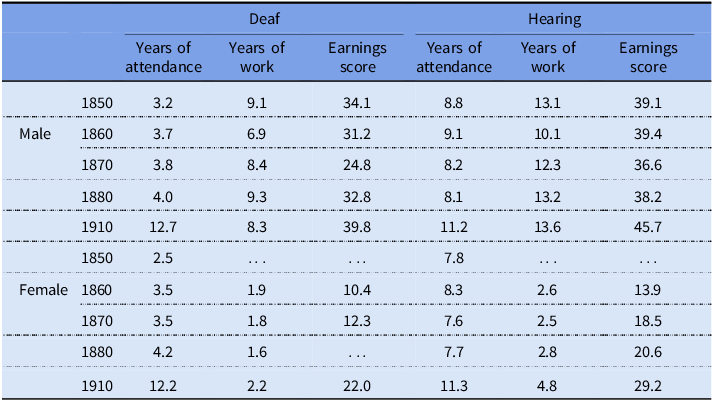
Table 3 lists the average years of schooling and work experience by age 30, and the IPUMS average occupational earnings score for ages 30 through 35 by year, hearing status, and sex.Footnote 16 The average human capital production bundles are consistent with a stable or expanding human capital production possibility frontier with each passing decade. The average hearing person attended more years of schooling than did the average deaf person until the twentieth century when deaf children began attending school at younger ages. Lower attendance rates in earlier years may have been due to lack of access or sufficient state educational resources.Footnote 17 Years of work experience follows a similar pattern, except that deaf adults did not achieve parity with their hearing counterparts by the end of the sample period. Consistent with Figures 1 and 2, deaf children began attending school at much higher rates as the number of schools for the deaf more than doubled between 1890 and 1904.
Estimated US average years of schooling, work experience, and earnings percentile

Source: Data for the deaf sample are from the full-count IPUMS samples. Data for the hearing sample are a 1 million-person random sample from the full-count IPUMS sample.
Note: Estimated from equation (7). Female labor force participation was not measured in the 1850 census. Years of education are calculated from school attendance for all ages 30 and less. Years of work is calculated from labor force participation for ages 16–30. Earnings are the average earnings for ages 30 through 35 expressed as a percentile using the 1950-based occupational earnings score. The deaf female 1880 earnings score is omitted due to a small sample size.
Several patterns emerge. Cumulative human capital investment and earnings rose for all groups, though average years of investment were always lower for the deaf population. Over time, deaf people increased the share of their time spent in school. Men specifically somewhat reduced their level of work experience in absolute terms while increasing their consequent earnings.Footnote 18 The implication is that deaf students had a comparative advantage in educational human capital production, given the historical institutions and available technology, or that the community encountered at school was more valuable than the foregone work experience. That schools for the deaf typically included vocational training makes the comparative advantage less clear.
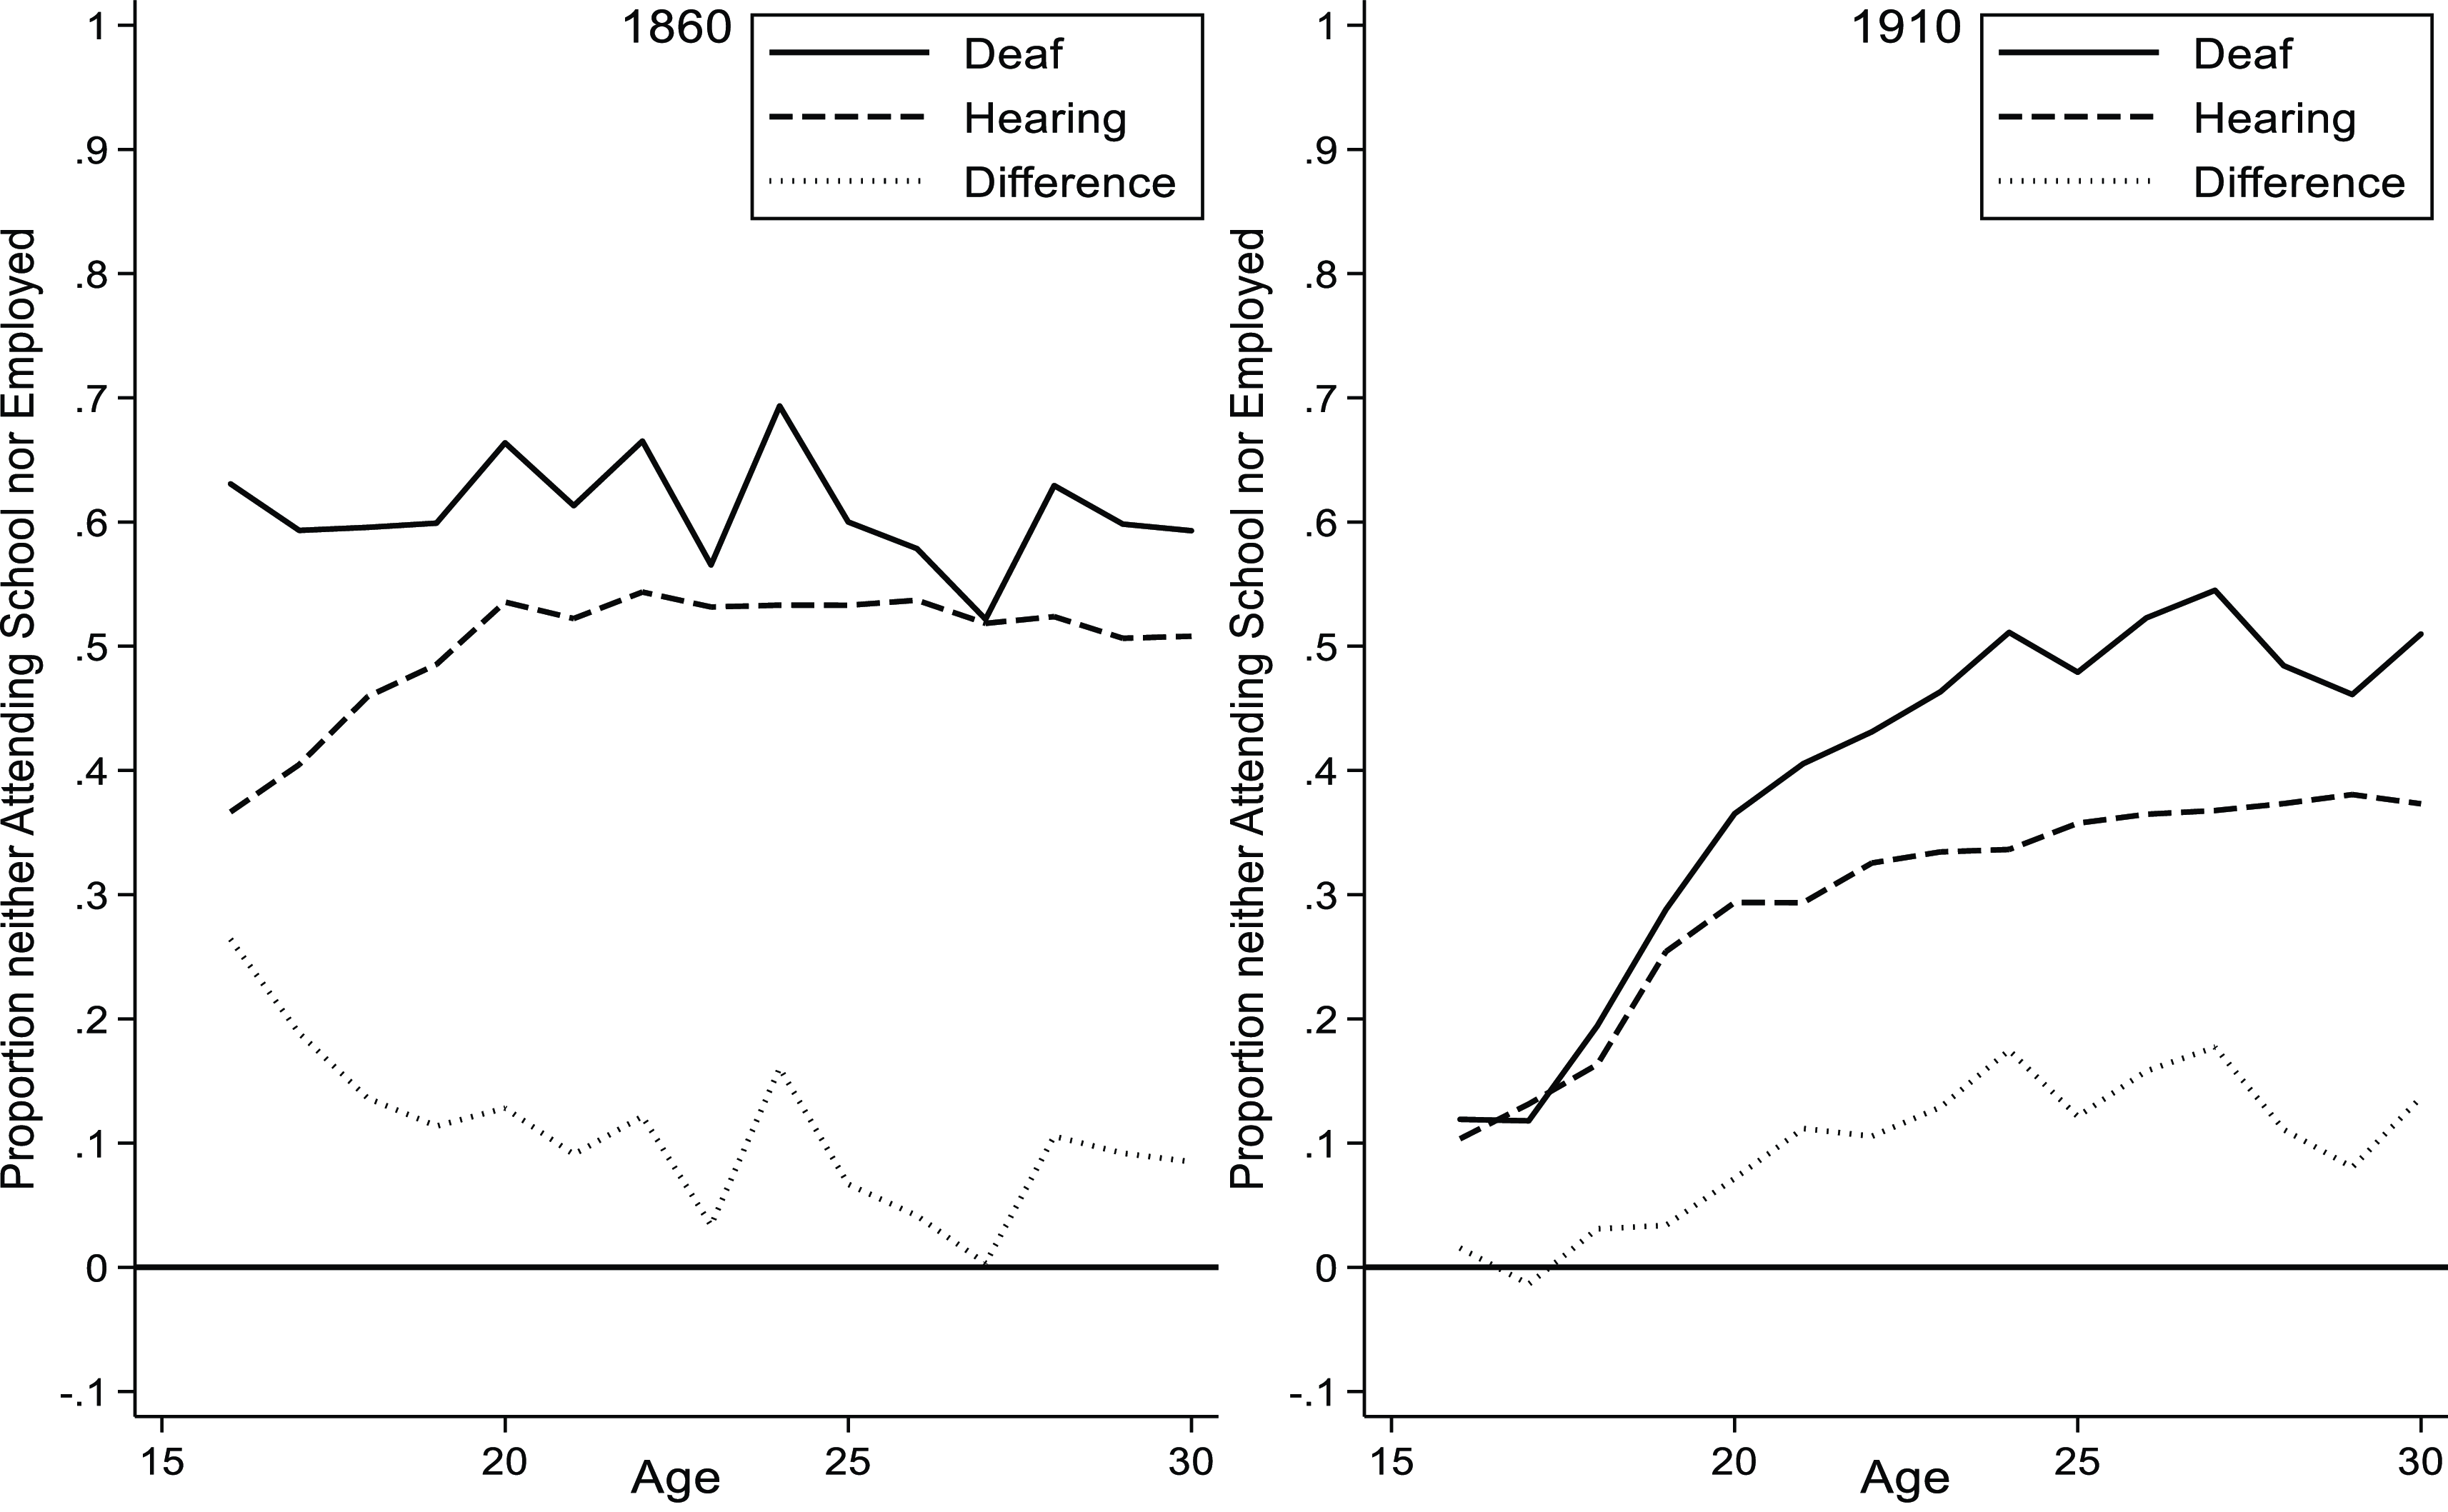
Figure 4 illustrates the proportion of deaf and hearing people ages 16–30 who neither attended school nor were gainfully employed in 1860 and 1910. Such individuals were investing in neither observable educational nor physical human capital. For lack of a better word, measured non-investment decreased over the 50-year period for both hearing and deaf populations. Wider access to schools for the deaf entirely closed the deaf-hearing attendance gap at the ages of 16 and 17 and shrank the gap for ages less than 20 by 1910. Although both deaf and hearing populations increased human capital investment, the gap between them grew at ages greater than 20 when hearing individuals began entering the labor force in greater proportion. Deaf adolescents were spending relatively more time in school by the twentieth century, but subsequent demand for their labor grew less than it did for hearing adults.
US individuals neither attending school nor working by hearing status.
Source: Data for the deaf sample are from the full-count IPUMS samples. Data for the hearing sample are a 1 million-person random sample from the full-count IPUMS sample.

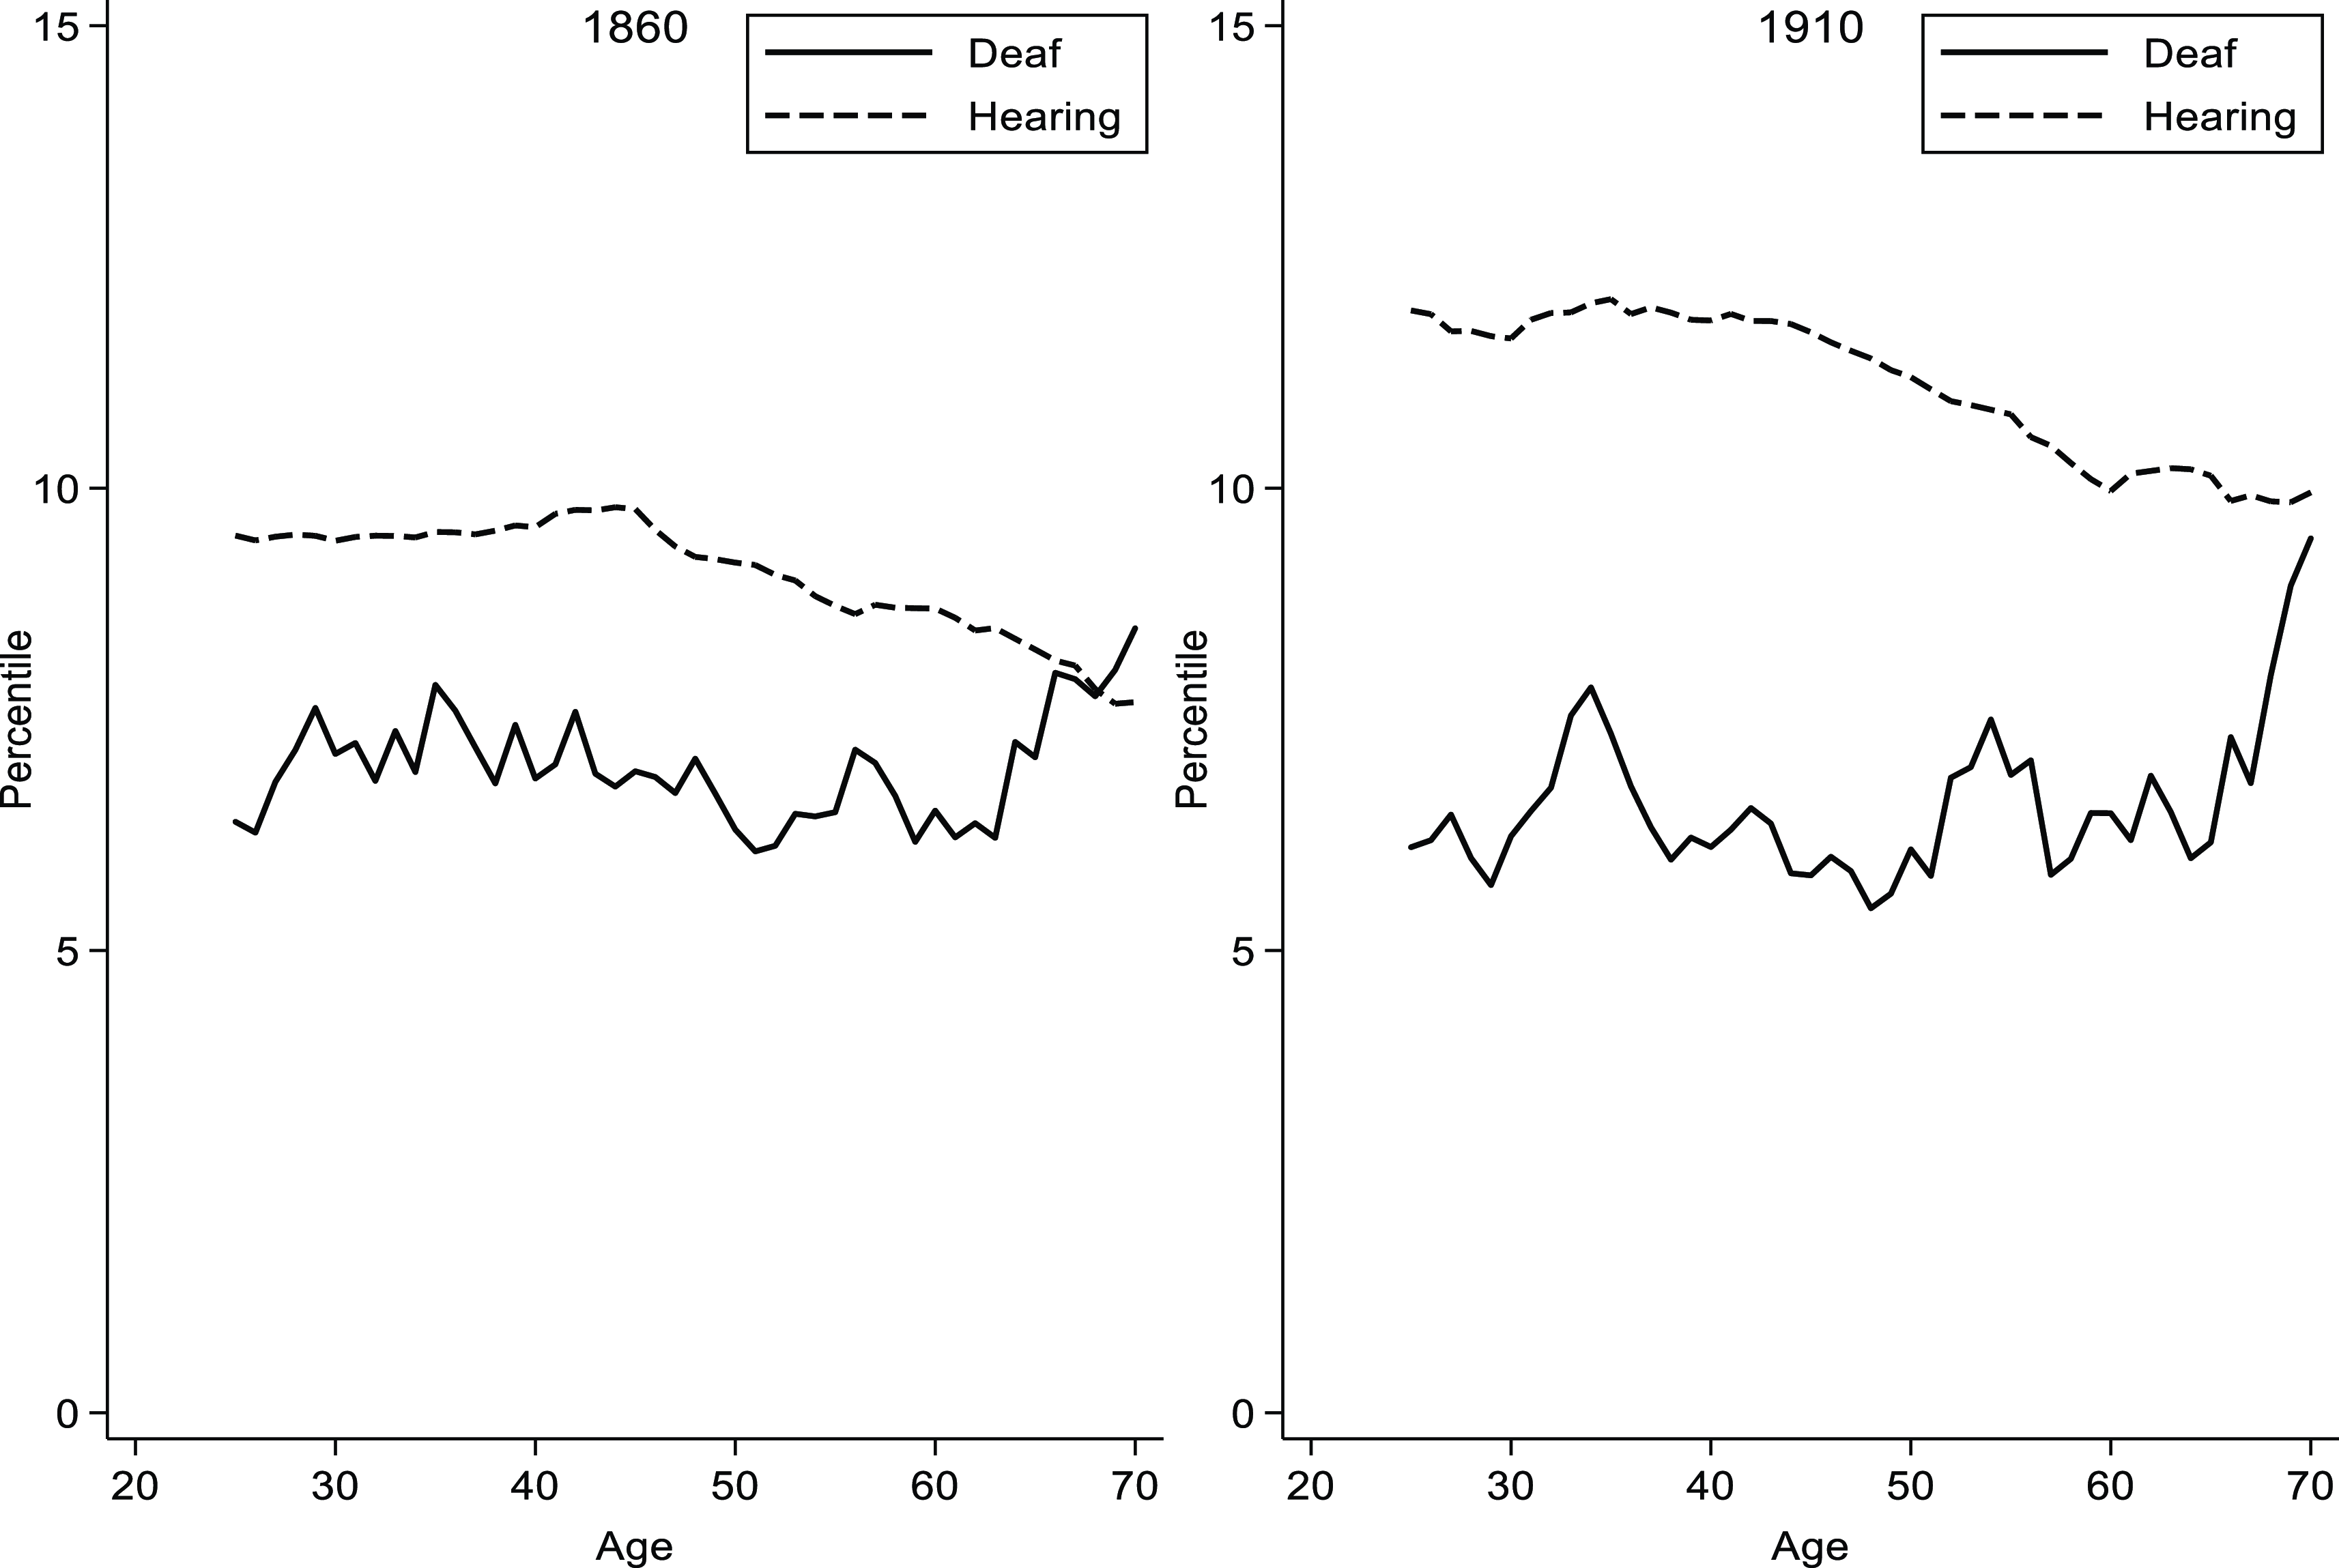
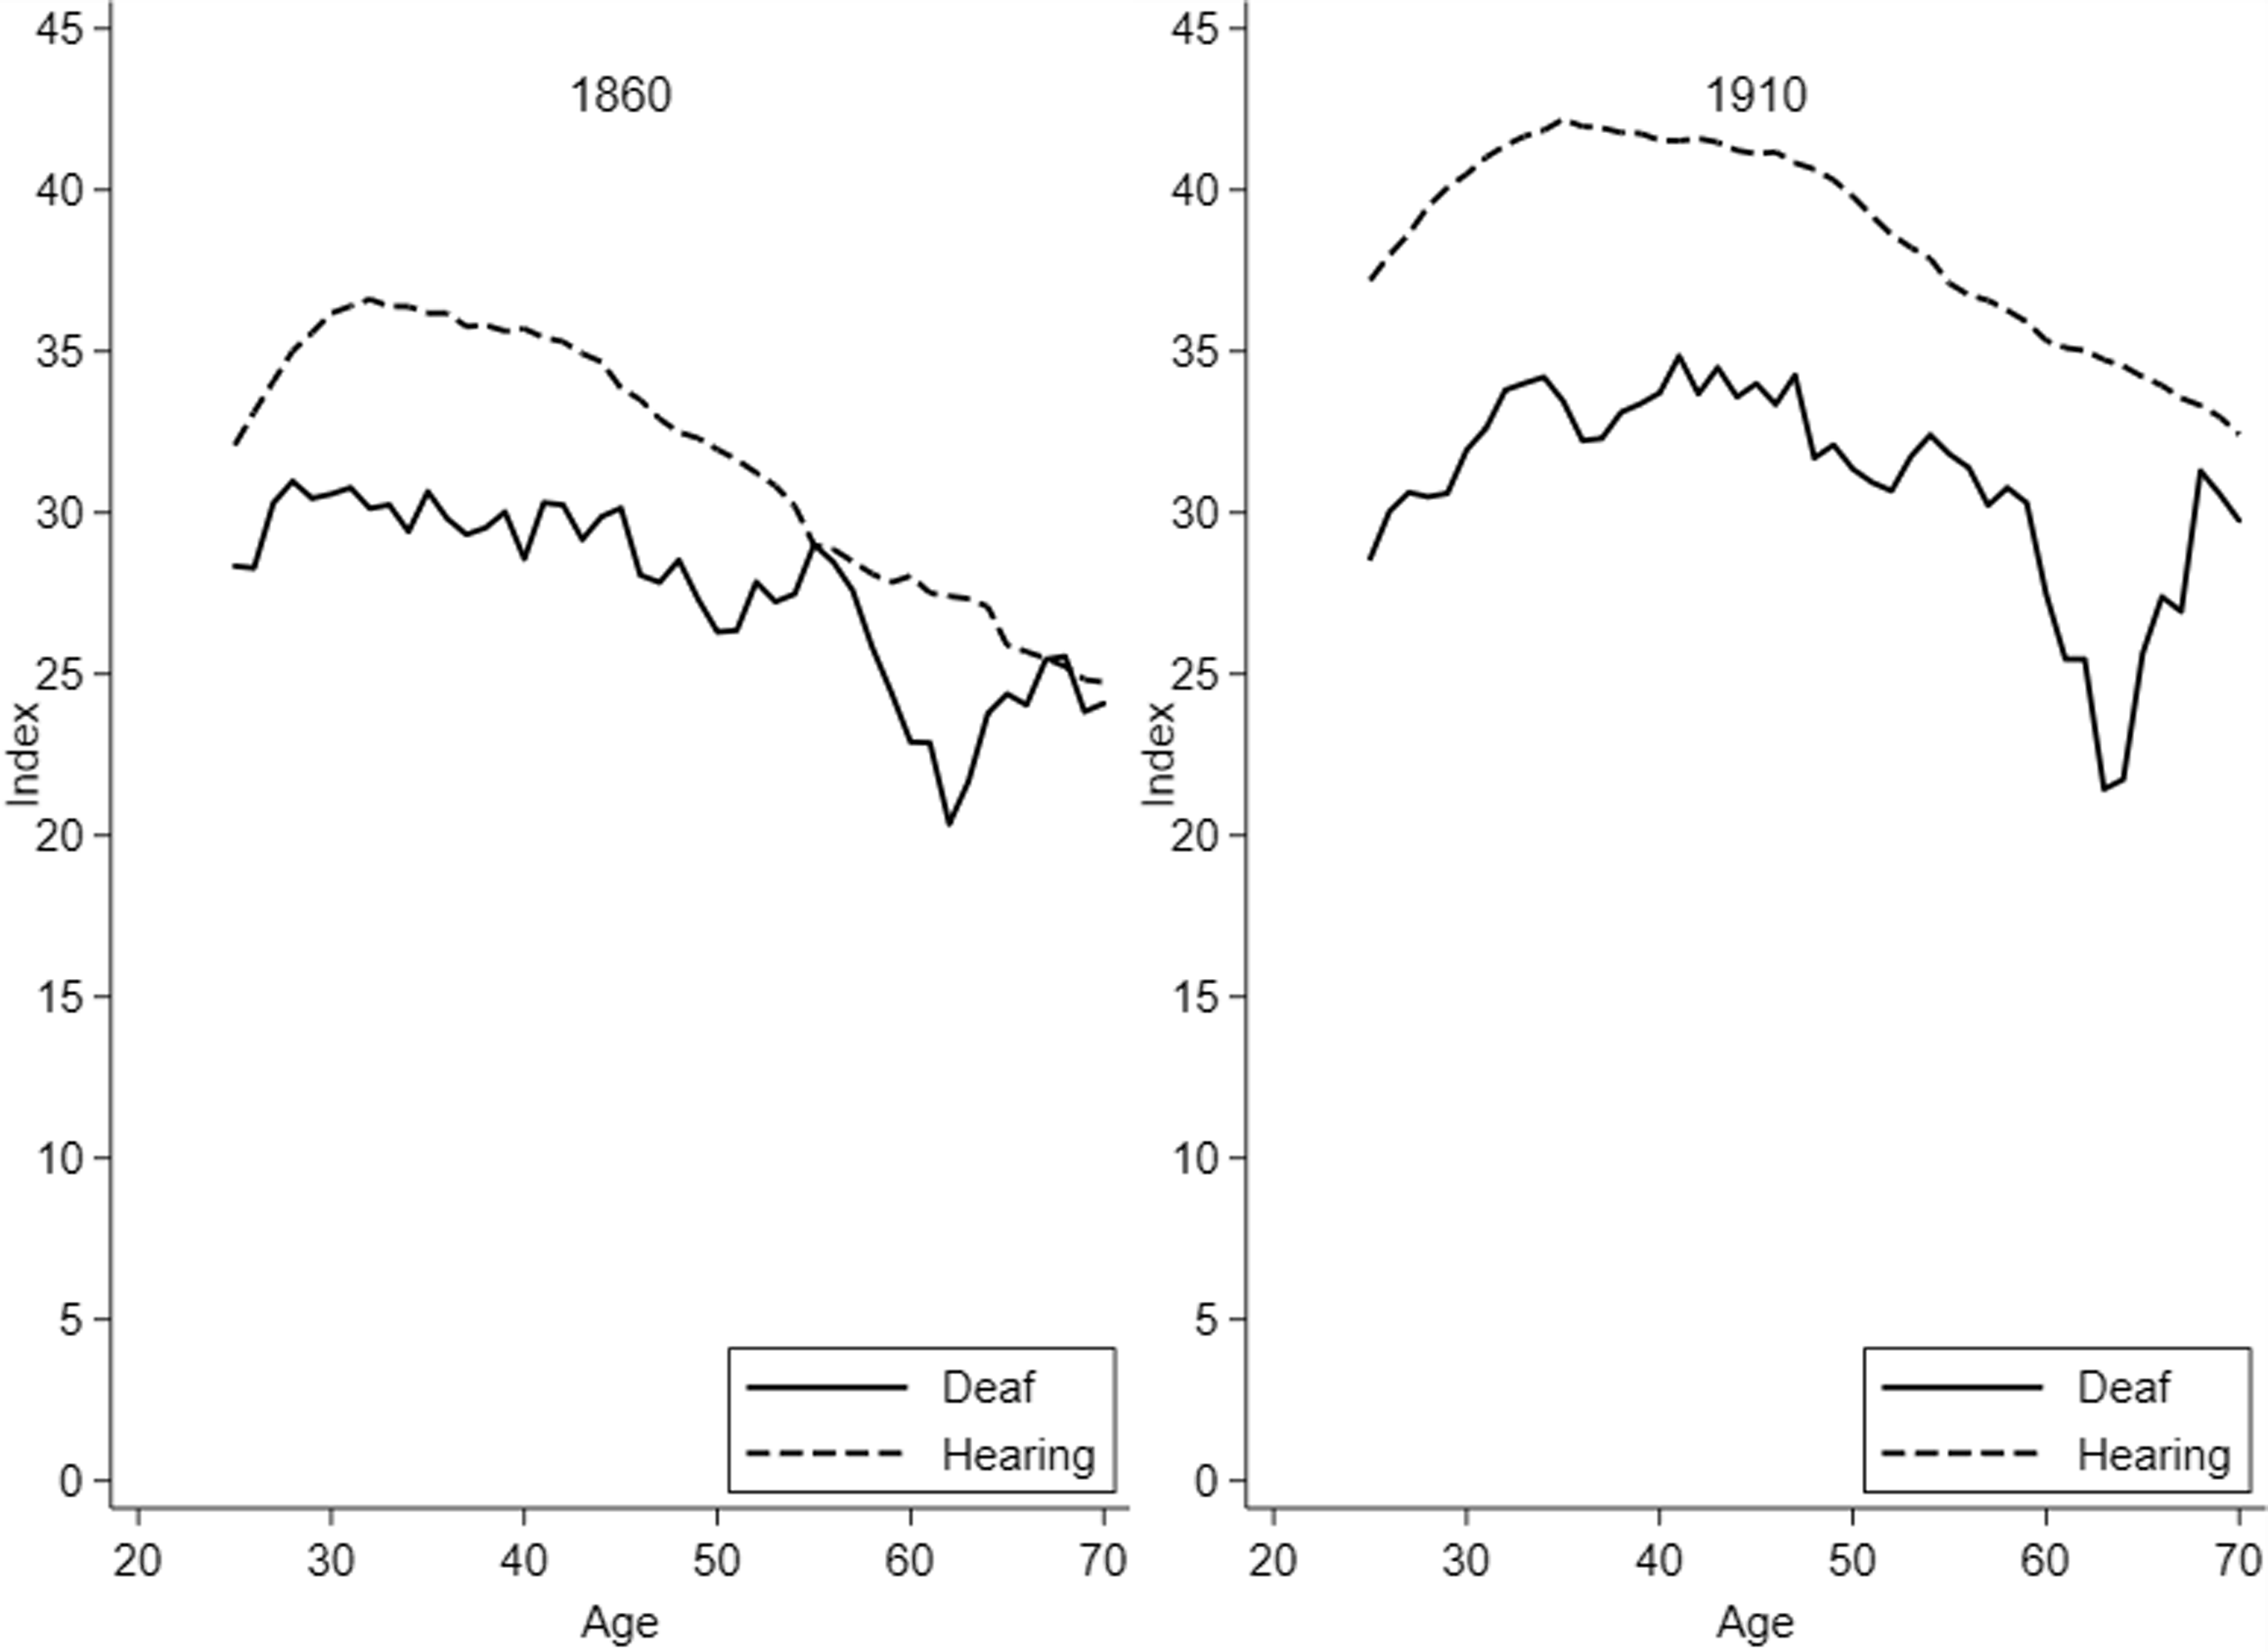
Other indicators of educational human capital tell a less optimistic story. Literacy rates improved over the 60-year period, though the raw literacy gap between the deaf and hearing populations narrowed only modestly. The occupation-based education scores in Figure 5 reflect stagnant educational human capital attainment among the deaf population over time – even while the hearing population made substantial gains.Footnote 19 The deaf population improved its economic achievement throughout the half-century, but individuals were not participating in occupations that were predominated by more educated workers. Though the evidence suggests that deaf adolescents attempted to compensate for years of schooling missed earlier in life, neither adult occupational education scores nor rates of literacy imply that the compensation was adequate to reach educational human capital parity with the hearing population. The depressed earnings scores reflect less cumulative human capital and not just less educational capital.
US occupational education score by hearing status.
Source: Data for the deaf sample are from the full-count IPUMS samples. Data for the hearing sample are a 1 million-person random sample from the full-count IPUMS sample.
Note: Displayed is the 5-year trailing average. Percentile is according to the 1950 occupation category distribution.

Further, the 1910 employment rate gap also widened well past the ages of school attendance. Together, the evidence implies that investing increasing years in education by the deaf population was not adequate to obtain the levels of educational human capital that the hearing population was able to obtain. When the average deaf person did leave school, they were prepared for less productive jobs in the workforce than was the average hearing person.
Economic outcomes
Differences in labor productivity are reflected in differing demands for labor which, in turn, result in differing wages and employment. We remind the reader that there are two additional possible explanations for deaf-hearing economic differences besides productivity. First, it is possible that deafness is irrelevant to the practice of many occupations, but that the difficulty in communicating with others is a barrier to employment. Importantly, this is not a result of deafness as such but is the result of a language barrier akin to the one experienced by immigrants to a new country who do not speak the language. If the general public could use and understand sign language, then the communication barrier would be absent. Second, animus discrimination may have played a role in employment and compensation decisions (De Veirman Reference De Veirman2015). The literature includes a plethora of first-hand accounts that assert animus discrimination varying in severity and economic relevance. To the degree that deaf workers participated in relatively competitive markets, they would have been insulated from the bulk of both economic and animus discrimination. Indeed, written documents, tabulated invoices, and physical products emit no indication of deafness by which consumers can discriminate. This line of reasoning is also supported by Harry Best who claimed that “commercial and mercantile pursuits” were the only line of occupations in which deaf workers could not extensively participate (Best Reference Best1914: 58).
Previous authors have provided only anecdotal or limited historical evidence of deaf-hearing compensation gaps. A contemporary survey of deaf industrial workers from the National Association of the Deaf publicized that “Employers and foremen treat deaf workmen the same as they do hearing workmen” and “The deaf invariably get the same wages as the hearing for the same class of work” (Robinson et al. Reference Robinson, Pach and Axling1904).
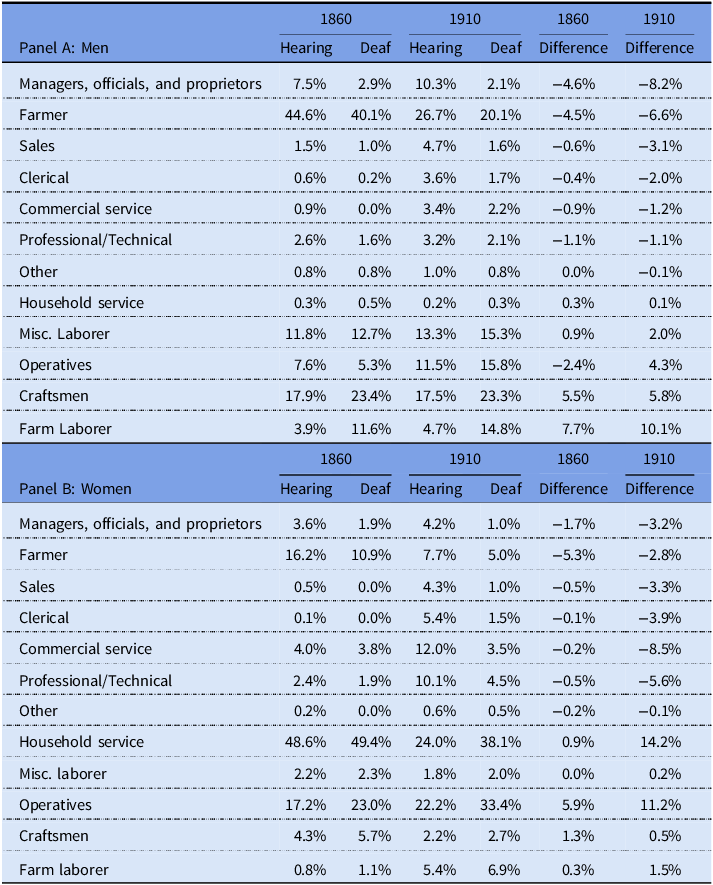
However, deaf workers tended not to participate in the “same class of work.” The typical standard of living for deaf workers was substantially less than for the hearing. Table 4 lists broad occupational categories in 1860 and 1910 according to the 1950 Census Bureau classification system. Echoing Best’s claims, by 1910 deaf workers were less commonly employed in management, sales, or commercial services. These activities relied more on quick and seamless impersonal communication with customers and suppliers. Commercial activities may have included the presumption of hearing or long-distance communication such that deafness would have introduced greater transaction costs and less effective contracts, which were often at least partially communicated audibly. Reflecting the broad economic transition toward greater commercial intermediation, these occupations constituted an increasing share of hearing workers between 1860 and 1910. Over the same period, however, employment among deaf workers did not transition similarly. The transition away from independent farming gave way to greater deaf employment as operatives and farm laborers.
US occupation differences by year and hearing status

Source: Data for the deaf sample are from the full-count IPUMS samples. Data for the hearing sample are a 1 million-person random sample from the full-count IPUMS sample.
Note: 1950 Occupational classifications in 1860 and 1910 for ages 30 and greater, by hearing status and sex.
More rigorously, the dissimilarity index among deaf and hearing workers, which is the proportion of workers who would need to change occupations in order for the distributions to be identical, increased over time for both males and females (Liebler et al. Reference Liebler, Wise and Todd2018). The dissimilarity index for males increased from 0.143 (
 $SE=0.014,\;p=0.0000)$
in 1860 to 0.222 (
 $SE=0.013,\;p=0.0000)$
in 1910, a significant increase of 0.079 (
 $S{E_{pooled}}=0.019,\;p=0.0000)$
. The hearing and deaf female dissimilarity index of 0.084 (
 $SE=0.0.048,\;p=0.082)\;$
was not significant in 1860 but surpassed males by 1910 with a value of 0.275 (
 $SE=0.034,\;p=0.0000)$
, an increase of 0.191 (
 $S{E_{pooled}}=0.059,\;p=0.0012)$
. The increasing dissimilarity may have been driven by technological change that favored hearing workers. Far from reasons of animosity, hearing individuals made up the vast majority of workers, increasing the returns of productive innovations that leveraged the ability to hear well. We speculate that at least two economy-wide changes contributed to deaf-hearing occupational dissimilarity. First, the spread of telephones to local governments, businesses, and homes clearly provided an advantage to people who could hear and speak. Second, greater urbanization increased the degree of impersonal trade and the easy access to alternative trade partners, reducing the returns for hearing individuals to learn a minority language.
Craftsmen and operatives constituted exceptional proportions of deaf workers. The composition of deaf craftsmen reflected the vocational components among schools for the deaf, particularly specializing in cabinetry, typesetting, construction and maintenance, shoemaking, and tailoring. These occupations more often included custom projects that would involve careful collaboration with a business or private customer. Indeed, the more personal nature of these activities implies that deaf workers enjoyed gainful occupation in exactly the activities where their deafness was more likely to be recognized by customers. That deaf individuals chose these occupations in exceptional proportion implies that animus discrimination was not a substantial barrier to labor market participation and economic achievement among deaf individuals.
The census did not collect individual annual income data in the nineteenth century. Ex-post proxies are largely informed by occupation. A variety of occupation-based indices measure earnings, income, status, prestige, and socioeconomic status – all of which tell the same story. Figure 6 illustrates the earnings scores over the sample period by age and deafness.Footnote 20 Across measures, deaf adults consistently performed worse than the hearing at most ages and the gap increased between 1850 and 1910. Despite the deaf-hearing school attendance gap closing and inverting by 1910, the average earnings gap across ages monotonically increased by more than double over the 60-year period.
US earnings score by deafness.
Source: Data for the deaf sample are from the full-count IPUMS samples. Data for the hearing sample are a 1 million-person random sample from the full-count IPUMS sample.
Note: Displayed is the 5-year trailing average.

In terms of labor force participation and a variety of occupation-based economic outcome measures, deaf adults did not enjoy the same degree of economic achievement as did their hearing counterparts. Not only did average occupational index gaps persist throughout the late nineteenth century, they worsened with each passing decade through 1910. Increasing employment and occupational outcome gaps are consistent with lower levels of human capital among the deaf population, despite leveraging their educational comparative advantage.
The average deaf person in the United States between 1850 and 1910 invested in human capital as if it had lower returns. Given that a cohesive deaf community was often not available at the beginning of this period, the inability to effectively communicate with the hearing majority may have been the cause. As suitable educational resources gained popularity, educational investment among deaf individuals increased. However, even with greater years of education by 1910, all economic indicators imply that the human capital investments were inadequate to fully compensate for the different human capital endowments of deafness. To the degree that compensatory skills were developed, they were inadequate to produce economic outcomes comparable to hearing counterparts given the technology and institutions of the period.
Regression analysis
Human capital investment
Although comparing simple averages and proportions provides insight into the life of a typical deaf person, regression analysis can help to separate the contribution of different determinants. That about 42 percent of people classified as “deaf-mute” in 1890 had been so since birth does not exclude environmental determinants (Billings Reference Billings1894: 96). Though we do not find that they predict having a deaf child, in this section we use simple probit and ordinary least squares models to separate the effects of being deaf from potential correlates. All regressions include all available years of data between 1850 and 1910.
Equation (2) identifies the probit model specification with standard errors clustered by state that we use for binary response variables, where Φ is the cumulative normal distribution. Three coefficients are of particular interest in regard to the deaf population: δ is the simple effect of deafness,
 ${\beta _a}$
is the effect of deafness interacted with age indicators, and γ is the effect of deafness interacted with an indicator variable that is equal to one if a state had a residential school for the deaf that was “supported chiefly or in large part by public funds” (Hill and Brown Reference Hill and Brown1918). This captures the effect of educational subsidy for the deaf. Whether a state had a publicly funded residential school for the deaf was constructed from Fay (Reference Fay1893), a US census special report on deaf-mutes (Hill and Brown Reference Hill and Brown1918), and a list of schools published by the Annals of the Deaf (“Tabular Statement of American Schools for the Deaf, 1889” 1890). The cumulative effect of deafness as such is
 $\delta + {\beta _a}$
and the cumulative effect of deafness with education subsidies is
 $\delta + {\beta _a} + \gamma $
.
 $$\eqalign{ P{\left( {Success|X} \right)_{i,t}} =\ & \Phi \bigg(\alpha + \delta Dea{f_{i,t}} + \sum {\beta _a}{\left( {Deaf \times Age} \right)_{i,t}} \cr & + \gamma \left( {Dea{f_{i,t}}\times\matrix{ {Available\;School\;} \cr {for\;the\;Dea{f_{i,t}}} \cr } } \right) + \sum {\beta _{i,t}}{x_{i,t}}\bigg)} $$
Specifications are divided into two categories. The first is applicable to human capital investment decisions made early in life for ages 30 and younger, such as whether to attend school or to work. We use only non-heads of households in order to better interpret school attendance and employment as human capital investments. Covariates include head of household literacy, labor force participation, and a variety of occupation-based variables that estimate education, earnings, income, status, prestige, and socioeconomic status. For households that included multiple heads, we identify the head as literate if at least one was literate and as employed if at least one was employed. We assign the maximum occupational score of the heads to be the household head’s occupational score. We also control whether a state has compulsory school attendance legislation.
The second specification is applicable to human capital results later in life for ages 30–70, such as literacy rate, employment rate, or various occupation-based measures of achievement. For this specification, we omit head-of-household controls and include birth-state controls. We assign the compulsory schooling and school for the deaf indicators by birth state if they were present by the time an individual was 15 years old.Footnote 21 Both specifications also include indicators for sex, nativity, age, urban, metropolitan, farm, year, and state.
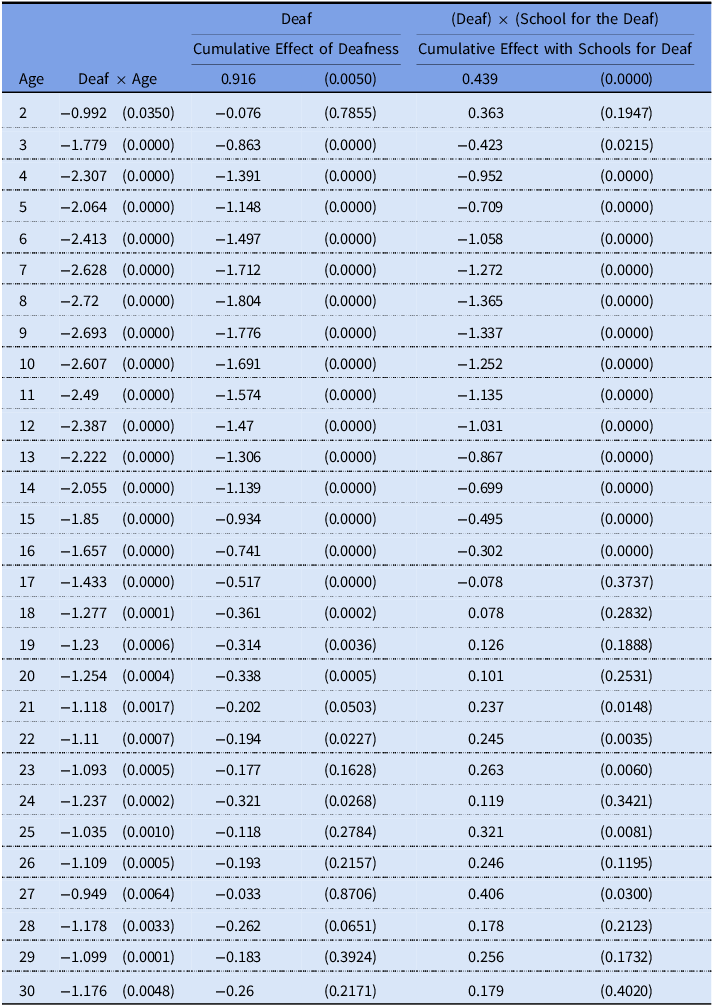
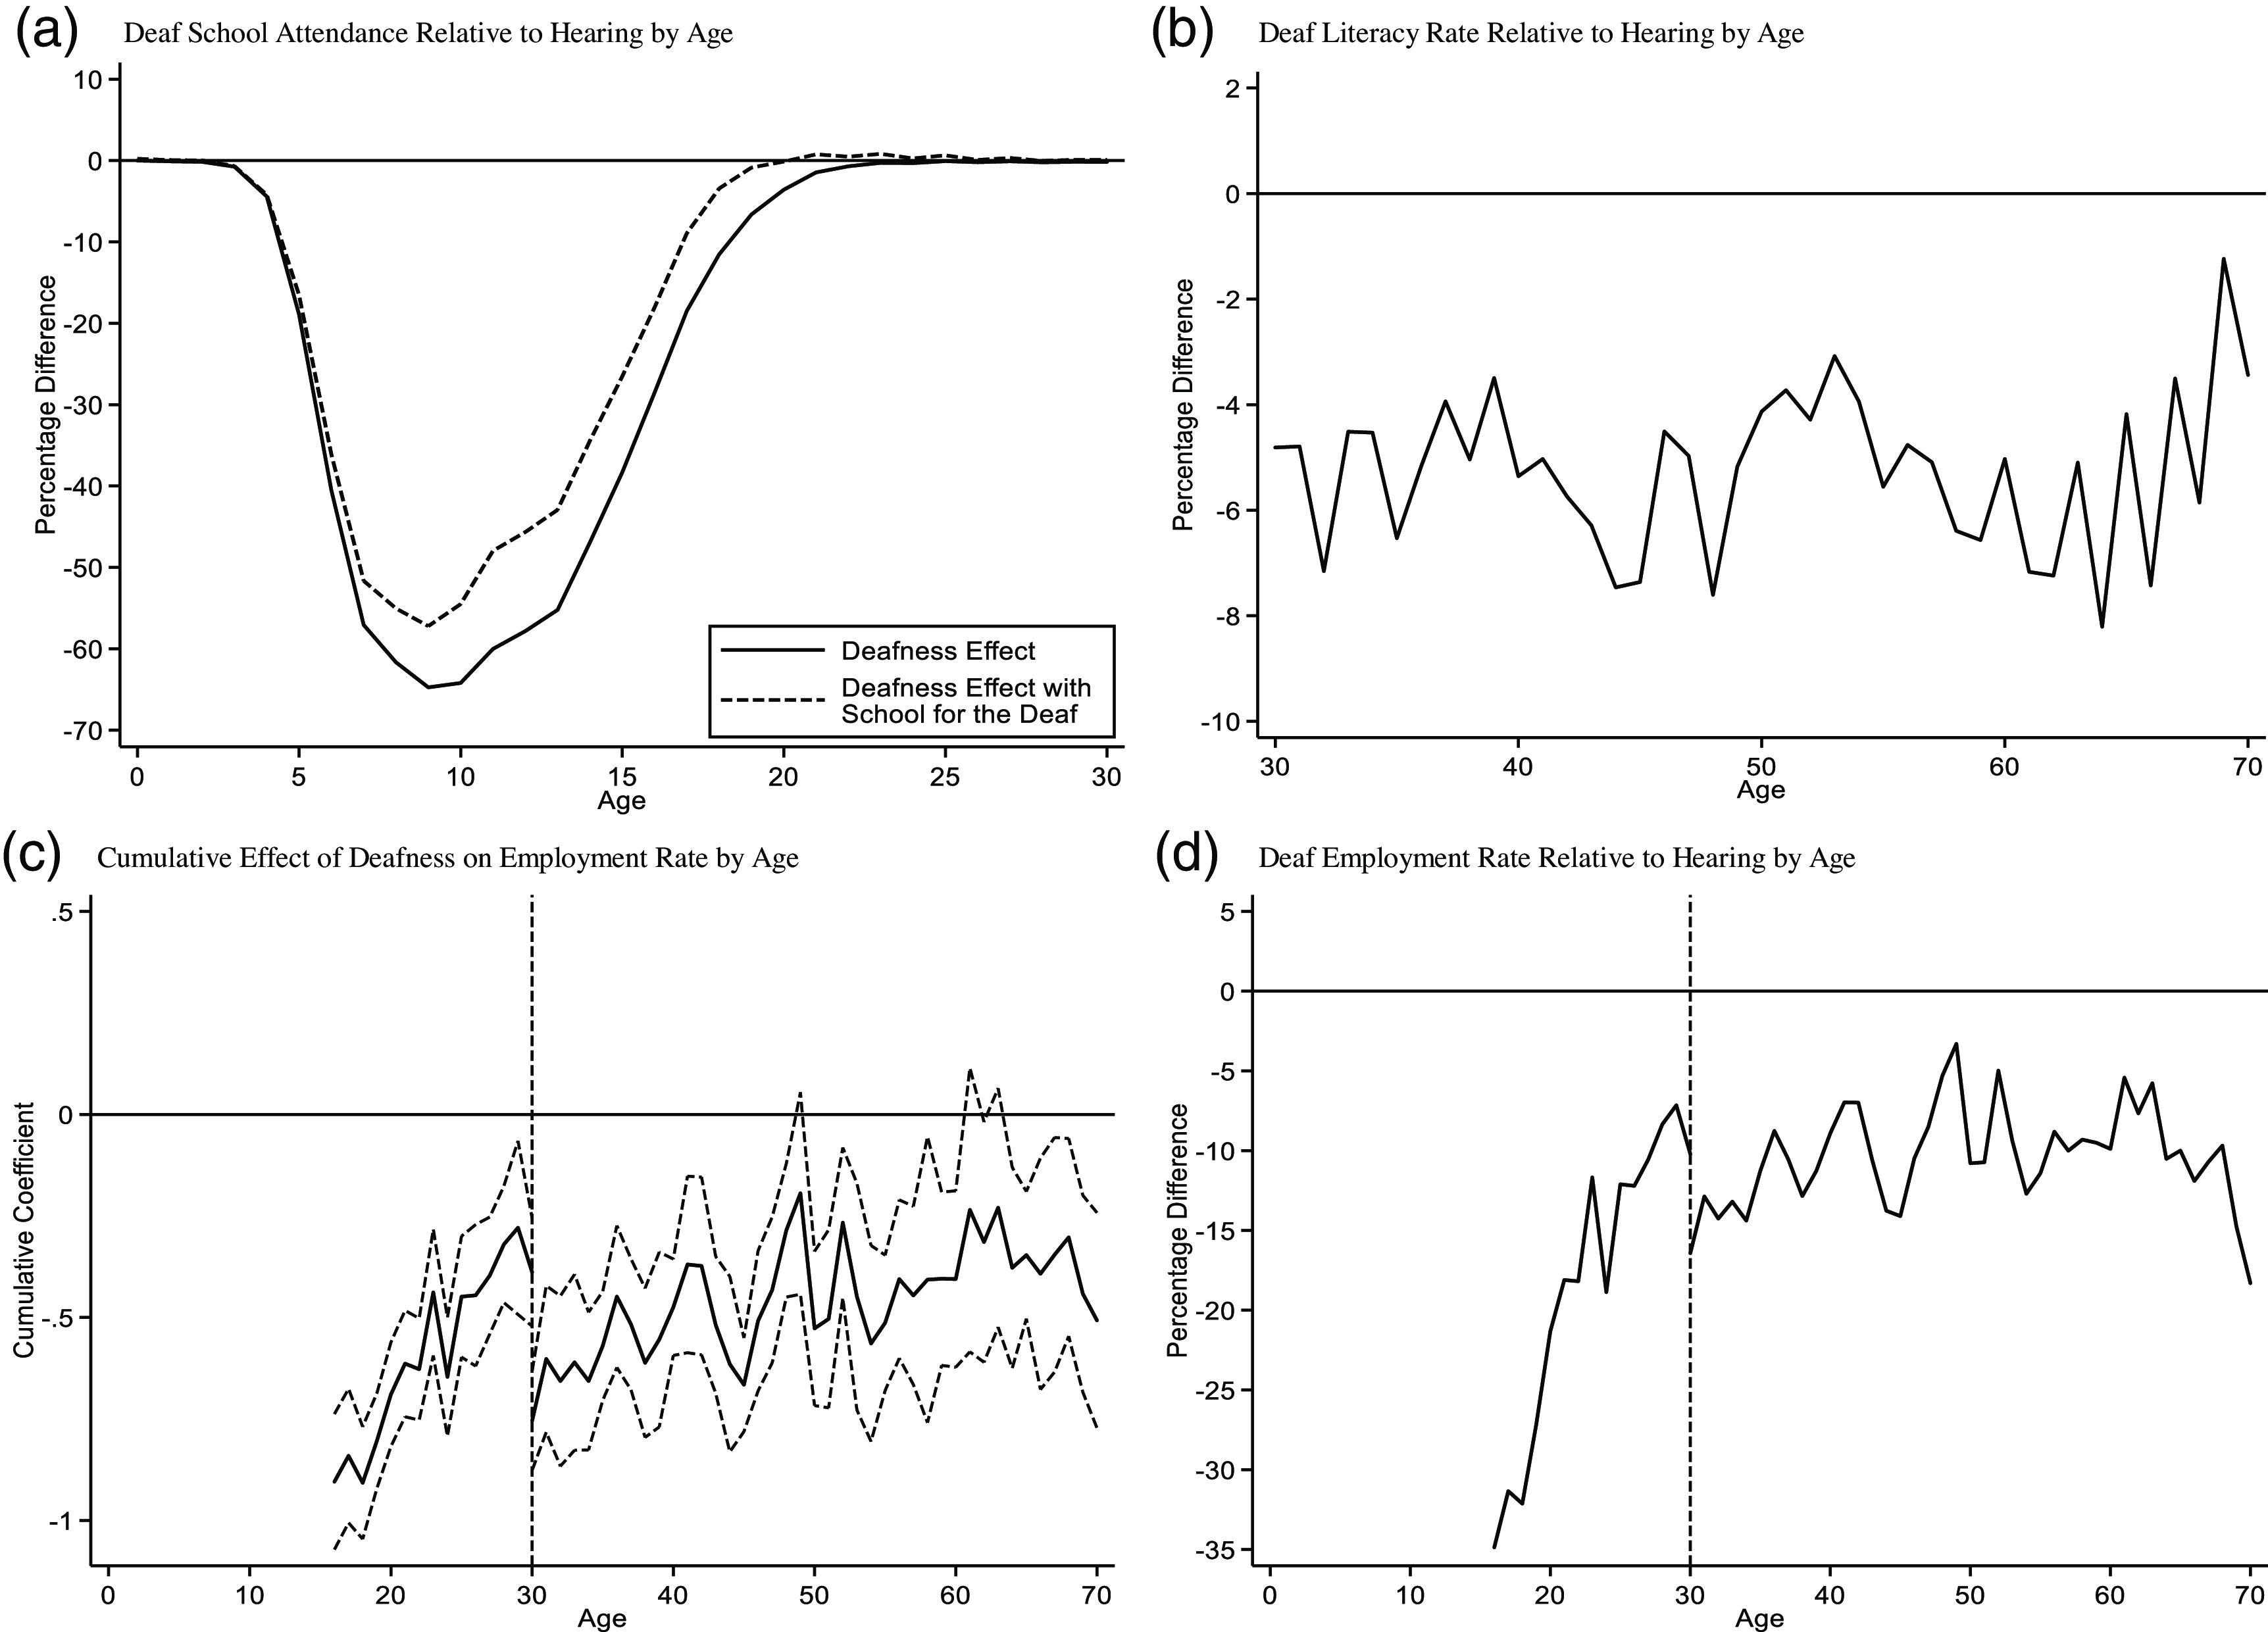
Table 5 contains the school attendance probit model results. The probit coefficients reflect that deafness reduced attendance at all ages and that the effect was largest between ages 4 and 14.Footnote 22 Even when states funded a school for the deaf, attendance rates remained depressed between the ages of 4 and 16.Footnote 23 Using average values for controls, panel A of Figure 7 plots the estimated attendance gap due to deafness as the difference in predicted probability between the deaf and hearing according to equations (3) through (5).
 $${P_{Deaf}}{\left( {Success|X} \right)_{i,a}} = {\rm{\Phi }}\left( {\alpha + \delta + {\beta _a}{{\left( {Deaf \times Age} \right)}_i} + \sum {\beta _i}{x_{i,a}}} \right)$$
 $${P_{Hearing}}{\left( {Success|X} \right)_{i,a}} = {\rm{\Phi }}\left( {\alpha + \sum {\beta _i}{x_{i,a}}} \right)$$
 $${{{\Delta P{{\left( {Success|X} \right)}_a}}}\over{{\Delta Deaf}}} = {P_{Deaf}}{\left( {Success|X} \right)_a} - {P_{Hearing}}{\left( {Success|X} \right)_a}$$
Probit model of school attendance for persons of age 30 and younger, 1850–1910

Source: Data for the deaf sample are from the full-count IPUMS samples. Data for the hearing sample are a 1 million-person random sample from the full-count IPUMS sample.
Note: Probit regression of school attendance for individuals ages 30 and less who are not a head of household, with standard errors clustered at the state level. Control coefficients are omitted from this table for brevity. P-values in parentheses. Controls include sex, age, year, state, nativity, state compulsory schooling status, urban, metro, farm, as well as head of household occupational measures, employment, and literacy. Cumulative effect standard errors are pooled. Control coefficients omitted. n = 3,073,436. Pseudo r-squared = 0.463.
Cumulative effect of deafness on school attendance, literacy, and employment by age.
Source: Data for the deaf sample are from the full-count IPUMS samples. Data for the hearing sample are a 1 million-person random sample from the full-count IPUMS sample.
Note: Panel A illustrates the attendance rate difference of the deaf population relative to the hearing as predicted by the probit model.
Panel B illustrates the literacy rate difference of the deaf population relative to the hearing as predicted by the probit model.
Panel C illustrates the cumulative probit coefficient for LFPR as the sum of the deaf and the deaf-age interaction coefficients. The model for ages younger than 30 includes head of household controls. The model for ages greater than 30 instead includes birth state controls.1850 data excludes females.
Panel D illustrates the LFPR difference of the deaf population relative to the hearing as predicted by the probit models.1850 data excludes females.
Standard errors are the pooled-root variance and are used to create 95% confidence intervals.

We omit the table of coefficients for the literacy probit model for concision but plot the estimated literacy gap in panel B of Figure 7. Although state funding of schools for the deaf increased attendance, they did not have significant effects on literacy. This would be surprising for the comparable hearing population. However, that omitting earlier years results in a negative effect lends credit to the hypothesis that schools for the deaf, which increasingly emphasized audible speaking and lip-reading and prohibited signing near the turn of the century, paid an opportunity cost in exchange for students attempting to learn verbally articulated speech. Unlike the estimated effect of deafness on attendance, the estimated effect on literacy shows no lifecycle pattern. After controlling for other variables, deaf people had an estimated average literacy rate that was 5.3 percentage points lower than their hearing counterparts once beyond the age of human capital investment. Comparing the raw data to the probit results reveals that confounding correlates are not to blame for the lower average levels of human capital among deaf persons.
We model the proportion of employment using both the human capital investment period and post-investment period specifications. Panel C of Figure 7 includes the cumulative coefficients of being deaf and panel D includes the estimated employment gaps. We omit the estimated effect of state funding for schools for the deaf due to insignificance. This alone is worthy of note because it implies that state funding did not improve whether individuals were able to find gainful employment, despite the social improvements that schools likely yielded. Importantly, due to the differing specifications, the coefficient levels cannot be compared across age 30. However, both cohort specifications reflect a significant effect of deafness that shrinks with age. The estimated deaf employment rates relative to the hearing rates are comparable across specifications and reflect a life-cycle difference of substantially lower deaf employment until as old as age 35. The gap stabilizes between the ages of 40 and 60 at about 9.4 percentage points lower than that of the hearing employment rate.
Younger deaf people attended school and worked at much lower rates than did their hearing counterparts even controlling for other factors.Footnote 24 Lower educational and physical human capital investments are reflected in the consistently lower literacy rates and employment rates as working age adults. While there is evidence that deaf people had different timings of both educational and physical human capital investments, there is no evidence that they achieved comparable levels of human capital after accounting for the delay. Though lower observed human capital investments do not exclude unobserved investment, the next section provides evidence that is not consistent with substantial degrees of unobserved human capital accumulation.
Human capital levels
If deaf adults had less human capital and commensurate productivity, then firms would be willing to employ fewer of them or employ them at a lower wage for any given occupation. As we argue above, firms more likely employed deaf workers while making adjustments along extensive margins by employing them for systematically different occupations. Presumably, the most productive employees gain positions as supervisors, managers, and executives. Deaf employees may have retained wage parity with their hearing occupational colleagues, while not enjoying the same occupational rank.
Equation (6) describes the simple production function,
 ${Y_i}$
. Taking logs, equation (7) is the simple ordinary least squares model that we estimate to model the occupation-based measures of education, earnings, income, prestige, status, and socioeconomic status with standard errors clustered at the state level.
 $${Y_{i,a}} = \alpha {\left( {Dea{f_i}} \right)^\delta }\left( {\prod \left( {Deaf\times Age} \right)_i^{{\beta _a}}} \right){\left( {Dea{f_i}\times\matrix{ {Available\;School\;} \cr {for\;the\;Dea{f_{i}}} \cr }} \right)^\gamma }\left( {\prod x_{i,j}^{{\beta _j}}} \right){\varepsilon _i}$$
 $$\begin{gathered}\ln \left( {{Y_{i,a}}} \right) = \ln \left( \alpha \right) + \delta \ln \left( {Dea{f_i}} \right) + \sum {\beta _a}\ln {\left( {Deaf\times Age} \right)_i} \cr \,\,\,\,\,\,\,\,\,\,\,\,\,\,\,\,\,\,\,\,\,\,\,\,\,\,\,\,\,\,\,\,\,\,\,\,\,\,\,\,\,\,\,\,\,\,\,\,\,\,\,\,\,\,\,\,\,\,\,\,\,\,\,\,\,+ \gamma {\rm{ln}}\left( {Dea{f_i}\times \matrix{ {Available\;School\;} \cr {for\;the\;Dea{f_{i}}} \cr }} \right) + \sum {\beta _j}\ln \left( {{x_{i,j}}} \right) + \ln \left( {{\varepsilon _i}} \right)\end{gathered}$$
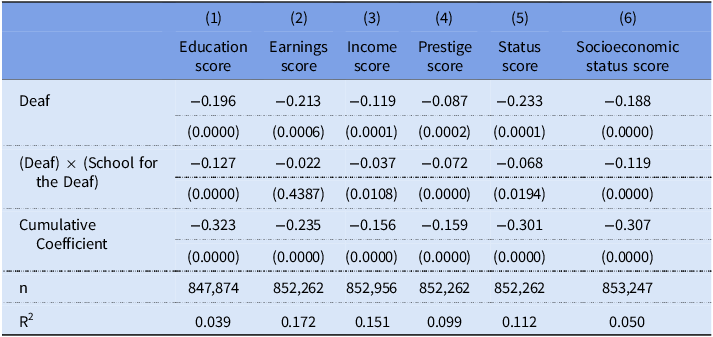
We omit most of the results for concision but note that most deaf-age interaction coefficients are no different from zero except for somewhat depressed levels during the peak earning ages of 40–50. Given the lack of life-cycle effects otherwise, we report only the baseline effect of deafness, the effect of having access to a school for the deaf, and their cumulative coefficient in Table 6. Column (1) describes the impact on the occupation-based measure of educational human capital, columns (2)–(3) describe the impact on earnings and incomeFootnote 25 , and columns (4)–(6) describe the effect on measures of social standing. Deafness itself was associated with 11.9 percent–21.3 percent lower productivity and 8.7 percent–23.3 percent lower social standing. The depressed educational scores are consistent with the previous section. Deaf people who worked tended to work in occupations that included substantially less pecuniary reward, social reward, and in occupations with less educated colleagues.
OLS model of logged occupational scores: Effects of deafness, schools for the deaf, and combined effects

Source: Data for the deaf sample are from the full-count IPUMS samples. Data for the hearing sample are a 1 million-person random sample from the full-count IPUMS sample. 1850 data excludes females.
Note: Coefficients of log occupational score OLS regressions for individuals aged 30 through 70 whose occupational score is greater than zero with standard errors clustered at the state level. The School for the Deaf interaction term refers to an indicator variable that is 1 if an individual’s birth state provided funding for schools for the deaf by the time the deaf individual turned 15 years of age. Controls include state, birth state, sex, year, nativity, urban, metro, farm, and presence of birth state compulsory school attendance law when the individual was fifteen. Age-deaf interactions are excluded due to insignificance. P-values in parentheses. Cumulative coefficients use pooled standard errors.
The effect of living in a state with a school for the deaf when an individual was at least 15 years old is also surprisingly and consistently negative, with the strongest effect on the education score. The implication is that access to a school for the deaf reduced educational human capital and economic achievement in contrast to less standardized alternatives. We need not assume that prospective students were uninformed. Because vocational training in schools was known for its emphasis on the trades, students would have known the economic achievement of graduates to some degree. Rather, there were likely non-pecuniary benefits of school attendance. Schooling would have introduced and provided access to deaf culture, periodicals, and clubs. The incremental improvement in these intangible consumables was so great that deaf individuals were willing to pay a high economic opportunity cost. Students not only learned a trade at school, they joined a society complete with its own common experiences and language. Forgoing school attendance would have meant forgoing substantial relational goods for a mere 2.2 percent–3.7 percent improvement in labor productivity, columns (2)–(3). The caveat is that the various scores are occupation-based. Therefore, any social solidarity among deaf adults is not detected by the measures.
If physical human capital was a determinant of occupation among deaf workers, then they would have chosen occupations that, on average, complemented their composition of human capital in order to exploit their comparative advantage. Using the 1949 Dictionary of Occupational Titles, a 1956 report by the US Bureau of Labor identified personal aptitudes, physical capacities, and working condition factors for more than 4,000 occupations (Dictionary of Occupational Titles 1949; Estimates of Worker Trait Requirements for 4,000 Jobs as Defined in the Dictionary of Occupational Titles: An Alphabetical Index 1956).Footnote 26 We digitize select variables and create a crosswalk between the occupation industries and the OCC1950 industries listed for working individuals in IPUMS to compare hearing and deaf employment in industries that were characterized by different average verbal aptitudeFootnote 27 , talking and hearingFootnote 28 , and high levels of noise or vibration.Footnote 29 The verbal aptitude is expressed as a binned percentile of which we take the midpoint, and the other two characteristics are binary occupation descriptors.
Deaf workers would only have a human capital disadvantage in occupations requiring greater verbal aptitude if such aptitude included audibly spoken words. Occupations that emphasize writing or reading would have posed no particular challenge to deaf workers. Similarly, there would be no disadvantage if task auditors included only textual requirements in the occupational characteristics. More clearly relevant to the human capital of deaf workers is the “talking and hearing” physical capacity. Finally, the noise and vibration working condition admits of possible endogeneity. Workers able to better communicate inaudibly would have an advantage in loud environments. However, it is also possible that loud environments damage hearing and cause deafness rather than deaf individuals selecting into those occupations.
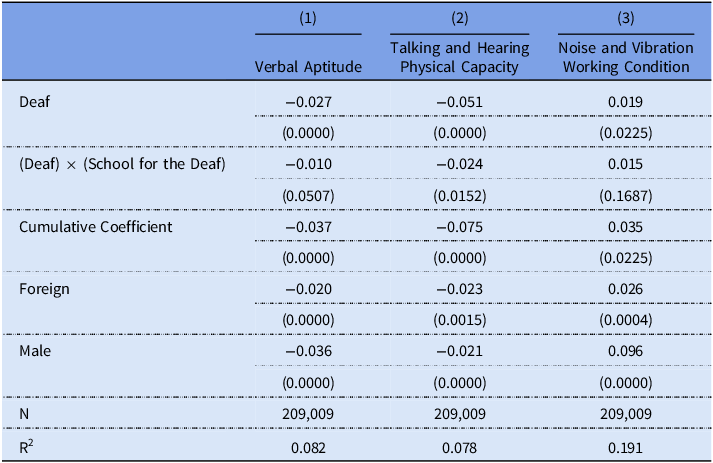
Using the same ordinary least squares specification as in equation (7) instead of the level of average industry characteristics and omitting the deaf-age interaction due to insignificance, Table 7 reports the marginal effects of deafness and access to schools for the deaf on occupation industry characteristics for the 1910 sample of employees ages 30–70. Column (1) coefficients report the effect on the industry verbal aptitude percentile. Being deaf was associated with employment in an industry that required 2.7 percentile points lower verbal aptitude than hearing counterparts. Further, access to a school for the deaf by the age of 15 widened this gap by an additional 1 percentage point reflecting that schools helped to prepare students for jobs that best suited their comparative advantage. Columns (2) and (3) coefficients have approximately the same interpretation as a linear probability model. Deaf employees were 5.1 percent less likely to be employed in industries that included frequent talking and listening, and, again, access to a school for the deaf widened this gap by another 2.4 percent. Similarly, being deaf increased the probability of working in an industry with loud noise and heavy vibration by 1.9 percent, though access to schools for the deaf did not affect this outcome. Importantly, the interpretive concern of noisy industries causing deafness is ameliorated by the insignificance of omitted deaf-age coefficients, which would be more positive at older ages if there were endogeneity. For comparison, the coefficients for being foreign-born and male are included. Foreign-born individuals would self-select into industries for which a language barrier could be accommodated and men would be more likely to work in industries that exploit their comparative advantage in physical strength rather than social skills (Pitt et al. Reference Pitt, Rosenzweig and Hassan2012). Except for the insignificance of access to schooling on the probability of employment in a noisy industry, all of the coefficients are consistent with human capital-based occupational selection and complementary schooling. Working less in industries characterized by talking and hearing, which paid better, may account for part of the economic achievement gaps between hearing and deaf employees.
OLS model of industry trait requirements: effects of deafness, schools for the deaf, and combined effects

Source: Data for the deaf sample are from the 1910 full-count IPUMS sample. Data for the hearing sample are a 1 million-person random sample. Occupational trait data are from Estimates of Worker Trait Requirements for 4,000 Jobs as Defined in the Dictionary of Occupational Titles (1956).
Note: Coefficients of industry trait OLS regressions for individuals aged 30 through 70 with standard errors clustered at the state level. Industry trait is the average of occupational traits in each industry. The School for the Deaf interaction term refers to an indicator variable that is 1 if an individual’s birth state provided funding for schools for the deaf by the time the deaf individual turned 15 years of age. Controls include state, birth state, sex, year, nativity, urban, metro, farm, and presence of birth state compulsory school attendance law when the individual was 15. P-values in parentheses. Cumulative coefficients use pooled standard errors. Marginal effects in column (1) are changes in aptitude percentile as a decimal, and in column (2) are changes in proportion working in such industries.
Including the industry characteristics in occupational score regressions comparable to those in Table 6 for the year 1910 reduces the negative effects of deafness, implying that large portions of the deaf-hearing occupational score gaps were due to human capital differences. For example, the negative deaf coefficient for the earnings score shrinks by 45.5 percent, implying that substantial portions of the deaf earnings penalty can be attributed to human capital composition. The proportions by which the coefficients shrink with the inclusion of the industry-specific human capital indicators are as follows: prestige score (9 percent), status score (43.2 percent), income score (44.4 percent), earnings score (45.5 percent), educational score (63.1 percent), and socioeconomic status score (81.5 percent). These are underestimated, however, because the scores vary within industries. Future comprehensive occupational trait digitization and crosswalks will permit better estimates.
Regardless of the social advantages provided by schools for the deaf, the existing institutions and technology of the late nineteenth century were such that being deaf resulted in less human capital investment and lower measured productivity. There is not evidence that deaf people developed adequate compensating skills to offset the productivity implications of their deafness – literacy, employment, and economic achievement gaps persisted. Further, deaf adults worked disproportionately less in industries that were characterized by talking and hearing and higher verbal aptitude. However, deaf individuals had a comparative advantage, if not an absolute one, in consuming deaf culture and society. The decision to stay in schools well into adulthood implies that deaf individuals were willing to forego tangible wealth in exchange for the intangible and very real benefits of relational goods.
Despite increasing attendance rates throughout the sample period, deaf adults tended to engage in occupations that were performed by people with less education, which resulted in lower material and occupation-based outcomes. Further, any unobserved human capital investments that the average deaf individual may have made were inadequate to reach levels of economic achievement comparable to hearing counterparts. Importantly, the cause of these differences between the deaf and hearing populations cannot be deduced from the above statistical regularities alone. Although the results favor the human capital model of deafness, they do not categorically exclude communication barriers or being the subject of animus discrimination.
Conclusion
We conduct the first econometric analysis of the nineteenth-century US deaf population. This population is unique insofar as it had a different human capital composition that was easily identifiable and was most often endowed prior to human capital investment decisions. The period of 1850–1910 is unique due to the development of broad access to educational resources and communication among the deaf population, while also being prior to large-scale labor market interventions by governments.
We apply a model of human capital to deafness and find that lower educational and physical human capital investments were commensurate with lower productivity in labor markets. This model is agnostic concerning designations of disability, unlike the medical model of deafness (Bergeron et al. Reference Bergeron, Berland, Demers and Gobeil2020; Kushalnagar et al. Reference Kushalnagar, Claire Ryan, Spellun and Gulati2020; Lahlou et al. Reference Lahlou, Daoudi, Ferrary, Jia, De Bergh, Nguyen, Sterkers and Mosnier2022), and fills the gap in the literature left by the social and cultural models of deafness in order to address economic consequences and their determinants. By 1910, young deaf people were attending more years of school and investing less in work experience. However, access to a school for the deaf was not associated with higher rates of literacy or employment, and was associated with lower occupational measures of achievement. Students may have attended school as an investment in social capital, forgoing the returns that work experience would have provided in lieu of intangible relational goods. We provide evidence that using a simple deaf indicator for school attendance and employment ignores substantial life-cycle differences between the deaf and hearing populations and that interacting with age or separate analyses is appropriate (Becker and Woessmann Reference Becker and Woessmann2009).
The deaf population accumulated less educational and physical human capital. Estimated years of education were depressed until the twentieth century, literacy rates were consistently lower, and deaf workers tended to have occupations with less educated colleagues. Years of work experience early in life were also fewer. Consequently, both the observed human capital investments and the unobserved investments that can be inferred from economic attainment imply that the nineteenth-century deaf population did not fully compensate for their human capital endowment. Further, deaf people are self-selected into collaborative occupations while avoiding managerial and commercial roles. Schools for the deaf reinforced the tendency for deaf workers to avoid industries with higher verbal aptitude and that were characterized by talking and hearing. This self-selection is tentative evidence against animus discrimination in the labor market. Overall, the deaf population appears to have had a less productive human capital production function, regardless of their comparative advantage in educational human capital.
There are substantial limitations to our analysis. Our analysis uses decadal cross-sectional census data and is not able to identify the number of years of schooling and work experience at the individual level. If or when the data that informed the US Census “Special Reports on The Blind and Deaf” are digitized, a richer picture and analysis will be possible. As the decadal census data are refined and released, linking deaf individuals across time will also enable more sophisticated questions and methods. Finally, as increasing portions of the Estimates of Worker Trait Requirements become digitized, richer occupational and skill analysis will be possible. Analytically, our conclusions are limited to the effects of deafness in the context of institutional, social, and technological characteristics during the period. As the constraints and opportunities for deaf people change over time, so would any measured consequences of deafness.
Most models of human capital emphasize observable investment, policy, household environment, or consequent economic achievement. Observable human capital endowments permit a closer look at both an output production function and the human capital production function itself (Romer Reference Romer1990; Pitt et al. Reference Pitt, Rosenzweig and Hassan2012). Specific endowments may provide different yields to types of human capital investment and ultimate occupational details. Furthermore, policies attempting to improve human capital accumulation may also lower the cost of social or other non-pecuniary benefits, causing the returns of interventions to be understated.
We look forward to other researchers engaging with the currently available data and bringing new data to bear, such as archival documents from the “American Annals of the Deaf,” which included periodic surveys. We especially hope that future research can more richly explore the measurable effects of manual and oral instruction methods, which may have been relevant to temporal and geographic differences in literacy, employment, productivity, and social differences among the educated deaf population. Greater attention should also be given to the specific technological advances that affect deaf worker productivity and interactions with hearing counterparts as the US economy became increasingly commercial during the twentieth century. Finally, although our online supplementary material results found very similar patterns among people recorded as both deaf and black, there is still more granular detail to explore regarding integrated schools and the different race or sex-related constraints.
Supplementary material
To view supplementary material for this article, please visit https://doi.org/10.1017/ssh.2025.6
Acknowledgements
We acknowledge the work contained herein is our own, including all errors and omissions. Thanks especially to the invaluable feedback from anonymous referees, Kris Inwood, and Garett Jones.