

Publication bias of academic research occurs when publication decisions are based on criteria unrelated to research quality. A vast array of evidence suggests a prevalent publication bias that privileges statistically significant results, across the sciences (Franco, Malhotra and Simonovits Reference Franco, Malhotra and Simonovits2014; Brown, Mehta and Allison Reference Brown, Mehta, Allison, Jamieson, Kahan and Scheufele2017) including political science (e.g., Gerber, Green, and Nickerson Reference Gerber, Green and Nickerson2000; Gerber et al. Reference Gerber, Malhotra, Dowling and Doherty2010; Malhotra Reference Malhotra, Druckman and Green2021). One response has been to call for more replications—by which we mean emulating the extant study’s procedures but with new data drawn from the same population (Freese and Peterson’s Reference Freese and Peterson2017 “repeatability”). Replications can correct initial study publication bias and facilitate research transparency by forcing authors to make study materials public (e.g., Nosek et al. Reference Nosek2015). There have been a number of large-scale replication studies (Mullinix et al. Reference Mullinix, Leeper, Druckman and Freese2015; Open Science Collaboration 2015; Camerer et al. Reference Camerer2016, Reference Camerer2018; Coppock et al. Reference Coppock, Leeper and Mullinix2018; Coppock Reference Coppock2019) and ongoing debate about the existence of a “replication crisis” (c.f., Baker Reference Baker2016; Fanelli Reference Fanelli2018). Moreover, some journals, including those in political science, now invite the submission of replications and some even incorporate “replication” sections.Footnote 1
Yet, in political science, we have little sense of whether publication biases also exist when it comes to replications. Are replications less likely to be published than original studies? Do the same file drawer publication biases (i.e., privileging statistically significant results) documented in nonreplications exist with replication studies? Do other publication biases exist such that replications that contradict prior work are more likely to be published? Addressing these questions will allow us to assess whether replications can be an antidote to initial study publication biases and to isolate, and potentially vitiate, sources of biases in the replication literature.
We start, in the next section, with a brief motivation for our approach, as it differs from many extant studies of publication bias. We then present a basic model of publication decisions. The model incorporates a single original study and then a single replication attempt—both of which could be published (or not) as individual papers. We use the model to study how publication bias affects false-positive rates (FPR). We next estimate parameters of the model with data from a survey experiment conducted with political scientists. We find that: (1) counter to what one might expect, political scientists seem nearly as likely to recommend publishing a replication study as they would an original study (there is a statistically significant but substantively small difference); (2) there is a file drawer publication bias—a preference for statistically significant results—but that bias is smaller in replications than in original studies; and (3) there is a significant but not large bias toward preferring replication results that contradict original studies (what we call a “gotcha” bias). All of these findings bode well for the “replication movement,” but there is a catch. Small biases exist, and the aggregation of the biases inflates the number of false positives entering the literature. There is thus room for improvement and healthy debate about further reforms such as more replication sections in journals. There is also an incentive for scholars, as more replications enter the literature, to track the distinct types of publication biases we identify.
1 Our Approach to Studying Publication Bias
Detecting publication bias is difficult for at least two reasons. First, it involves making an inference about published studies relative to an unobserved set of unpublished studies. Do publication decisions, all else constant, depend on statistical significance? Approaches for answering that question include examining the relationship between published studies’ effect sizes and their amount of precision (e.g., funnel plot) and using forensic analyses to look for anomalous statistical patterns in published studies (e.g., caliper test, p-curve analysis) (see Malhotra Reference Malhotra, Druckman and Green2021). These methods face a second challenge, which is that they do not control for research quality.
Franco et al. (Reference Franco, Malhotra and Simonovits2014) introduce an approach that overcomes both challenges by tracking similar studies, some of which were published and some of which were not. They do this by using a set of high-quality experiments carried out by the Time-sharing Experiments for the Social Sciences (TESS) program (https://tessexperiments.org/). This program accepts proposed survey experiments, on a highly competitive basis, and then fields them on national probability samples in the United States. The program publicly posts all accepted projects and data collections, regardless of whether the results ever led to a publication. Franco et al. (Reference Franco, Malhotra and Simonovits2014) leverage the practice by comparing the publication rate of accepted TESS studies that vary in whether they achieved statistical significance. They find that overall studies with significant results are 40 percentage points more likely to be published than null results. Much of that bias stems from authors discontinuing the paper writing process upon discovering null results; when it comes to the set of papers that have been written, they find a roughly 5 percentage point bias toward significant results in the publication process (see Franco et al. Reference Franco, Malhotra and Simonovits2014, appendix, Table S2).
For us, the aforementioned problems are compounded by the reality that in many disciplines, including political science, a sizeable corpus of replication studies does not exist (see Christensen et al. Reference Christensen, Freese and Miguel2019, 164–165). For instance, in the Franco et al. data, none of the studies were explicit replications. A search of the TESS archives for projects in the years after those analyzed by Franco et al. (i.e., after 2012) suggests that only three projects are explicit replication studies. This prevents direct investigation of replication study publication bias à la the Franco et al. approach (i.e., there are not enough replication studies from TESS to explore publication bias among them). More generally, replication studies are a relatively recent phenomenon in political science. For instance, a content analysis of all experiments published in the American Political Science Review since its founding to May 2019 finds that only about 5% could be construed as general replications.Footnote 2 Also, the Journal of Experimental Political Science (JEPS) only began a special section for replications (see note 1) in 2019, and as of May 2020, had not yet accepted a paper for the section.Footnote 3 This suggests that there do not yet exist a sufficient number of published replication studies that would enable us to use one of the aforementioned methods (e.g., funnel plot, caliper test).
With these constraints in mind, we take a two-pronged approach. The first prong is a decision-theoretic model of the publication process that involves two studies: an original study and a replication study. The model facilitates the transparent and precise presentation of three distinct types of publication bias, two of which have gone unstudied. Further, it allows us to derive a metric (i.e., the actual false-positive rate [AFPR]) to look at the impact of each type of publication bias.Footnote 4 The model is a simplification of reality: it sets aside strategic considerations that may lead one to conduct a replication study in the first place as well as the decision calculus involved in deciding whether to subsequently proceed in writing a paper upon observing the results (that is, it assumes a paper is written).Footnote 5 While these are meaningful choices, our approach has the advantage of focusing on biases that emerge strictly from the publication process rather than scholars’ decisions, which could stem from misguided perceptions (e.g., a self-enforcing process where authors think nonsignificant results will not be published and thus they do not write such papers).Footnote 6 The model also collapses the stages of the publication process that, in theory, involve the author’s submission, the reviewers’ recommendations, and the editorial decision. The model therefore serves as a starting point or heuristic for studying replication study publication bias, which thus far has been virtually ignored.Footnote 7
The second prong in our approach involves a vignette survey experiment to empirically estimate the types of publication biases we define in the model. This is perhaps the only practicable approach given the aforementioned low volume of replication studies in many disciplines including political science. After all, one cannot empirically study publication bias in replications without a large number of replication studies. We believe it is best to start studying publication bias in replication studies now, rather than waiting years for a corpus of replications to emerge.Footnote 8 In sum, traditional approaches to studying publication bias do not straightforwardly apply to studying replication bias (at this time). Ours offers a viable method for establishing an understanding on which others can build.
2 Model of Publication Decisions
In our model, we consider three distinct types of publication bias. First, we examine the well-known file drawer problem (Rosenthal Reference Rosenthal1979). File drawer bias occurs if a positive test result (i.e., a statistical test that rejects the null hypothesis of no effect) is more likely to be published than a negative test result (i.e., a test that does not reject the null hypothesis), ceteris paribus.Footnote 9 In other words, the published record of research is skewed away from the true distribution of the research record, overstating the collective strength of positive findings. For example, if one of 10 studies shows that sending varying types of health-related text messages leads people to eat less fatty food, and only that one study is published, the result is a misportrayal of the effect of text messages. The file drawer bias reflects an entrenched culture that prioritizes statistical significance and novelty, as well as a funding system that rewards positive findings (Brown et al. Reference Brown, Mehta, Allison, Jamieson, Kahan and Scheufele2017). As mentioned, there is a large theoretical and empirical literature that documents this type of publication bias and its consequences in many disciplines including political science (Gerber et al. Reference Gerber, Green and Nickerson2000; Gerber and Malhotra Reference Gerber and Malhotra2008; Gerber et al. Reference Gerber, Malhotra, Dowling and Doherty2010; Franco et al. Reference Franco, Malhotra and Simonovits2014; Fanelli, Costas and Ioannidis Reference Fanelli, Costas and Ioannidis2017; Malhotra Reference Malhotra, Druckman and Green2021).
Second, we introduce and consider what we call a repeat study bias. This bias takes the following form: if two studies are identical, except one is original and the other is a replication, the first study is more likely to be published in the peer-reviewed literature, ceteris paribus. Suppose, for example, that two sequential studies that are identical in every way other than timing (e.g., they have the same design and sampling procedure) show that contact with people of different ethnicities reduces prejudice by 10%. These studies provide equivalent evidence, but only the first study is published. This type of repeat study bias has not received attention in the literature on publication bias; indeed, common definitions of publication bias focus exclusively on a study’s result, ignoring whether it is a replication or not (e.g., Brown et al. Reference Brown, Mehta, Allison, Jamieson, Kahan and Scheufele2017, 94). This repeat study bias would reflect a system where “incentives to publish positive replications are low and journals can be reluctant to publish negative findings” (Baker Reference Baker2016, 454).Footnote 10
On its face, repeat study bias may seem innocuous since it does not directly skew the scientific record from the true distribution of research results. Yet, it matters for two reasons: (1) it abates the weight of the aggregate evidence for or against a given phenomenon (and could affect meta-effect sizes in light of other publication biases discussed below) and (2) if repeat studies are published at a lower rate, this process could discourage researchers from engaging in replications. This, in turn, could facilitate the production of false negatives and false positives because results that happen by chance are not retested. As the social sciences continue to encourage replication, understanding repeat study bias is crucial, yet “little empirical research exists to demonstrate that journals explicitly refuse to publish replications” (Martin and Clarke Reference Martin and Clarke2017, 1).
The third type of bias is also one we introduce for the first time; it stems from the possibility that the process of replication itself could induce bias. We define a gotcha bias as occurring when a result in a replication study is more likely to be published when the result contradicts that of an existing prior study that tested the same hypothesis, ceteris paribus. That is, replications are more likely to be published if they overturn extant findings. The published record of research therefore overly emphasizes replications that run counter to existing findings, as compared to the true distribution of the research record. This differs from the file drawer bias since it is contingent on the outcomes of both the original study and the replication; it differs from the repeat study bias which is agnostic to the outcome of the replication study.
An example of the gotcha bias is as follows—there are 10 similar studies of text messaging effects that each purport to replicate corresponding previous studies, and they all find significant effects. Yet, nine of them are successful replications of the original studies that found equally significant results while one follows on a study that found a nonsignificant result. If only the latter study—that finds a significant effect contrary to a previous nonsignificant study—is published, the larger research community will observe a distorted portrayal of the research record.
The gotcha bias is a concept applicable to replication studies that collect new data in an attempt to replicate results of previous, original studies using similar study designs. The hypothesized mechanism behind this bias is again a proclivity for novelty and sensationalism. Some authors have alluded to a similar phenomenon, most notably the Proteus phenomenon that occurs when extreme opposite results are more likely to be published (Ioannidis and Trikalinos Reference Ioannidis and Trikalinos2005). Yet, we are the first (as far as we are aware) to formulate our discussion of this form of bias in the same positive–negative test result terms used to describe file drawer bias.
We employ a simplified model of the publication process in order to study the consequences of these three types of publication biases. We display the model in Figure 1. As explained, we recognize the model does not capture the full complexity of the scientific process. For example, it does not model the decision to write up results, and it does not explicitly distinguish authors’, reviewers’, and editors’ decisions about publication. Yet, the model serves as a useful heuristic for understanding replication and publication biases, and we will use it to identify a clear metric to assess the impact of publication bias.Footnote 11
A model of publication process with two stages.

The model starts with a null hypothesis (e.g., no treatment effect) as the true state of the world and proceeds as follows. (We consider a parallel model for the case where the null is false, as discussed in the Supporting Information.) Then, the “original study” tests the null hypothesis with the nominal type-I error probability of  $\alpha_1 $, based on a simple random sample of size N drawn from the target population. The result, whether (false) positive or (true) negative, is written up, goes through a peer-review process and is published, with probability p 1 for a positive result and p 0 for a negative result. The anticipated discrepancy between p 1 and p 0, such that p 1 > p 0, represents the file drawer bias (for the original study).
Next, only the published results from the first stage are subjected to replication studies, which we assume to be designed identically to the original study but conducted on a newly collected sample from the same population. With the type-I error rate of  $\alpha_2 $, the result is a (false) positive. The results are written up and then go through a peer-review process similar to the first stage, except that the publication probability now depends on test results from the current and previous stages (q 11, q 10, q 01, q 00). A repeat study bias would be present, for the case of a positive initial result, if p 1 > q 11, and for a negative initial result, if p 0 > q 00. A gotcha bias occurs if q 10 > q 00 (such that a negative replication result is more likely to be published when it contradicts a previous positive result than when it confirms an existing negative result) for insignificant replication results. Similarly, q 11 < q 01 represents a gotcha bias for significant replication results.
We realize not all published results will ever be replicated with fresh samples, even with the current push toward credible research. And, as suggested, researchers might strategically choose which existing studies to replicate and which replication results to write up and submit for review, given their perception of publication biases. But our goal here instead is to examine how the idealized model of replication science, as exemplified by the Open Science Collaboration’s widely discussed replication study of 100 psychology experiments (Open Science Collaboration 2015), would differ if we “perturbed” it by adding possible publication biases for each individual replication. What would have happened if the Open Science Collaboration had tried to submit each of the 100 experiments separately? Moreover, the model addresses the challenges discussed earlier insofar as it considers a set of published and unpublished studies, holding quality constant (Malhotra Reference Malhotra, Druckman and Green2021).
To study the consequences of the three types of publication biases, we consider the AFPR in replication results as a metric of evidence quality in published studies:
 $$ \begin{align*}\tilde{\alpha}_2 = \text{Pr}\ (\text{replication test significant} \vert \text{replication published, null is true}). \end{align*} $$
that the tests in replication studies are theoretically designed to achieve. However,  $\tilde{\alpha}_2 $ will diverge from their designed type-I error rate due to the three kinds of publication biases we consider. These biases could shape the scientific record in important ways. It is well known that when studied in isolation, the file drawer bias tends to inflate the FPR by disproportionately “shelving” negative results that correctly identify true null hypotheses (Rosenthal Reference Rosenthal1979). However, the effects of the other two types of biases—the repeat study bias and the gotcha bias—have not been documented, let alone the effect of file drawer bias when these other biases are also present.
Our model allows us to study the concurrent effects of these three types of publication biases on various indicators of evidence quality, such as the AFPR.Footnote 12 In the Supporting Information, we provide an exact mathematical expression for  $\tilde{\alpha}_2 $ as a function of our model parameters and investigate the net effects of the three kinds of biases. Our analysis (in the Supporting Information) reveals that the effect of one type of bias is contingent on the other two biases as well as other model parameters. For example, we find that an increase in file drawer bias can affect the overall deviation of the AFPR from the desired FPR either positively or negatively, depending on the size of the other two biases. Gotcha bias can also either increase or decrease the AFPR depending on the other biases.Footnote 13 Importantly, our model of the publication process enables the calculation of implied AFPR values given a set of assumed publication probabilities as well as significance levels for the hypothesis tests. In the rest of the paper, we draw on an original large-scale survey experiment to illustrate this exercise with empirical data on publication probabilities for different types of hypothetical studies.
3 Survey Experiment
To illustrate how our model can shed light on publication biases, we conducted a (conjoint) vignette survey experiment. Our goal is to estimate the amount of file drawer bias, repeat study bias, and gotcha bias. We also seek to display how these biases influence the AFPR.
Our population consists of all political science department faculty at Ph.D. granting institutions based in the United States. The Supporting Information contains a description of our data collection procedure and a demographic portrait of our respondents. Political scientists make for an intriguing sample since discussions of open science and replication are certainly ongoing (Lupia and Elman Reference Lupia and Elman2014; Monogan Reference Monogan2015) but, in some sense, are more emergent than in other disciplines, particularly psychology and to some extent economics (e.g., Christensen et al. Reference Christensen, Freese and Miguel2019). This may increase the experimental realism of the study, with respondents being cognizant of possible biases but not so ingrained in debates that they would be guarded in how they responded to our survey.
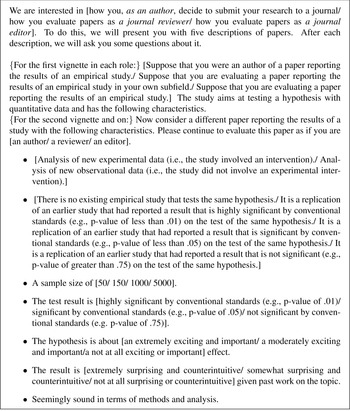
We sent participants a link where they were provided with a set of vignettes that described a paper (on the validity of using vignettes, see Hainmueller, Hangartner and Yamamoto Reference Hainmueller, Hangartner and Yamamoto2015). Each respondent was provided with five different vignettes, each concerning a single distinct paper that has been written. We asked respondents to act as if they were an author and asked whether they would submit the paper to a journal. Respondent then received other five vignettes where we asked them to play the role of a reviewer. Here, we asked whether they would recommend the paper be published. Finally, we asked whether the respondent had ever edited a journal. If the respondent had, we provided five additional vignettes. These vignettes asked the respondent whether he or she would publish the paper (as an editor).
Each vignette randomly varied a host of features, most importantly, the statistical significance of the results and whether the study is an original study or a replication study (and if replication, whether the results of the original study were statistically significant). It also provided (randomly assigned) information about whether the study involves experimental or observational data, the sample size, whether the hypothesis is exciting/important, and whether the results are surprising. Prior work suggests these factors are meaningful for replication studies (Open Science Collaboration 2015, aac4716–2); they also provide respondents with more details about the study and prevent us from overinterpreting the impact of statistical significance and replication status. Finally, we told respondents that the study is “seemingly sound in terms of methods and analysis.” This keeps constant research quality, discouraging respondents from interpreting statistical significance as an indicator of the quality (Malhotra Reference Malhotra, Druckman and Green2021). Figure 2 presents the vignette with all possible variations indicated in square brackets.
Experiment vignette. The phrases in square brackets separated by slashes represent alternative texts that are randomly and independently assigned for each vignette.

After each vignette, we posed a question for our main outcome variable. For example, for the reviewer conditions, we asked “If you were a journal reviewer on this paper, what is the percent chance you would recommend publication of this paper (assuming no new data can be collected)?” The author and editor versions asked analogous questions. In sum, our experimental set-up has the crucial advantage of holding study quality constant and can isolate the impact of statistical significance in original and replication studies on publication decisions and the AFPR.
We focus our analyses on the treatment variations that have direct bearing on our model parameters (i.e., statistical significance and whether the study was an original or a replication study). Setting aside variations in other factors (e.g., if the hypothesis is “exciting”) does not cause bias in our estimates because they are randomized independently of our main factors. We present main effect and moderating results regarding the other factors in Supporting Information. There we show that the other variables have predictable effects. In particular, experimental data, larger sample sizes, exciting hypotheses, and surprising results all increase the likelihood of publication. These findings validate the experimental realism of our study. Furthermore, these factors show only minor moderating effects for our main findings reported below.
Also, notably, we recognize one must be cautious in interpreting the effect magnitude of a given factor. Respondents may overstate the extent to which they would submit or accept nonsignificant results due to recent prominent discussions about publication bias (e.g., Brown et al. Reference Brown, Mehta, Allison, Jamieson, Kahan and Scheufele2017; Malhotra Reference Malhotra, Druckman and Green2021)—that may make it desirable to support nonsignificant findings. That said, our interest lies in comparisons between scenarios (e.g., significant versus nonsignificant) rather than the baseline magnitudes; generally, conjoint experiments minimize social desirability bias by allowing for multiple comparisons across versions (Horiuchi et al. Reference Horiuchi, Markovich and Yamamoto2020).
4 Results
4.1 Estimating Three Types of Publication Bias
We begin by asking how much evidence our data shows of each of the three types of publication biases: file drawer bias, repeat study bias, and gotcha bias.Footnote 14 Figure 3 presents the average percent chance of taking an action toward publication (e.g., sending out a paper as an author, recommending publication as a reviewer, and supporting publication as an editor) that the respondents allotted different types of hypothetical papers described in our randomly generated vignettes, along with 95% confidence intervals (CI). Here, we pool the author, reviewer, and editor conditions in our analysis; the results broken down for these roles are provided in the Supporting Information, and in each case, the results echo those we present with the data merged (i.e., our findings are substantively unchanged with respect to publication bias). We also combine the two conditions in which test results are described as statistically significant (i.e., 0.01 or 0.05 level) into a single category in our analysis (the results are robust to not merging these conditions).
Evidence of three types of publication bias. In each plot, the solid dot represents the estimated probability of a respondent taking an action in favor of publishing the hypothetical study for a given combination of study characteristics indicated at the top and bottom. The vertical bars represent 95% confidence intervals.

We begin with the file drawer bias in original studies; these results are presented in the left panel of Figure 3. While respondents, on average, indicated a 67.1% chance of submitting, recommending, or supporting a paper with a significant test result ([65.6%, 68.7%]), they gave only a 45.2% chance of doing the same for an identical paper with a nonsignificant finding ([43.6%, 46.9%]). Thus, as others have shown (e.g., Franco et al. Reference Franco, Malhotra and Simonovits2014), a large file drawer bias exists in original studies (i.e., approximately 21.9 percentage points). On the one hand, our effect is smaller than the overall 40 percentage points reported by Franco et al. (Reference Franco, Malhotra and Simonovits2014) but larger than the effect they find contingent on a resulting paper (i.e., a paper being written), which, as noted above, is just 5 percentage points.Footnote 15
Our results further show that replication studies are subject to the same kind of file drawer bias as the original research studies. These results are presented in the right panel of Figure 3. Combining both originally significant and insignificant test results, respondents reported a 62.5% chance of moving a significant result in a replication study toward publication ([61.3%, 63.8%]), whereas they only gave a 44.1% chance for a nonsignificant replication result ([42.6%, 45.5%]). Thus, regardless of whether a replication study “succeeds” or “fails” to reproduce the original finding, replication is more likely to be published when its result is statistically significant than when it is a null finding. That said, this difference of roughly 18.4 percentage points is significantly smaller than the file drawer bias in original studies (t = −2.95, p < 0.00). Thus, there exists a file drawer bias in replication studies, but it differs in size from the file drawer bias in original studies.
We next turn to the repeat study bias. Respondents indicated a 61.2% chance of moving a significant replication result that successfully reproduces an earlier significant finding toward publication ([59.6%, 62.7%]). This represents a 5.9 percentage point drop compared to the probability for an original significant result, which is statistically significant (t = 6.32, p < 0.00). Similarly, respondents indicated only a 39.1% chance of submitting, recommending, or supporting publication of an insignificant replication test result that confirms a previously nonsignificant finding ([37.3%, 40.9%]), a 6.1 percentage point decrease (t = 5.99, p < 0.00) from the probability of doing the same for an original insignificant result. Thus, we find clear evidence of a repeat study bias, a distinctive and previously unstudied type of publication bias. That said, the file drawer bias dramatically dwarfs the repeat study bias: there is some but not a substantial bias against publishing replication studies as a general rule. Political scientists seem to be quite open to the publication of replication studies.
Finally, turning to gotcha bias, our results show evidence that this more subtle form of publication bias occurs in replication studies. Respondents assigned a 49.1% chance of submitting, recommending, or supporting publication of an insignificant test result ([47.3%, 50.8%]) when the study fails to replicate an earlier significant test result, compared to only 39.1% when it successfully replicates a previously nonsignificant finding. This 10 percentage point difference reveals a potentially pernicious form of replication study bias where contradicting extant knowledge is privileged, holding research quality constant. Likewise, respondents indicated a 63.9% chance of making a decision in favor of publishing a replication test result when that replication finds a significant effect which runs contrary to a previous insignificant test result of the same hypothesis ([62.4%, 65.4%]). This percentage drops to 61.2% for a significant replication result that successfully reproduces an earlier significant finding, a small but statistically significant decrease of 2.6 percentage points (t = −2.92, p < 0.01). Thus, for replication studies, there is an increased probability of supporting publication of contradictory results in either direction; scholars privilege the publication of replication studies that overturn extant results. Importantly, however, the gotcha effect only goes so far: even at the replication stage, the standard file drawer bias exerts much more influence. Replication results that find statistically significant effects are more likely to move toward publication than insignificant results, no matter what the original results may be.
In sum, our results echo a large literature that reveals file drawer publication bias in original studies. But, we also identify two new types of publication biases that occur with regard to replication studies. One the one hand, that these two biases do not rival the size of the file drawer bias bodes well for the potential corrective nature of replication studies. On the other hand, that these biases still do exist along with the file drawer problem at the replication stage accentuates the need for institutional efforts to vitiate all three types of biases.
Estimating Actual False-Positive Rates
In addition to estimating the three types of publication biases, our survey experiment data allow us to make inferences about the key metric of evidence quality: the AFPR. Here, we provide our estimates of the AFPR in replication studies for a nominal 0.05-level significance test. We calculate these estimates using our model-based formula, as well as the publication bias estimates based on the vignette data. We display the estimates in Figure 4.
Estimates of actual false-positive rate for published replication study results. The solid dots represent the estimated AFPR for all published replication results (left), published replications of originally insignificant results (middle), and published replications of originally significant findings (right) based on the vignette survey data, assuming the nominal FPR (i.e., the alpha level) of 0.05 for the significance tests. The vertical bars represent 95% confidence intervals.

Consider a published study that tries to replicate an earlier published study by testing the same hypothesis with a new sample at the 0.05 significance level. The estimated AFPR for such a replication test ( $\tilde{\alpha}_2$) is 0.078 (95% CI = [0.074, 0.081], left plot) based on our vignette data. That is, the net effect of the file drawer bias, gotcha bias, and repeat study bias turns out to be a 2.8 percentage point inflation of the AFPR compared to the nominal type-I error rate for which the replication test is designed. Publication biases thus lead to an overrepresentation of false positives in the published body of replication evidence.
To better understand how publication bias affects the AFPR of replication tests, we also estimate the AFPR conditional on whether the original result was statistically significant. The result reveals a clear dependence of the AFPR on different types of publication biases. If the original study failed to reject the null hypothesis, the AFPR for its replication test is estimated to be 0.079 (95% CI = [0.076, 0.083], middle plot), an estimate similar to but slightly larger than the overall AFPR estimate. This is because both the file drawer bias and the gotcha bias operate in the same direction under this scenario: both types of biases make the positive replication result more likely to be published than in the absence of publication bias. In contrast, if the original study rejected the null hypothesis, the estimated AFPR for the replication result drops to 0.062 ([0.059, 0.064], right plot), a value much closer to the nominal FPR of the test. This 0.016-point decrease occurs because the gotcha bias partially offsets the upward pressure caused by the file drawer bias for the replication result. That is, the file drawer bias increases the probability that a false-positive replication result is published, but the gotcha bias counteracts this effect (i.e., it makes the result less likely to be published compared to the case where the false-positive result was a surprise). The bottom line is that our data suggest that replications are not a panacea to correct the scientific record—publication bias in replication studies leads to an AFPR that exceeds what would occur by chance, even in the best possible scenario. That said, the inflation of AFPR is not as large as one may have suspected.
5 Conclusion
For many, replication is a hallmark of scientific progress. The recent so-called “replication crisis” has accentuated the role of replications and generated much discussion about how replications should be conducted. Yet, virtually no attention has been paid to how publication biases manifest in the case of replications. This is a crucial question given the extent to which such biases can skew accumulated knowledge. A challenge to studying publication bias in replication studies is that extant methods for detecting publication bias have not considered the additional types of biases we introduced, and, regardless, in many disciplines including political science, there does not yet exist a sufficiently large corpus of replication studies to explore bias. We thus introduced an alternative approach using a model and survey experiment. While we recognize limitations in the approach, it allowed us to offer novel insights regarding how to think about publication bias in replication studies—differentiating three types of biases including the file drawer bias, the repeat study bias, and the gotcha bias. The latter two types of bias have not previously been considered. We also were able to offer initial estimations of the extent of these biases.
Overall, the results show that each of these biases exists. From one perspective, our results may seem sobering. Publication biases are notable and, in the aggregate, skew the number of false positives entering the literature. Moreover, the two new types of publication biases we identify—the repeat study bias and the gotcha bias—are present. From another perspective, however, our results could be seen as reassuring. The bias against replication studies, all else constant, is present but not large, the file drawer problem in replication studies is smaller than that in original studies, and the gotcha bias also is not as large as one may have expected. In short, scholars seem open to replications, and this is auspicious for the replication movement.
We believe our results highlight several ways forward. There is of course the question of why we do not see more replications in the published literature given the relatively small estimate of our repeat study bias. The answers likely stem from a variety of sources. First is the existence of a file drawer bias in replication studies, which while smaller than that in original studies, is still nontrivial (18.4% in our data). The second is the recency of the replication movement within the discipline. Third is a possible self-enforcing dynamic such that scholars may anticipate a larger repeat study bias than might actually exist and thus do not replicate studies.
We recognize scholars may be reticent to take our results from a survey experiment as definitive. Indeed, we strongly encourage scholars to investigate the magnitude of each type of bias in the actual production and submission of papers. This will become increasingly possible as more replications enter the literature and we have good reason to think that will occur. For example, a search on “replication” in the Evidence in Governance and Politics (EGAP) registry yields nearly 40 studies, with about half coming from the last 2 years. These projects likely will enter the published literature in the near future. The new JEPS replications section and other journals that may incorporate similar initiatives also will facilitate replications. There also are some large-scale replication projects such as the Center for Open Science’s Systematizing Confidence in Open Research and Evidence (SCORE) program. This involves replicating hundreds of prior claims across the social sciences. Also, there is EGAP’s Metaketa Initiative that involves replicating studies across contexts (e.g., Dunning et al. Reference Dunning, Grossman, Humphreys, Hyde, McIntosh and Nellis2019).Footnote 16 It will be crucial to monitor the actual fate of replication study submissions to assess whether our small repeat study bias finding reflects actual behavior (a la the open science push) or is an overstatement (reflecting a desire to self-report but not enact open science initiatives).
Our framework offers guidance on how to explore publication bias going forward, making clear that one need not only attend to file drawer bias but also repeat study bias and gotcha bias. Isolating these biases not only helps to assess the production of knowledge, but also allows researchers to gain a handle on the incentives and hurdles that evolve as researchers move toward replicating more work. We emphasize too that while some subfields are more amenable to the type of replication on which we focus (involving the collection of new data) than others, the basic logic of the model may carry over to cases of reproducibility (i.e., reanalyzing extant data).Footnote 17
Another avenue for future work concerns other aspects of the research process. We explained the advantage of not dealing with the processes by which scholars decide to pursue replications and/or write-up results. These involve complicated decision about career incentives and time investments. We have suggested that the lack of replications may stem partially from a self-enforcing process where authors do not purse them—the same can be said for the lack of null results (Franco et al. Reference Franco, Malhotra and Simonovits2014) and other biases in the publication process such as gender bias (Teele and Thelen Reference Teele and Thelen2017, 443). Clearly, more work needs to unravel how scholars make these decisions.
The aforementioned choices clearly reflect anticipation of professional incentives and policies. Journals and institutions might encourage meta-replications projects such as the ones that have received some attention by aiming to replicate a large set of studies (e.g., Mullinix et al. Reference Mullinix, Leeper, Druckman and Freese2015; Open Science Collaboration 2015; Camerer et al. Reference Camerer2016, Reference Camerer2018; Coppock Reference Coppock2019). This is a way to dampen some of the publication biases. To see why, consider that the aforementioned Open Science Collaboration (2015) replicated just 36% of initially statistically significant results from 100 previously published psychology experiments. Few papers have generated as much discussion and debate (e.g., Anderson et al. Reference Anderson2016; Gilbert et al. Reference Gilbert, King, Pettigrew and Wilson2016); yet, according to our results had each of the 100 attempted replications been submitted individually, more than half might not have been published. These undertakings are large, however, and require institutional and individual investments that are nontrivial. Moreover, even these large-scale attempts could be subject to bias. One could wonder whether the aforementioned psychology replication would have received as much attention had the replication rate been closer to 95%. Regardless, these large-scale efforts also require that authors make the study materials and details easily accessible (Nosek et al. Reference Nosek, Ebersole, DeHaven and Mellor2018). One related approach is to encourage more self-replications where authors make an effort to replicate their own work (Janz and Freese Reference Janz and Freesen.d.).
Of course, the reality is that altering incentives and behaviors are not easy: researchers, like everyone else, exhibit confirmation biases (Bollen et al. Reference Bollen, Cacioppo, Kaplan, Krosnick, Olds and Dean2015) that lead them to privilege the preconception that statistical significance is critical and that original work is more important than replication. In terms of the former, one approach is to institutionalize results-blind review where papers are assessed sans the results.Footnote 18 For replications, the most straightforward solution would be to have more journals offer brief sections devoted strictly to replications, as many perceive journals as unwelcoming for replications (Martin and Clarke Reference Martin and Clarke2017, 3). As mentioned, some journals have already done this, and one additional innovation in light of budgetary constraints is that this section could be published online but still listed in the printed table of contents (as is done, e.g., in the Journal of Experimental Psychology: General) (also see Coffman et al. Reference Coffman, Niederle and Wilson2017). In the end, publication biases will continue to be a barrier to scientific progress: there is not an easily implemented fix. As scientific communities explore different approaches, however, it would be beneficial to account not only for the classical file drawer bias in original studies but also publication biases that occur at the replication stage.
Data Availability Statement
The replication materials for this paper can be found at Berinsky et al. (Reference Berinsky, Druckman and Yamamoto2020).
Supplementary Materials
To view supplementary material for this article, please visit http://dx.doi.org/10.1017/pan.2020.34.
Acknowledgments
We thank Michelle Bueno Vásquez, James Dunham, Shiyao Liu, Chris Peng, Robert Pressel, Blair Read, Jacob Rothschild, and Anna Weissman for research assistance. We are grateful to John Bullock, Donald Green, Melissa Sands, the editor, and anonymous reviewers, and the participants at the 2017 Conference of the Society for Political Methodology and the 2018 Midwest Political Science Association Annual Meeting for useful comments and suggestions. Yamamoto developed and analyzed the model, and designed and performed the statistical analysis. All three authors designed and implemented the empirical study, interpreted the results, and wrote the paper.