Implications
Animal temperament is a trait that exerts a marked influence on the beef production system in tropical regions, because the management applied on the herds has direct repercussions on the profitability of the enterprises. Given the categorical nature of the temperament scores (T) and their asymmetric distribution, two statistical models were applied to study this trait in cattle, with the aim of assessing the differences and possible advantages of using a threshold model compared with a linear model for estimating variance components. The two models produced similar estimates of genetic parameters, classification of animals based on estimated breeding values (EBVs) and accuracy of the EBVs. The variability observed for T and the favorable association of this score with weaning weight, a trait related to maternal ability, support the inclusion of T as a selection criterion for the breeding program.
Introduction
Cattle temperament influences the productive potential of animals because of its correlation with their performance and its relationship with aspects that facilitate management activities and the welfare and safety of animals and employees. The importance of beef cattle temperament in production systems is widely recognized.
According to Burow (Reference Burrow1997), temperament is defined as a behavioral response of cattle to handling by humans. Reactivity is one of the main ways to show this response, and reactivity to humans can be affected by previous experiences of an animal toward humans, like fear (Adamczyk et al., Reference Adamczyk, Pokorska, Makulska, Earley and Mazurek2013). Although fear is crucial on the responses toward potentially dangerous situations, excessive fear may also lead to develop chronic stress that could affect several behavioral traits, such as social, sexual and parental relationships, and decrease the performance traits in cattle (Forkman et al., Reference Forkman, Boissy, Meunier-Salaun, Canali and Jones2007).
Several methods for measuring cattle temperament are used, including restrained and non-restrained tests, dairy cow scoring system, dominance tests, free movement test and assessment of maternal temperament (Burrow, Reference Burrow1997). Among them, the restraint tests, the open field test, the fear of humans tests and flight distance were the most appropriate to assess individual responses in cattle (Adamczyk et al., Reference Adamczyk, Pokorska, Makulska, Earley and Mazurek2013).
Therefore, it is necessary to use appropriate statistical models to correctly evaluate this trait in animal breeding programs that adopt temperament as a selection criterion. Several studies have reported heritability estimates for temperament scores in cattle ranging from 0.13 to 0.40 (Burrow, Reference Burrow2001; Kadel et al., Reference Kadel, Johnston, Burrow, Graser and Ferguson2006; Barrozo et al., Reference Barrozo, Bukansas, Oliveira, Munari, Neves and Queiroz2012); linear models were used in most of these studies to estimate the genetic parameters. However, given the categorical nature of temperament scores and their asymmetric distribution, it is possible that some assumptions, such as the normality and homoscedasticity of residuals, would not be met when analyzing this trait using linear models. Thus, it would be important to assess the differences and possible advantages of applying statistical models involving assumptions that are more suitable for genetic analysis in such a context, such as threshold models (Gianola and Foulley, Reference Gianola and Foulley1983). The present study aimed to estimate genetic parameters associated with temperament scores in Nellore cattle, including the genetic correlation of this trait with weaning weight, using two different two-trait animal models (linear-linear and linear-threshold models).
Material and methods
Animals and data
This study used temperament score (T) and weaning weight (WW) data from Nellore cattle born between 1994 and 2012, originating from 110 herds located in the western and central regions of Brazil and maintained under tropical conditions. The data were collected and provided by the PAINT® breeding program of the CRV Lagoa (2013). This company includes productive and reproductive traits and visual scores in its selection index. The feeding system adopted in these farms consisted basically of tropical pastures and water ad libitum. They received mineral salt throughout the year and, in some cases, protein salt in the dry season. Each year, mating occurred in the rainy season, usually from December to February, through artificial insemination or natural service, and the calves were weaned during the dry season (from May to July).
Description of the studied traits
WW was measured when the animals were ~8 months old (mean=238.7±27.7 days, median=239.00 days). Calves, grouped by birth month, sex and the carrying capacity of the pastures, were subjected to feed and water fasting for 12 to 14 h and then weighed and evaluated to obtain visual scores for their conformation (C), precocity (P), muscling (M) and navel (N). After genetic evaluation, calves that were considered inferior at weaning were culled, at a proportion of ~50% for males and 20% for females. Temperament was assessed in yearlings between 15 and 18 months of age through a restraint test that assigned scores to an individual considering grade classes of 1 to 4. The score was assigned immediately after the animal had exited the scale, when it was let loose alone in a section of the corral with the person in charge for the evaluation. The evaluator tried not to interfere with the animal and/or the environment, and the score assessment took around 2 min per animal. This evaluation was carried out following the procedure described by Barrozo et al. (Reference Barrozo, Bukansas, Oliveira, Munari, Neves and Queiroz2012), such that the animals had their temperament classified according to:
-
1. The animal is gentle, quiet and easy to handle, is not bothered by the environment of the corral or human presence, does not seek to escape and moves slowly and quietly.
-
2. The animal is not bothered by the environment of the corral or human presence, does not seek to escape and moves with agility, without presenting sudden movements. The animal is aware of the environment and what occurs around it but shows no aggression.
-
3. The animal is agitated, bothered by the environment of the corral and human presence and searches for a way to escape but does not attempt to break or jump over the fence of the corral. The animal moves with agility, presents sudden movements and is aware of the environment and what occurs around it but shows no aggression.
-
4. The animal is aggressive and tries to reach the human, is bothered by the environment of the corral and human presence and presents agile and sudden movements. The animal is aware of the environment and what occurs around it and attempts to break the fence of the corral (CRV Lagoa (2013)).
Data editing and contemporary groups
Contemporary groups (CGs) were formed at birth, at weaning and at yearling age. The contemporary groups at birth (CGb) included the following information: breeder, year of birth and sex. For contemporary groups at weaning (CGw), information regarding the CGb, weaning farm, weaning management group and date of weaning were considered. For contemporary groups at yearling age (CGy), information on the CGw, yearling farm, yearling management group and yearling evaluation date were concatenated. The following data were excluded from the database: CGs consisting of offspring from a single bull and/or with less than four animals and data on progeny of bulls with <10 offspring. In the case of CGy, groups showing no variability in temperament were also excluded to avoid the extreme category problem (Misztal and Gianola, Reference Misztal and Gianola1989) in the genetic analysis of this trait. After data editing and elimination of inconsistent data, the total numbers of contemporary groups considered in the analysis were 6143 for CGw and 5808 for CGy. The mean number of animals was 37 for CGw and 33 for CGy.
Statistical analyses and models
Variance components for temperament and WW were estimated using the following two-trait animal model: a linear-linear model (model 1) and a linear-threshold model (model 2), given the categorical nature of T. In addition to allowing the correlations between T and WW to be estimated, including WW in the model analyzing T would allow the possible effects of sequential selection at weaning to be reduced. In model 1, the following effects were considered as fixed effects for WW: CGw and the covariates weaning age, linear (L) and quadratic (Q) effects, age of the cow at calving (L and Q) and Julian date of birth (L, Q and cubic). The following random effects were also considered in this model: direct additive, maternal additive, permanent maternal environmental and residual effects. The fixed effects included in the analysis of T were Cgy and the covariates age of the yearling (L and Q) and age of the cow at calving (L and Q), and the random effects comprised additive and residual effects.
Model 1 can be described by the following equation:
 $$\bf Y={\bf X}\beta {\plus}{\bf Z}_{\bf 1} a{\plus}{\bf Z_{2}} m{\plus}\bf Wc{\plus}e$$
where Y is the vector of observations for WW and temperament; β the vector of fixed effects and covariates; a the vector of random direct additive genetic effects; m the vector of random maternal additive genetic effects; c the vector of random permanent maternal environmental effects; and e the residual effects. X, Z
1
, Z
2
and W are incidence matrices relating the elements β, a, m and c, respectively, to vector Y. It is assumed that a~MVN
 $$\left( {{}_{0}^{0} ;GA} \right)$$
, m~MVN
 $$\left( {{}_{0}^{0} ;MA} \right)$$
, c~N (0,PI) e~N (0,RI). Following this notation,
 $$G=\left[ {\matrix{ {\sigma ^{2} _{{\,\,11}} } & {\sigma ^{2} _{{\,\,12}} } \cr {\sigma ^{2} _{{\,\,12}} } & {\sigma ^{2} _{{\,\,22}} } \cr } } \right]$$
is the covariance matrix of the direct additive effects; σ
2
11, σ
2
12 and σ
2
22 are the additive variance for WW, the additive covariance between WW and T and the additive variance for T, respectively; A is the matrix of numerators for kinship coefficients; I represents an identity matrix of the appropriate order; and M and P represent the covariance matrices for maternal additive effects and maternal permanent environmental effects between WW and T, respectively, which include non-zero elements only in the case of variances relative to WW.
 $$P\:\left[ {\matrix{ {\sigma ^{2} _{{\,\,p11}} } & 0 \cr 0 & 0 \cr } } \right]$$
is the matrix of (co)variances between maternal permanent environmental effects for WW and T, and
 $$R\:\;\left[ {\matrix{ {\sigma ^{2} _{{\,\,e11}} } & {\sigma ^{2} _{{\,\,e12}} } \cr {\sigma ^{2} _{{\,\,e21}} } & {\sigma ^{2} _{{\,\,e22}} } \cr } } \right]$$
is the matrix of (co)variances between residual effects for WW and T.
In model 1, maternal effects were only estimated for WW. In this case, it is assumed that the covariance between additive and maternal genetic effects was equal to 0, as the data structure did not allow this parameter to be estimated adequately. This was the case because performance information for WW was not available for some of the cows, and performance information for maternal grandprogeny was not available for many bulls. Estimates of restricted maximum likelihood (REML) for variance components in model 1 were obtained using AIREMLF90 software (Misztal, Reference Misztal2013). Concerning model 2, the two-trait animal model included the same effects described for model 1, but assumed a linear model for WW and threshold model for T (thus, it was linear-threshold model). As T was defined through ranked and mutually exclusive categories, the assumed model includes a set of three thresholds (t1, t2 and t3) corresponding to the values in the underlying scale (under the assumption that t0=−∞ and t4=∞), such that if Y<t1, T=1; if t1<Y<t2, T=2; if t2<Y<t3, T=3; and if Y>t3,T=4. Variance components were estimated via Bayesian inference using THRGIBBS1F90 software (Misztal, Reference Misztal2013). Under model 2, three chains of 200 000 iterations were generated in parallel, and the samples were saved every 50 iterations. Non-informative a priori distributions were defined for all effects and genetic variances. The initial values of each chain were set such that they were generated from points that were widely dispersed in the parameter space, as recommended by the Gelman and Rubin (Reference Gelman and Rubin1992) test, which was used to diagnose convergence.
Pearson’s and Spearman’s correlations and estimated accuracies between different models
To provide a comparative evaluation of the predictions obtained using the two models, the association between EBVs for temperament was tested considering all of the animals in the data file, the best 20% of animals (defined using model 2 as the standard) and the best 20% of bulls, using Spearman’s correlation (rank correlation). The percentages of agreement in the classification for all bulls present in the data file, bulls showing > 70% accuracy and bulls showing 70% or less accuracy for temperament EBVs were also used to compare models 1 and 2 considering the agreement in the EBVs ranking among the top 20% and among the 20% worst bulls, as well as Pearson’s and Spearman’s correlations between animal EBVs from these groups. Estimated accuracies of the EBVs for bulls and cows were also calculated to compare the different models. These accuracies were based on estimates of the variance of the prediction error or the standard deviation of the marginal posterior distribution of EBVs under models 1 and 2, respectively.
Results
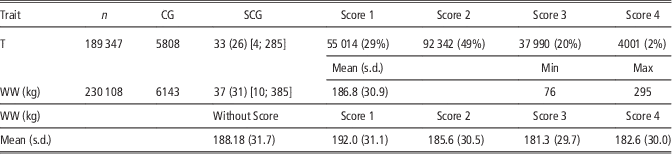
Approximately 78% of the animals received scores of 1 and 2, indicating that the studied population generally consisted of animals with a milder temperament. The number of observations for WW was greater than that for the measurements of T, which also resulted in a slightly larger mean size of GCw for WW (Table 1). This finding is due to the exclusion of inferior animals before becoming yearlings on some farms, the period when T values were collected and the fact that T began to be evaluated in this program after the collection of weight data had begun. There was a decreasing concentration of T scores corresponding to classes 2, 1, 3 and 4, respectively.
Descriptive statistics for the data set used to estimate variance components for temperament (T) and weaning weight (WW) in Nellore cattle

n=number of observations; CG=number of contemporary groups; SGC=mean number (standard deviation, in parentheses), [minimum and maximum, in brackets] for animals in each contemporary group; Score 1 to Score 4 for T=number (percent of total in parentheses) of animals in each temperament score class; Mean, (s.d.), Min and Max=mean, standard deviation, minimum and maximum values for observations of WW, respectively; Score 1 to Score 4 for WW=Mean and (s.d.); Without Score=Mean and s.d. of animals not measured for T score.
Estimates of variance components and the heritability of T and WW
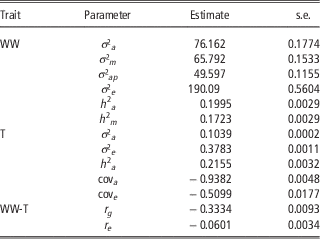
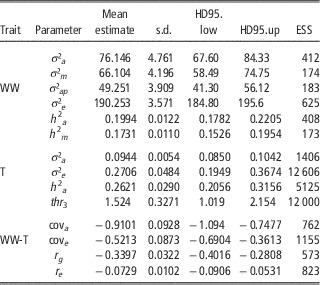
Under the linear-linear model (Table 2), the estimated heritability for temperament was of a moderate magnitude (0.22±0.0032) and was near the mean of the posterior marginal distribution estimated for this parameter under the linear-threshold model (0.26) (Table 3). This result was not unusual because the same fixed and random effects were included in both models. Moreover, the structure of the correlations between T and WW may have contributed to the similarity in the obtained genetic parameter estimates, because WW was analyzed under a linear model in models 1 and 2. The direct heritability estimated for WW was moderate (0.20) in both models. However, the maternal effect had considerable influence because at this stage the calf depends greatly on the mother.
Estimates of variance components and genetic parameters for weaning weight (WW) and temperament score (T) of Nellore cattle obtained via restricted maximum likelihood using a linear-linear model

σ² a , σ² m , σ² ap , σ² e =estimates of direct additive genetic, maternal additive genetic, maternal permanent environmental and residual variances, respectively; h 2 a and h 2 m = estimates of direct and maternal heritability, respectively; cov a and cov e : estimates of genetic and residual covariance between WW and T, respectively; r g and r e =estimates of genetic and residual correlation coefficients, respectively.
Marginal posterior distributions of the variance components and genetic parameters for weaning weight (WW) and temperament score (T) of Nellore cattle obtained via Bayesian inference under a linear-threshold model

σ² a , σ² m , σ² ap , σ² e =estimates of direct additive genetic, maternal additive genetic, maternal permanent environmental and residual variances, respectively; h 2 a and h 2 m =estimates of direct and maternal heritability, respectively; thr3=threshold separating categories 3 and 4 for T (the first two thresholds were set at 0 and 1, respectively); Mean estimate and s.d.: mean and standard deviation of the estimates for the marginal posterior distribution; cov a and cov e =estimates of genetic and residual covariance between WW and T, respectively; r g and r e =estimates of genetic and residual correlation coefficients, respectively; HD.low and HD.up=lower and upper limits of the credibility interval at a 95% confidence, respectively; ESS=effective sample size.
Genetic correlations between weaning weight and temperament score and rank correlation between temperament EBVs and accuracies
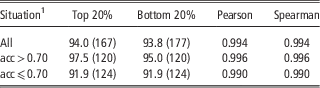
The genetic correlation coefficients between T and WW estimated by both models used in this study were similar, such that the REML estimates and means of the marginal distribution for these parameters were approximately −0.33. Although such values are weak, the coefficients were in a favorable direction, suggesting a desirable relationship between the studied traits, in the sense that more docile animals exhibit higher weights compared with those with a more agitated temperament. The rank correlation estimates of the EBVs for temperament (defined using model 2 as the standard), considering the two-trait analyses, were above 99%: at 0.992 for all animals, 0.994 for the best 20% of animals and 0.975 for the best 20% of bulls. When only bulls were considered, the percentage of agreement in the classification of EBVs for T by the two models was also very high and very similar when ranking the top 20% and the worst 20% of bulls, at 94.0% and 93.8%, respectively (Table 4). As expected, among the bulls with EBVs with >70% accuracy, the percentage of agreement was higher for both the best 20% (97.5) and the worst 20% of bulls (95.0%) compared with the 20% of bulls showing EBVs with accuracies of ⩽70% (91.9% for both groups). Pearson’s and Spearman’s correlations between the EBVs of bulls predicted by the two models were close to 1 (Table 4). Considering only the cows with data on T for the performance of their progeny, the mean estimated accuracies for the EBVs were similar, at 0.329 and 0.334 in the linear-linear and linear-threshold models, respectively. In the case of bulls, the mean estimated accuracies were equal to 0.679 and 0.671 for models 1 and 2, respectively.
Correspondence between the estimated breeding values (EBV) of bulls for temperament assuming a linear (model 1) or threshold model (model 2) for this trait

Top 20%=proportion of coincident animals among the top 20% of bulls for the EBV of temperament according to each model (1 or 2) as a %, followed by the respective number of superior animals considered in each situation (between brackets).
Bottom 20%=proportion of coincident animals among the worst 20% bulls for the EBV of temperament according to each model (1 or 2) as a %, followed by the respective number of inferior animals considered in each situation (between brackets).
Pearson and Spearman=Pearson’s and Spearman’s correlation coefficients, respectively, computed between the EBVs obtained for the temperament of bulls in models 1 and 2.
1 The statistics were computed considering: all bulls present in the data set (all), only the bulls with an EBV accuracy >0.70 for temperament (acc>0.70) or only the bulls with an EBV accuracy⩽0.70 for temperament (acc⩽0.70).
Discussion
The temperament is heritable
The T score proved to be heritable and therefore likely to respond to direct selection. The similar heritability estimates for T obtained in the two models may have occurred because of the reasonable phenotypic variability of T scores within groups and/or because of the fact that a greater number of categories (four) allowed the threshold model to be more similar to the linear model (Tables 2 and 3). Although 78% of the animals were scored 1 and 2, there were still 22% in other categories representing a considerable variation for T trait, because in this Nellore breeding program animals receiving the greatest score (worst temperament) were discarded. In addition, according to Adamczyk et al. (Reference Adamczyk, Pokorska, Makulska, Earley and Mazurek2013), long-term culling of aggressive cattle caused a marked increase in the proportion of cattle with a calm temperament.
In the present study, the credibility interval at a 95% probability for the heritability of T in the linear-threshold model included the interval between 0.20 and 0.32, whereas that for the heritability estimated for the direct effect on WW included the interval between 0.8 and 0.22 (Table 3). According to Gianola and Foulley (Reference Gianola and Foulley1990), determining this interval is a major advantage of Bayesian inference, even when using non-informative priors, as they are narrower than the confidence intervals in frequentist methodologies.
The results obtained in the present study for the heritability estimates are within the range of values reported in the literature. Sant’anna et al. (Reference Sant’anna, Paranhos da Costa, Baldi and Albuquerque2013) evaluated T scores under a threshold model in Nellore cattle and reported lower estimates of heritability than were found in the present study (h²=0.15), whereas the heritability estimates for T measured on the basis of flight speed, crush score and movement score were 0.35, 0.19 and 0.19, respectively. Hoppe et al. (Reference Hoppe, Brandt, König, Erhardt and Gauly2010) tested different methods for measuring the temperament of cattle of the European breeds German Angus, Charolais, Hereford, Limousin and Simmental and reported heritability values ranging from 0.15±0.06 to 0.36±0.06. Working with Zebu cattle (Brahman and its crossbreeds), Kadel et al. (Reference Kadel, Johnston, Burrow, Graser and Ferguson2006) measured temperament using different methods (flight time, flight speed and crush score) and obtained estimates of heritability ranging from 0.15 to 0.19, with standard errors ranging from 0.02 to 0.03.
Temperament behavior in cattle is characterized by a high individual variation and this could be because of several sources like age and sex of animals, genotypes and mainly because of the different methods used to assess this trait. In a recent review on this matter, Adamczyk et al. (Reference Adamczyk, Pokorska, Makulska, Earley and Mazurek2013) reported variation coefficients ranging from 26% to 43% and heritability estimates for cattle temperament from 0 to 0.70. According to Forkman et al. (Reference Forkman, Boissy, Meunier-Salaun, Canali and Jones2007), there is consistency between fear tests in cattle and their physiological parameters; however, there is little or no relationship between the tests, possibly because of different tests used and different breeds. Despite the above statement, Sant’anna et al. (Reference Sant’anna, Paranhos da Costa, Baldi and Albuquerque2013) found high genetic correlation between different assessments of T, ranging from 0.76±0.06 to 0.99±0.02 between flight speed and movement score and crush score and movement score, respectively, for Nellore cattle.
The direct heritability estimated for WW was moderate (0.20) in both models. This value was similar to those reported for beef cattle under a tropical environment but smaller than that reported by Lopes et al. (Reference Lopes, Magnabosco, Paulini, Silva, Miyagi and Lôbo2013) (0.61±0.02) and Sant’anna et al. (Reference Sant’anna, Paranhos da Costa, Baldi and Albuquerque2013) (0.27), who also worked with zebu cattle. The estimated heritability (h 2 m ) for the direct maternal effect (0.17) was also moderate. Although this result was expected because the calf depends on its mother during suckling, the value was higher than those reported in studies with Nellore cattle in tropical regions (Lopes et al., Reference Lopes, Magnabosco, Paulini, Silva, Miyagi and Lôbo2013, 0.08±0.005) but similar to that estimated by Eler et al. (Reference Eler, Van Vleck, Ferraz and Lôbo1995) (0.17±0.03). However, it should be noted that these authors considered the covariance between direct and maternal genetic effects to be non-zero, which may have influenced the values of the estimates of the variances and the genetic parameters obtained. In the present study, the large amount of information on WW, combined with the connectivity between the herds and the presence of multiple offspring per cow in the data file,was likely responsible for the higher estimates obtained for h 2 m .
There is no antagonism in selecting heavier animals at weaning with a calmer temperament
The estimated genetic correlations between WW and T (−0.33 in both models) indicate that these traits can be simultaneously selected and that selection applied to one of them will have a moderate indirect effect on the other. The results obtained in the present study were consistent with those reported by Tulloh (Reference Tulloh1961), Voisinet et al. (Reference Voisinet, Gradin, Tatum, O’Connor and Struthers1997) and Muller and Von Keyserlingk (Reference Muller and Von Keyserlingk2006). Sant’anna et al. (Reference Sant’anna, Paranhos da Costa, Baldi and Albuquerque2013) estimated much lower genetic correlations between WW and temperament, as measured using temperament scores (T) and through other methods (flight speed, movement score and crush score) in Nellore cattle (r g between −0.06 and −0.08). According to these authors, one possible reason for the small magnitude of these estimates of r g is that there was a much larger number of observations for WW (n~108 000) than that for T (n=23 420) or for the other measures of temperament (n~7400). The authors attributed the weak association between these traits mainly to the human visual assessment performed on the farms and suggested the use of electronic equipment for assessing temperament. The divergence of the results obtained by Sant’anna et al. (Reference Sant’anna, Paranhos da Costa, Baldi and Albuquerque2013) from those of the present study could also be explained by the lower phenotypic variability of the population studied by Sant’anna et al. (Reference Sant’anna, Paranhos da Costa, Baldi and Albuquerque2013), in which 80% of the animals presented a T score of 2. However, the more desirable phenotype for T in that population can be attributed to genetic components and/or associated with the handling of the animals, as well as to differences in the measurement of T. This is the case because the influence of management practices during collection and some level of variation associated with the evaluator could bias the measurements. Gauly et al. (Reference Gauly, Mathiak, Hoffmann, Graus and Erhardt2001) studied German Angus (dual-purpose) and Simmental cattle and found that the Simmental animals were more reactive and more difficult to handle, obtaining negative correlations between daily weight gain and reactivity, which also suggests that more reactive animals are less productive. Working with Nellore cattle, Barrozo et al. (Reference Barrozo, Bukansas, Oliveira, Munari, Neves and Queiroz2012) estimated small correlations between T and reproductive traits and concluded that further studies on T are necessary using the threshold model and/or other approaches because of the discontinuous variation of this trait.
The T score can be analyzed using both linear and threshold models
The rank correlations for the EBVs for temperament were high, demonstrating that the linear-linear and linear-threshold models ranked the animals very similarly. Moreover, the models did not produce different accuracies for the EBVs. The accuracies of the EBVs were lower in the cows (0.329 and 0.334 for the linear-linear and linear-threshold models, respectively) compared with the bulls (0.679 and 0.671 for linear-linear and linear-threshold models, respectively) because of the considerably smaller number of female progeny with available information for T. It should be noted that the differences in accuracy reported here should be considered with caution because they were obtained using different statistical models implemented such that different approximations/procedures were involved in the estimation of accuracies, and possible approximation errors could affect such comparisons. In general, obtaining accuracies of EBVs using complex models and a large number of observations is not a trivial problem because direct inversion of the coefficient matrix is not possible, thus requiring the use of approximations to calculate the accuracies of EBVs (Tier and Meyer, Reference Tier and Meyer2004). Taking the lowest values obtained as a more conservative estimate of accuracy, one expects the accuracy of the EBVs of candidates for selection without progeny and with information for T regarding their own performance in this population to be ~0.55 on average.
The two models produced similar estimates of genetic parameters, although the threshold model required a longer computational processing time for the necessary analyses. For practical purposes, there was no advantage of using the threshold model for the genetic evaluation of temperament, as no consistent changes in estimated breeding values were predicted by the two models.
The T trait is easily measured and has a low implementation cost, as the only requirement is good training of the personnel in charge of herd management. Selection for calm animals on farms would facilitate herd management, implying a reduction in the amount of time the workers require to distribute the herd. In addition, the handling of calmer animals decreases the chance of injury to both the animals and the handlers.
Acknowledgments
The authors are thankful to the PAINT® breeding program (CRV Lagoa Ltda.) for providing the data used in this study. C.R.S.L. received a fellowship from CAPES (Brazilian Federal Agency for Support and Evaluation of Graduate Education/Graduation Program in Animal Breeding and Genetics, FCAV/UNESP). H.H.R.N. was supported by a fellowship from FAPESP (São Paulo Research Foundation). S.A.Q. received a researcher fellowship provided by CNPq (National Counsel of Technological and Scientific Development).