1. Introduction
For the vast majority of species inhabiting temperate and boreal regions, annual life cycles are synchronised with climatic oscillations that influence the availability of essential resources (Stenseth et al. Reference Stenseth, Ottersen, Hurrell, Mysterud, Lima, Chan, Yocooz and Ådlandsvik2003). Consequently, the timing of key life events such as dormancy, germination, mating, reproduction, dispersal, and the duration of life cycles are fundamentally linked to the Earth’s axial tilt (Lissauer et al. Reference Lissauer, Barnes and Chambers2012, Berkov Reference Berkov2018). In contrast, tropical environments typically exhibit less annual temperature variation than daily fluctuations or differences in temperature between the forest canopy and the ground layer (Denlinger Reference Denlinger1986, Lee et al. Reference Lee, Baxt, Castillo and Berkov2014). This relative thermal stability is observed even at the tree line in montane tropical forests, where, despite significant daily temperature changes, annual fluctuations remain limited (Rehm and Feeley Reference Rehm and Feeley2015). The high biodiversity rate in the tropical rainforest is due to several biotic and abiotic factors (Poorter et al. Reference Poorter, Masha, Arets, Ascarrunz, Enquist and Finegan2017), one of the abiotic factors is the climate, characterised by stable temperatures with high rainfall (Wright Reference Wright2002). Seasonal activity in tropical rainforests is characterised by predictable timing, largely determined by rainfall patterns (Van Schaik and Pfannes Reference Van Schaik and Pfannes2005), although it may not occur every year. These activity patterns can manifest as one or more peaks, which can vary in duration and intensity, with activity outside these peaks potentially being absent or occurring at low levels (Wolda Reference Wolda1988, Kishimoto-Yamata and Itioka Reference Kishimoto-Yamata and Itioka2015).
Insects in equatorial forests often synchronise activity with rainfall cycles, generating predictable peaks in abundance and resource exploitation (Wolda Reference Wolda1978, Reference Wolda1988). For example, scarab beetles in Panama display distinct seasonal flight patterns, with peaks tightly correlated to the onset of seasonal rains (Ratcliffe Reference Ratcliffe2003). Similarly, Neotropical butterflies show marked seasonality, with some species restricted to wet-season months, while others emerge predominantly during dry periods, reflecting differences in larval host-plant phenology (DeVries and Walla Reference Devries and Walla2001). Not all taxa follow uniform patterns; some ants and termites maintain relatively stable year-round activity due to buffering within soil and nests (Kaspari and Weiser Reference Kaspari and Weiser2000), while canopy-active insects, such as hemipterans and cicadas, often exhibit pronounced seasonal outbreaks linked to flushing of host trees (Novotny and Basset Reference Novotny and Basset2005). Analytical frameworks, including generalised additive models and wavelet analyses, have proven valuable for detecting such inter-monthly variability and interannual cycles (Degut et al. Reference Degut, Fischer, Quque, Criscuolo, Michalik and Beaulieu2022). These case studies highlight that tropical insect activity encompasses diverse temporal strategies, ranging from rainfall-cued emergence and host-plant tracking to continuous, buffered activity, thus emphasising the need for robust modelling to disentangle climatic and biotic drivers.
Research into animal traits has significantly advanced our understanding of various ecological domains, including community organisation (Brown and Maurer Reference Brown and Maurer1987, Brown et al. Reference Brown, Gillooly, Allen, Savage and West2004), the factors influencing relative species abundances and diversity (Siemann et al. Reference Siemann, Tilman and Haarstad1996, Reference Siemann, Tilman and Haarstad1999), and patterns of species distributions (Gaston and Lawton Reference Gaston and Lawton1988). Trait-based approaches, for instance, have been proposed as valuable tools for predicting extinction risk and the potential consequences of habitat destruction (Kotiaho et al. Reference Kotiaho, Kaitala, Komonen and Paivinen2005, Pedley and Dolman Reference Pedley and Dolman2014, Fountain-Jones et al. Reference Fountain-Jones, Baker and Jordan2015). Body size has significant implications for understanding species’ ecology (i.e. lifespan, home range size, life history, and physiology) (Peters Reference Peters1983, Brown et al. Reference Brown, Gillooly, Allen, Savage and West2004), and size-abundance correlation provides understanding of population traits, organisation, and changes within ecological communities (Abele Reference Abele1976, Kerr and Dickie Reference Kerr and Dickie2001, Woodward et al. Reference Woodward, Ebenman, Emmerson, Montoya, Olesen, Valido and Warren2005). The relationship between body size and abundance is often characterised by an inverse correlation: larger species tend to be less abundant than smaller ones, but there are many exceptions (Poulin Reference Poulin1999). This pattern has been widely observed across various taxa and ecosystems, reflecting underlying ecological and evolutionary processes (Nee et al. Reference Nee, Read, Greenwood and Harvey1991). Factors contributing to this relationship include metabolic constraints, resource availability, and ecological niches (White et al. Reference White, Ernest, Kerkhoff and Enquist2007).
Beetles (Coleoptera order) are the most diverse order of life, boasting 350,000 species across 24 superfamilies and 235 families, exceeding plants in species richness (Bouchard et al. Reference Bouchard, Smith, Douglas, Gimmel, Brunke, Kanda, Robert and Peter2017). The superfamily Scarabaeoidea encompasses widely varied feeding habits, including coprophagous dung beetles (consuming dung and carrion) and phytophagous chafers (feeding on fungi and plants). Consequently, they perform essential ecosystem functions such as secondary seed dispersal, parasite control, pollination, and trophic regulation (Nichols et al. Reference Nichols, Spector, Louzada, Larsen, Amezquita, Favila and Network2008, Prather et al. Reference Prather, Pelini, Laws, Rivest, Woltz, Bloch and Joern2013). Specifically, dung beetles contribute to decomposition and nutrient cycling within forest ecosystems (Nichols et al. Reference Nichols, Spector, Louzada, Larsen, Amezquita, Favila and Network2008, De Vega et al. Reference De Vega, Arista, Ortiz, Herrera and Talavera2011, Slade et al. Reference Slade, Mann and Lewis2011, Shah and Shah Reference Shah and Shah2022, Muinde and Katumo Reference Muinde and Katumo2024), and because of these functions, they have a crucial ecological role, particularly in the tropics (Vulinec Reference Vulinec2000, Horgan Reference Horgan2005). Moreover, the dung beetle community is a biological indicator; in fact, it responds sensitively to forest fragmentation and human disturbance (Nichols et al. Reference Nichols, Spector, Louzada, Larsen, Amezquita, Favila and Network2008). Among the phytophagous chafers, Goliath beetles (Goliathus Lamarck 1801) and the related genera Fornasinius, Mecynorhina, and Mecynorrhinella, belonging to the Goliathinae subfamily and Scarabaeidae family, are ecologically important insects endemic to sub-Saharan Africa (De Palma et al. Reference De Palma, Takano, Léonard and Bouyer2020) and are currently declining, with some species being under serious threats (for the genus Goliathus, see Luiselli et al. Reference Luiselli, Fa, Le Duc, Eniang, Gonedele-Bi, Segniagbeto and Dendi2025). Therefore, the conservation of these beetles plays a significant role in maintaining ecosystem stability, because of their function as ecological engineers and their role in pollination and because their larvae influence soil structure and plant community dynamics (e.g. Raw, Reference Raw1951). Despite their ecological importance, studies on their activity patterns in relation to seasonal and environmental factors remain limited. Understanding these patterns is essential for conservation efforts and ecological modelling.
This study investigates the seasonal activity patterns of sympatric large-sized Goliathinae as well as their size-abundance correlation in Uganda’s forests through four species (Goliathus goliatus (Linnaeus, 1771), Fornasinius russus (Kolbe, 1884), Mecynorhina confluens (Kraatz, 1890), and Mecynorrhinella poggei (Kraatz, 1890)). The primary objectives are to (1) document species-specific activity trends, (2) assess the influence of seasonal factors on activity, and (3) examine the relationship between body size and apparent abundance.
Material and methods
Study species
This paper examines four widespread Afrotropical beetle species:
-
1) Goliathus goliatus (Linnaeus, 1771)—This species represents the largest beetle in tropical Africa, with males attaining body lengths of up to 110 mm (De Palma et al. Reference De Palma, Takano, Léonard and Bouyer2020). It is primarily distributed across the extensive tropical forests of the Congo Basin from Benin to Kenya, including regions of Nigeria, Cameroon, Gabon, the northern Republic of the Congo, and the northern Democratic Republic of the Congo (De Palma et al. Reference De Palma, Takano, Léonard and Bouyer2020). Population declines have been documented in several countries, such as Benin, Nigeria, Cameroon, and Uganda. These declines are largely attributed to severe habitat loss through deforestation, and, in some areas, may also be influenced by intensive collection for the international entomological trade carried out by local communities (Luiselli et al. Reference Luiselli, Fa, Le Duc, Eniang, Gonedele-Bi, Segniagbeto and Dendi2025). Larvae are thought to be carnivorous, while adults feed predominantly on tree sap, often congregating on Prunus africana and Vernonia species (Luiselli et al. Reference Luiselli, Fa, Le Duc, Eniang, Gonedele-Bi, Segniagbeto and Dendi2025). Ecological information remains limited, with the most comprehensive synthesis provided by Luiselli et al. (Reference Luiselli, Fa, Le Duc, Eniang, Gonedele-Bi, Segniagbeto and Dendi2025).
-
2) Fornasinius russus (Kolbe, 1884)—This conspicuous flower beetle typically measures between 40 and 70 mm in length. Its distribution is concentrated in East Africa, with confirmed records from Gabon, Rwanda, Tanzania, Uganda, Mozambique, Kenya, and the Democratic Republic of the Congo (Maquart and Malec Reference Maquart and Malec2017). The species is generally associated with woodland margins, savannas, tropical forests, and habitats where fruiting trees are abundant. Adults feed on tree sap, nectar, and fallen fruits, thereby contributing to nutrient cycling and possibly pollination. It remains unclear whether F. russus utilises hyrax middens for larval development and adult activity, as has been documented in other members of the genus Fornasinius (Ajong et al. Reference Ajong, Luiselli, Lado, Demaya, Eniang, Segniagbeto, Ketoh, Le Duc, De Palma, Amori, Fa, Behangana, Hema and Dendi2024).
-
3) Mecynorhina confluens (Kraatz, 1890)—This species is broadly distributed throughout Central Africa, with confirmed records from Nigeria, Cameroon, the Central African Republic, the Democratic Republic of the Congo, Uganda, the Republic of the Congo, Gabon, Angola, and Zambia (De Palma et al. Reference De Palma, Takano, Léonard and Bouyer2024). It is a large cetoniine scarab, attaining body lengths of up to 70–80 mm. Mecynorhina confluens can be distinguished from its West African counterpart, Mecynorhina polyphemus (Fabricius, 1781), by subtle morphological traits, particularly the confluent and variably reduced elytral maculation present in both sexes (De Palma et al. Reference De Palma, Takano, Léonard and Bouyer2024) (Figure 1). The species is typically associated with rainforest habitats, where adults feed on tree sap, nectar, and overripe fruits. Its dependence on moist, shaded environments (Figure 1) suggests vulnerability to deforestation and habitat degradation. Despite its wide distribution, the ecology of M. confluens remains largely unknown. Notably, the taxon was only recently elevated to full species status from M. polyphemus (De Palma et al. Reference De Palma, Takano, Léonard and Bouyer2024), and much of the ecological information available derives from studies in which it is named M. polyphemus (e.g., Christiansen Reference Christiansen2013).
-
4) Mecynorrhinella poggei (Kraatz, 1890)—A large species, up to over 80 mm long for large males, with a broad distribution in Eastern-Central Africa, including the Democratic Republic of the Congo, the central-southern Republic of the Congo, northeastern Angola, Uganda, Rwanda, and possibly Burundi and northwestern Tanzania (De Palma et al. Reference De Palma, Takano, Léonard and Bouyer2024). Adults visit sap flows, fermenting/overripe fruits, and flowers in humid forest mosaics; larvae develop in decaying plant matter/wood. Field-based, species-specific ecology remains poorly documented. As with congeners, dependence on moist, shaded habitats implies sensitivity to deforestation and fragmentation.
Male Mecynorhina confluens in its typical forest habitat. This species can be distinguished from its West African counterpart (Mecynorhina polyphemus) by subtle features, notably the confluent and variably reduced elytral maculation observed in both sexes.

Study area
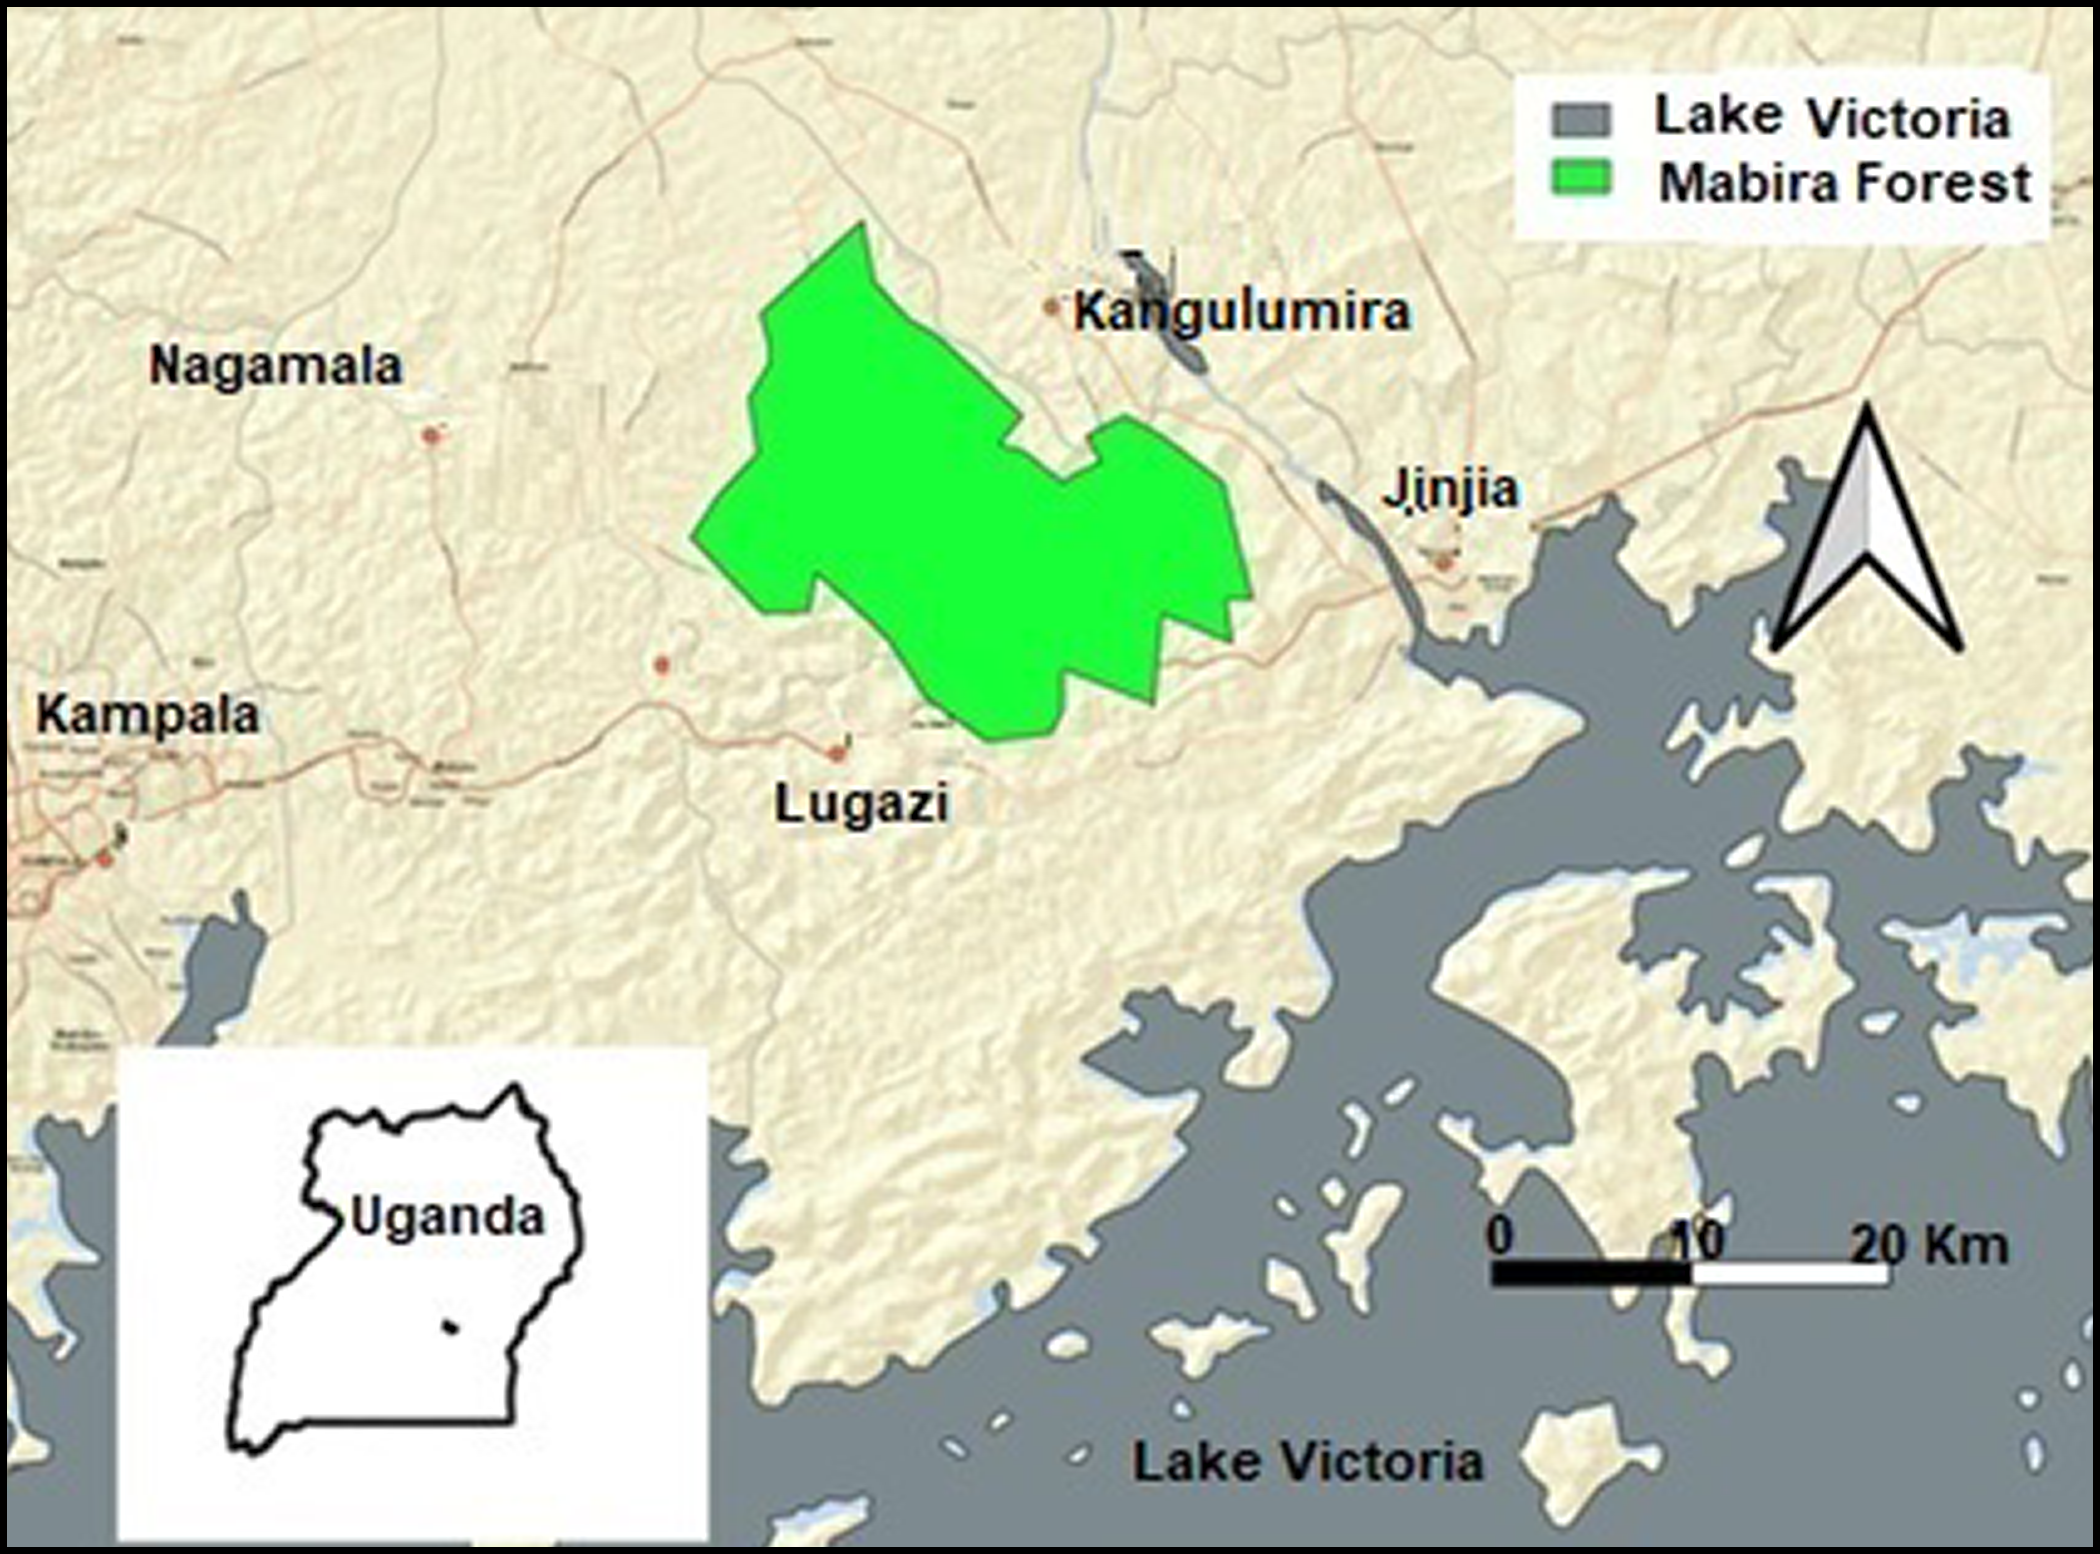
The quantitative field study was anticipated by qualitative surveys in order to familiarise with the habitats and the ecology of the target beetles. Data from these qualitative surveys were obtained in the Kibale Forest National Park, Bigodi, Kamwenge District, and in the Bwindi Impenetrable Forest and its surroundings. We conducted the standardised field surveys in Mukono Forest and Mabira-Najembe (forest edge) in the Mabira Forest Reserve in Mukono District, Uganda, and in surrounding areas (Figure 2). It is a tropical rain forest located in Central Uganda between 0°22’-0°35’N and 32°56’-33°02’E spanning 306 km2 across the Mukono and Kayunga districts. Altitude ranges from 1070 to 1340 metres a.s.l. and is separated from other protected areas by agricultural land (Fungo et al. Reference Fungo, Eilu, Tweheyo and Baranga2013). The area is characterised by a ferritic soil type of texture ranging from loamy to sandy clay loams, with isolated cases of waterlogged clays in the valley bottoms. The main tree species are Milicia excelsa, Cordia millenii, Warburgia ugandensis, Entandrophragma cylindricum, Olea welwitschii, Prunus africana, Craibia brownii, Citropsis articulata, and Broussonetia papyrifera.
Study site in Uganda. Lake Victoria is represented in grey shading. Mabira Forest is represented in green shading.
The region is a tropical humid climate with bimodal wet seasons (March–May and October–November) and dry seasons (December–February and June–August, with an intermediate rainfall in September) with an annual mean precipitation ranging between 1250 and 1400 mm (Weldemariam et al. Reference Weldemariam, Jakisa and Ahebwe2017). The minimal and maximum temperature average range is between 16–17°C and 28–29°C (Weldemariam et al. Reference Weldemariam, Jakisa and Ahebwe2017).
Data collection
We sampled beetles one day per month during three consecutive years (2021–2023), doing both opportunistic and quantitative surveys. Opportunistic surveys were also carried out in Kibale Forest and in Bwindi Impenetrable forest, and served to define the best microhabitats where these beetles can be observed, and also details of the time of the day and period of the year in which it would be better to carry out the standardised surveys. During opportunistic surveys, individuals of the various species were observed in various localities, though low counts in several areas prevented further analyses. Consequently, we selected for more detailed (quantitative) surveys at those sites where opportunistic surveys showed that the apparent density/frequency of encounters was higher. Therefore, in each year, we carried out the quantitative surveys in the same sites.
Survey efforts were distributed as evenly as possible across months. Surveys covered various potential forest habitats, from the ecotones to the inner parts with largest trees. Field days involved random transects conducted from 06:00 to 24:00 local time, ensuring a balanced effort across habitats (secondary forest, mature forest, ecotonal zone between forest and grasslands/plantations) and weather conditions. Searches were only suspended during heavy rains. Each habitat within a study area was systematically examined, with the team spending one hour per habitat type. Efforts included inspecting herbs, shrubs, and trees and observing beetles in flight. Focus was given to trees with exposed sap or fermented phloem, known to attract these beetles.
Transects were walked simultaneously by at least three team members working independently. Observations included beetles found dead on the ground or those attracted to aerial fruit-baited traps (Allemand and Aberlenc, Reference Allemand and Aberlenc1991). All dead specimens or remains were collected and preserved for further examination. Importantly, no live specimens were intentionally killed for this study, given that at least G. goliatus is declining across its range (Luiselli et al. Reference Luiselli, Fa, Le Duc, Eniang, Gonedele-Bi, Segniagbeto and Dendi2025).
At each site, traps were employed to complement visual surveys. These traps were suspended in sun-exposed trees at heights of 2.5–5 m and consisted of 3 L buckets baited with a mixture of banana paste and palm wine (500 mL), following the protocol of Touroult & Le Gall (Reference Touroult and Le Gall2001, Reference Touroult and Le Gall2013). A standardised design was used: 20 traps per habitat type, spaced at least 30 m apart, operated for 48 days per study area (four days per month) across wet and dry seasons. Traps were checked daily, with bait replaced every three days.
We identified species based on morphological characteristics, and we recorded the number of individuals captured per species for each month. We counted both live beetles and identifiable carcasses (including elytra, legs, etc.) and, when possible, we identified the sex of the individual. We measured the total length of live beetles and well-preserved dead individuals using callipers. We released the unharmed living specimens and collected those that were found dead.
Statistical analysis
To assess trends and seasonality, we did a time series analysis for the daily frequencies of each species in which the sin(), cos(), and interannual trend were considered. Then, to detect differences in monthly activity patterns of each species, after a model diagnosis, we ran an Analysis of Variance (ANOVA) Linear Model, respectively, for each of them, followed by a Tukey’s Honestly Significant Difference (HSD) Post-Hoc Test for pairwise comparisons of monthly means. We assessed the effect of year on monthly beetle observations per species. We ran Linear Models with Permutation tests for G. goliatus and M. confluens, and ANOVA Linear Models for M. poggei and F. russus.
To examine relationships between body size and apparent abundance among species, we ran a Linear Regression with permutation test for p-value calculation. We performed all statistical analyses in R 4.2.1 (R Core Team 2013), and we considered statistical tests significant with α = 0.05.
Results
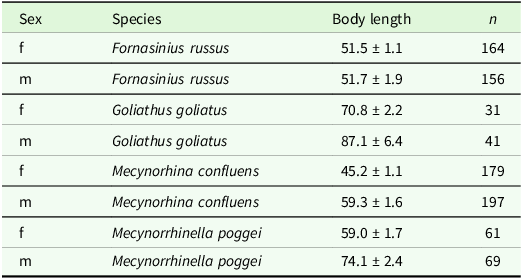
Sample sizes, body sizes, and relationships between body size and species abundance
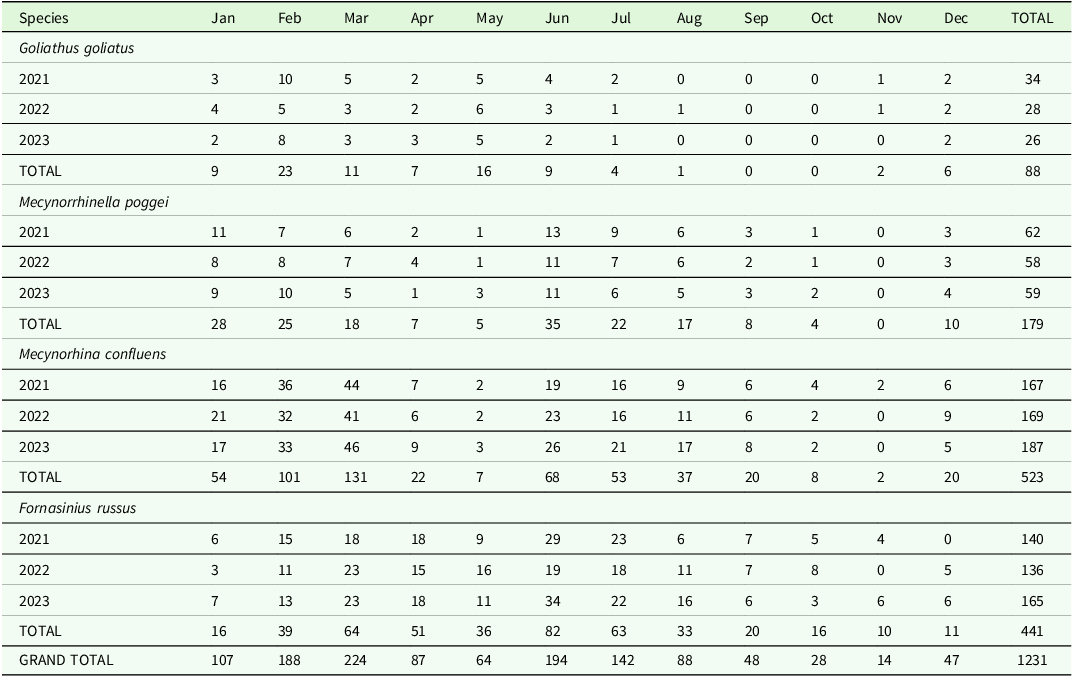
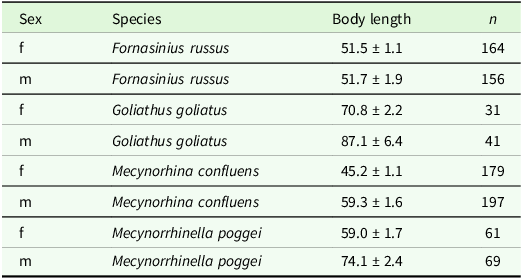
A total of 1,231 beetles were recorded across four species: G. goliatus (n = 88), M. poggei (n = 179), F. russus (n = 441), and M. confluens (n = 523) (Table 1). M. confluens was the most abundant species (42.49% of the total observed individuals), followed by F. russus (35.82%), M. poggei (14.54%), and G. goliatus (7.15%). Body size differed remarkably among species (one-way ANOVA, P < 0.0001), and even between the sexes of the same species (Table 2). Goliathus goliatus was much larger than all other species. Pooling data from the various study years, the apparent average abundance (number of individuals per species per year) of the four species was negatively correlated with their average body size (Pearson’s r = - 0.78, n = 4, P < 0.05; Figure 3).
Species abundance data collected for the sympatric large-sized Goliath beetle species from 2021 to 2023 sampled in the Mabira Forest Reserve, Mokono District, Uganda

Body length of male (m) and female (f) of the four study species from 2021–2023 sampled in the Mabira Forest Reserve, Mokono District, Uganda. Specimens that were found dead and too incomplete for reliable measurements were excluded from this table. For body measurements, data are presented as average length (± 1 standard deviation)
Correlation between the average body size (mm) (x-axis) and the average number of individuals caught for the four beetle species (G. goliatus, M. poggei, F. russus, and M. confluens) (y-axis) across all sampling years (2021–2023) from the Mabira Forest Reserve, Mokono District, Uganda (r = −0.78).

Seasonality
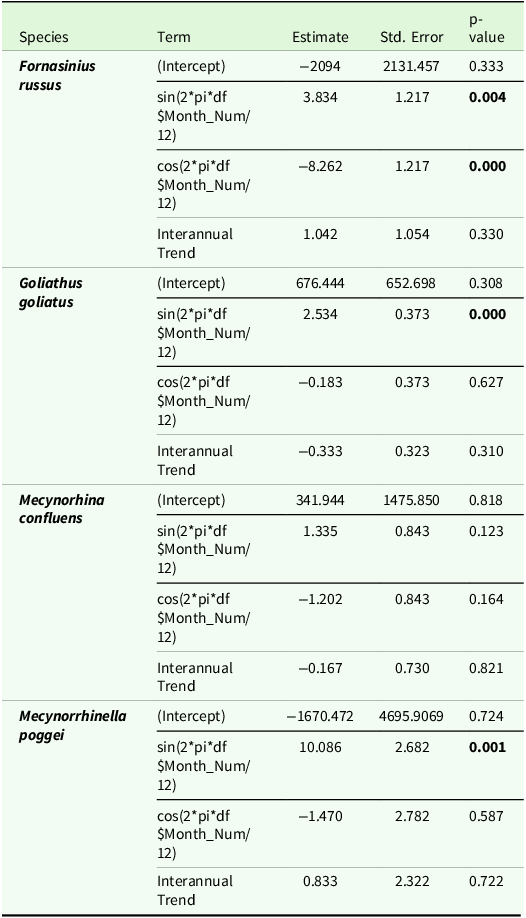
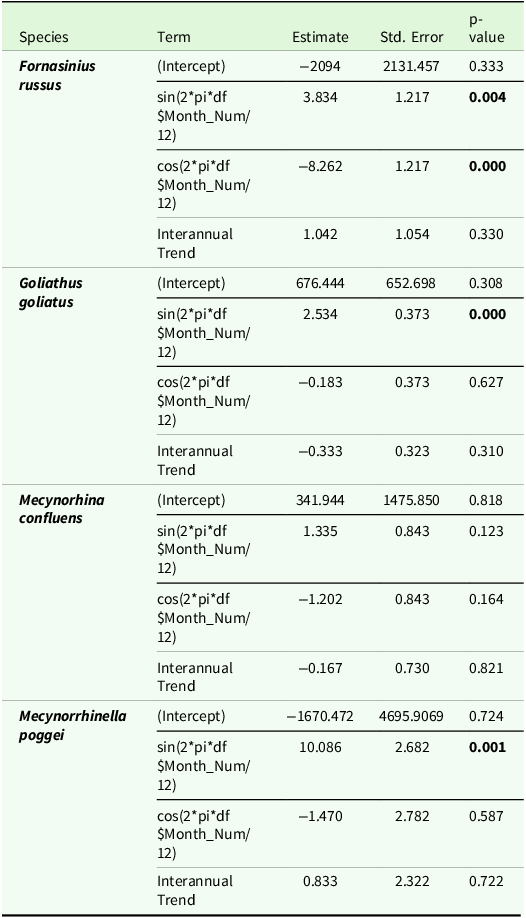
The results of the Time Serial Analysis are presented in Table 3. Statistical analysis revealed significant sinusoidal (sin()) patterns for F. russus (P < 0.005) and G. goliatus (P < 0.001), while F. russus also exhibited a significant cosinusoidal (cos()) pattern (P < 0.001). In contrast, M. confluens showed no significant sinusoidal or cosinusoidal trends (P = 0.123 and P = 0.164, respectively). M. poggei displayed a significant sinusoidal component (P < 0.001) but a non-significant cosinusoidal component (P = 0.587; Table 3). All four species (G. goliatus, M. confluens, M. poggei, and F. russus) presented a significantly consistent interannual trend (Time Serial Analysis: P = 0.330, P = 0.309, P = 0.821, and P = 0.722, respectively; Figure 4). In summary, F. russus abundance is highest between March and July, with a notable decrease in May before peaking in June, then declining until September. M. poggei shows two high abundance peaks in March and June, preceded by rapid increases and followed by sharp declines at the start of both wet and dry seasons, mirroring F. russus’ seasonality but with more extreme peaks. G. goliatus is more abundant from January to June, with peaks in February and May. Notably, May coincides with a decrease in F. russus and M. poggei abundance. G. goliatus’ seasonal peaks appear left-skewed but overlap with those of F. russus and M. poggei.
Time Serial Analysis coefficients, based on species abundance data, including Term (Intercept, sin(), cos(), and Interannual trend), Estimate, Standard Error and p-value for each species from 2021–2023 sampled in the Mabira Forest Reserve, Mokono District, Uganda
Time series analysis of Monthly Beetle Abundance for each species (GG—Goliathus goliatus; MC—Mecynorhina confluens; MP—Mecynorrhinella poggei; and FR—and Fornasinius russus) from 2021–2023 sampled in the Mabira Forest Reserve, Mokono District, Uganda, (a) each year and (b) monthly average of caught individuals. The blue segments represent the bimodal wet season and the yellow segments represent the bimodal dry season.

Monthly activity patterns
ANOVA results revealed significant inter-monthly differences in the mean number of recorded specimens within all species, with each species-specific model showing consistent variation: G. goliatus (F11,24 = 16.963, P < 0.001), M. confluens (F11,24 = 30.398, P < 0.001), M. poggei (F11,24 = 96.474, P < 0.001), and F. russus (F11,24 = 15.152, P < 0.001).
The list of significant monthly comparisons after Tukey HSD correction for each species is given in Table 4. Mecynorrhinella poggei exhibited 43 significant post-hoc (after Tukey HSD correction) differences in monthly abundance throughout the year. August showed the fewest significant differences (only three) with a higher abundance compared to May (P < 0.01), October (P < 0.01), and November (P < 0.01; Table 4A). In contrast, February and March displayed the highest number of significant monthly comparisons, with 10 and 11, respectively, and both months showed higher abundance than all other months. Notably, March had a significantly higher abundance than February (P < 0.01; Table 4A).
List of significant comparisons of abundance values between adjacent months after Tukey HSD correction for each species (A) Mecynorrhinella poggei; B) Mecynorhina confluens; C) Goliathus goliatus; and D) Fornasinius russus) from 2021–2023 sampled in the Mabira Forest Reserve, Mokono District, Uganda. All the month comparisons order has a positive sign of comparison and α < 0.05

Mecynorrhinella confluens showed 35 significant post-hoc (after Tukey HSD correction) abundance comparisons. March and August each exhibited significantly higher abundance in three instances compared to May (P < 0.05; P < 0.01; P < 0.001), October (P < 0.05; P < 0.01; P < 0.001), and November (P < 0.05; P < 0.01; P < 0.001), respectively. February and July each had six significant instances of higher abundance compared to April, May, September, October, November, and December (Table 4B). January and June had the most significant comparisons, with higher abundance than eight and nine other months, respectively (Table 4B).
Goliathus goliatus and F. russus exhibited the fewest significant post-hoc (after Tukey HSD correction) monthly abundance differences among the species studied, with 25 and 22 significant comparisons, respectively. Goliathus goliatus showed significantly higher abundance in January and June compared to September and October (P < 0.05), as well as in February (in 10 comparisons), March (in 4 comparisons), and May (in 7 comparisons; Table 4C). For F. russus, April had significantly higher numbers in four comparisons, March and July each in five, and June in eight. Complete comparison details for F. russus are available in Table 4D.
The comparison of the average number of individuals for all species within each month was non-significant (LM with permutation test for p-value calculation: F2,141 = 0.126, P = 0.886). The comparison between each month and the average number of individuals caught per species was also non-significant: M. poggei (ANOVA Linear Model: F2,33 = 0.056, P = 0. 0.946), M. confluens (LM with permutation test for p-value calculation: F2,33 = 0.0314, P = 0.969), G. goliatus (LM with permutation test for p-value calculation: F2,33 = 0.243, P = 0.798), and F. russus (ANOVA Linear Model: F2,33 = 0.291, P = 0.749).
Discussion
Overview of species abundance
Our results demonstrate a negative significant correlation between body size and abundance, illustrating that the greater the species’ body size, the less abundant the species is. Consistent with this, our study revealed that M. confluens and F. russus, the smaller species observed, were the most abundant (Table 4). These results corroborate previous work, as it is a well-established pattern for many animal communities (Blackburn and Lawton Reference Blackburn and Lawton1994, Blackburn and Gaston Reference Blackburn and Gaston1997) and, more recently, shown in saproxylic beetles and other trophic groups in Norway (Gillespie et al. Reference Gillespie, Birkemoe and Sverdrup-Thygeson2017; no evidence of this pattern is found so far for the tropics to the best of our knowledge). This pattern would be explained, first, by distinctive habitat preferences due to the size of both larvae and imagos as well as resource needs. Indeed, larger forest beetle species typically favour larger, well-decayed dead wood, offering stable conditions for their extended larval development (Foit Reference Foit2010, Brin et al. Reference Brin, Bouget, Brustel and Jactel2011; Gossner et al. Reference Gossner, Lachat, Brunet, Isacsson, Bouget, Brustel, Brandl, Weisser and Mueller2013). In contrast, smaller species can theoretically exploit a broader range of dead wood sizes (Blackburn and Gaston Reference Blackburn and Gaston1997). Additionally, larger dead wood pieces can host more beetle species (i.e. a higher species richness), but larger dead wood can also host species with larger body size (Jonsell et al. Reference Jonsell, Weslien and Ehnstrom1998; Grove Reference Grove2002; Brin et al. Reference Brin, Bouget, Brustel and Jactel2011). Furthermore, Poulin (Reference Poulin1999) also acknowledged that one of the explanations of this negative correlation between size and abundance could be due to resources’ needs increasing with body size. Therefore, an animal’s larger size inherently restricts its potential maximum abundance due to limitations in both space and resource availability (White et al. Reference White, Ernest, Kerkhoff and Enquist2007, Gillespie et al. Reference Gillespie, Birkemoe and Sverdrup-Thygeson2017).
Physiological regulation of growth and development within a species’ life history is also critical in determining final size and allometric variation, highlighting species-specific physiological mechanisms. Given that, larger species are likely less abundant due to physiological and ecological constraints (Peters Reference Peters1983, Brown et al. Reference Brown, Gillooly, Allen, Savage and West2004). Our findings suggest traits that might make some larger species, such as M. poggei and G. goliatus, more vulnerable to disturbance, which supports the findings of Gillespie et al. (Reference Gillespie, Birkemoe and Sverdrup-Thygeson2017). Similar to numerous other beetles (Tind Nielsen Reference Tind Nielsen2007), Goliathus goliatus populations are already declining in Benin, Nigeria, Cameroon, and Uganda, mainly due to deforestation-driven habitat loss and potentially high collection rates for the international entomological trade (Muafor & LeGall, Reference Muafor and LeGall2011, Mallon et al. Reference Mallon, Hoffmann, Grainger, Hibert, van Vliet and McGowan2015, Luiselli et al. Reference Luiselli, Fa, Le Duc, Eniang, Gonedele-Bi, Segniagbeto and Dendi2025), factors that threaten this largest species (Luiselli et al. Reference Luiselli, Fa, Le Duc, Eniang, Gonedele-Bi, Segniagbeto and Dendi2025). Consequently, understanding ecological and physiological processes is crucial for effective conservation efforts (Nichols et al. Reference Nichols, Spector, Louzada, Larsen, Amezquita, Favila and Network2008; De Vega et al. Reference De Vega, Arista, Ortiz, Herrera and Talavera2011; Slade et al. Reference Slade, Mann and Lewis2011, Shah and Shah Reference Shah and Shah2022, Muinde and Katumo Reference Muinde and Katumo2024).
Seasonality
Our time series analysis’ results uncover a statistically significant seasonality for three of the species (F. russus, G. goliatus, and M. poggei), indicating their recurring, cyclical pattern of abundance over the year. The observed trend slightly deviates from those typically found for most tropical insects. Our findings indicates that the Goliath species are more abundant during season switches (Wet-Dry or Dry-Wet seasons) rather than previous studies suggesting that the wet season is the peak time of activity and diversity of adult chafers (Owen and Chanter Reference Owen and Chanter1970, Wolda Reference Wolda1978, Denlinger Reference Denlinger1980, Smythe Reference Smythe, Leigh, Rand and Windsor1982, Frith and Frith Reference Frith and Frith1985, DeVries and Walla Reference Devries and Walla2001). Nonetheless, rainforest insect abundance varies spatiotemporally according to moisture levels, with peaks in dry seasons for moist sites and wet seasons for dry sites (Janzen Reference Janzen1973, Richards and Windsor Reference Richards and Windsor2007). This supports the idea that a consistent seasonal activity pattern is unlikely in the humid tropics (Wolda Reference Wolda1988) due to significant spatial variation in rainfall (Sombroek Reference Sombroek2001, Leigh Reference Leigh, Losos and Leigh2004).
We also observed a subtle seasonal asynchrony between the larger and smaller species within our focus group, a trend somewhat similar to the findings of Gillespie et al. (Reference Gillespie, Birkemoe and Sverdrup-Thygeson2017). Dispersal strategies might explain this pattern: species that disperse earlier in the season could experience faster population growth due to an extended period for successful mating or oviposition, or for acquiring enough resources to survive less favourable times of the year (Pozsgai and Littlewood Reference Pozsgai and Littlewood2014, Gillespie et al. Reference Gillespie, Birkemoe and Sverdrup-Thygeson2017). Consideration of the whole life cycle of insects, including the phenology stages, may be necessary to explain the insect seasonality patterns observed. It encompasses the timing of life history events like adult emergence, which play a significant role in shaping species coexistence, interactions, and community structure (Nieminen Reference Nieminen2015, Pozsgai and Littlewood Reference Pozsgai and Littlewood2014). Breeding biology of the species may counteract inter-species competition due to a possible niche overlapping, especially smaller species being on bigger trees where bigger beetles, especially, are (Finn and Gittings, Reference Finn and Gittings2003) (Section 4.1). Furthermore, Hanski (Reference Hanski1987) conducted an outdoor cage experiment to test the theory that localised interactions facilitate coexistence of species breeding in ephemeral habitats. He hypothesised that in temperate zones, phenology, developmental speed, and early diapause in carrion flies are crucial in shaping their community dynamics. This emphasises a fitness evolution strategy of sympatric species. However, the bigger species (M. poggei and G. goliatus) tend to occur earlier during the year, whereas Gillespie et al. (Reference Gillespie, Birkemoe and Sverdrup-Thygeson2017) acknowledged having found larger and less abundant species occurring during late summer, whereas the more abundant ones occur earlier. Being in totally different types of climate, cold-temperate in Norway and tropical-wet in Uganda, such differences may be due to differences in seasonality of biological resources (Grimbacher and Stork Reference Grimbacher and Stork2009)
Mecynorhina confluens presented a seasonal peak trend occurring in June (Table 3B) but exhibited no statistically significant seasonality (Table 1), which suggests that abundance fluctuations might be randomly distributed through the year (Figure 3b), possibly due to broader habitat preferences or greater dietary flexibility.
Conclusion
This study underscores the significant role of body size, a trait intrinsically linked to metabolism and correlated with numerous factors crucial for species conservation (e.g. lifespan, habitat range, and abundance). It also emphasises the importance of seasonal dynamics in structuring the communities of Goliathinae beetles, thereby influencing their conservation. Future research should delve into finer-scale ecological interactions, such as interspecific competition among sympatric species and host-plant preferences.
Future research should also evaluate the type of coexistence within this community, alongside an assessment of patchiness in Mukono Forest and Mabira-Najembe, to better understand their dynamics and focus conservation efforts accordingly. For example, the potential role of interspecific competition was not addressed in our study and will require further investigation through experimental approaches, as well as the application of null models and co-occurrence analyses. Indeed, species interactions exhibit strong seasonality and are dynamic, shifting over time due to alterations in phenology patterns and environmental limitations (Dunbar et al. Reference Dunbar, Korstjens and Lehmann2009, Yang and Rudolf Reference Yang and Rudolf2010, Diez et al. Reference Diez, Ibáñez, Miller-Rushing, Mazer, Crimmins and Crimmins2012, Wolkovich et al. Reference Wolkovich, Cook, McLauchlan and Davies2014). Moreover, climate change continuously reshapes the temporal dynamics of these interactions (Nakazawa and Doi Reference Nakazawa and Doi2012, Wolkovich et al. Reference Wolkovich, Cook, McLauchlan and Davies2014, Kharouba et al. Reference Kharouba, Ehrlén, Gelman, Bolmgren, Allen, Travers and Wolkovich2018). Recent research highlights that even minor shifts in the timing of species interactions can lead to significant changes in their outcomes (Stier et al. Reference Stier, Geange, Hanson and Bolker2013, Godoy and Levine Reference Godoy and Levine2014, Rasmussen et al. Reference Rasmussen, Van Allen and Rudolf2014, Cleland et al. Reference Cleland, Esch and McKinney2015, Young et al. Reference Young, Zefferman, Vaughn and Fick2015, Murillo-Rincon et al. Reference Murillo-Rincón, Kolter, Laurila and Orizaola2017, Rudolf Reference Rudolf2018; Alexander and Levine Reference Alexander and Levine2019).
Author Contributions
LL suggested the subject and the method of manuscript; LL and LDN analysed the data; LL, LDN, MB, and ADW wrote the first draft of the manuscript; MB, PA, JL, FP, and LL collected the data, and all authors reviewed and approved the final draft.
Acknowledgements
We thank Mr Nick Byaba, Mr Robert Bagonza, Mr Innocent Kwarija, Mr Silver Kyamukama, Mr Dillon Lloyd, Mr Ronald Twinomugisha, Mr Francis Ahabwe, Ms Esther Toloa, Mr Herman Kisakye, Mr William Luwaga, and Ms Brenda Atwiine for field help. We are particularly indebted to Mr Emmanuel Mukasa (Herp Fauna Foundation, Uganda) for sharing with us some distribution records that were useful for this study. The submitted draft was substantially improved through the insightful comments and suggestions provided by two anonymous referees.
Competing interests
The authors declare no conflict of interest.
Financial support
This work was supported by the IDECC-Institute for Development Ecology Conservation and Cooperation (Rome, Italy), IDECC (Grant number 04_2021, entitled ‘Ricerche sull’ecologia e la conservazione degli scarabei golia dell’Africa tropicale’; project director: L. Luiselli).