


1 Introduction
1.1 Intrathecal drug delivery
Schematic view of the spinal canal, with indication of the curvilinear coordinates used in the analysis and the most common injection route in ITDD procedures; adapted from Sánchez et al. (Reference Sánchez, Martínez-Bazán, Gutiérrez-Montes, Criado-Hidalgo, Pawlak, Bradley, Haughton and Lasheras2018).

The cerebrospinal fluid (CSF) is a colourless fluid that fills the subarachnoid space (SAS), bathing the external surfaces of the brain and the spinal cord, as shown schematically in figure 1(b). The treatment of a number of central-nervous-system (CNS) pathologies, including some cancers of the CNS, as well as the management of severe chronic and post-operative pain involve in some cases the direct injection of the medication into the CSF in the intrathecal space of the spinal canal that surrounds the spinal cord. This procedure, used since the early 1980s (Onofrio, Yaksh & Arnold Reference Onofrio, Yaksh and Arnold1981), is often referred to as intrathecal or intraspinal drug delivery (ITDD). The standard ITDD protocol consists of placing a small catheter along the spine in the SAS of the lumbar region to continuously pump the drug or to release a finite dose at selected times. Sometimes ITDD is used to deliver the drug to sites along the spinal cord close to the location of injection, while in other cases the medication is delivered to distant target sites in the brain. While the most easily accessed and most commonly used injection route is a puncture in the posterior spine in the lumbar area, typically using the L3/L4 intervertebral space indicated in figure 1(a), an alternative injection site is the cisterna magna, an opening in the SAS located below the cerebellum. However, this latter route carries the risk of apnoea and other serious complications and is generally only used by neurosurgeons. A rarely used route for intrathecal injection is the C1/C2 puncture, but only a few specialists in spine imaging, neuroradiologists mostly, use this approach.
ITDD allows for the use of potent analgesic drugs that cannot be administered systemically because of metabolic or other biochemical reasons, an example being ziconoide, an analgesic agent for the amelioration of severe and chronic pain (Lanz et al. Reference Lanz, Däubler, Eissner, Brod and Theiss1986; Kroin et al. Reference Kroin, Ali, York and Penn1993; Penn Reference Penn2003; Nelissen Reference Nelissen2008; Hettiarachchi et al. Reference Hettiarachchi, Hsu, Harris and Linninger2011; Bottros & Christo Reference Bottros and Christo2014). More importantly, as compared to systemic drug delivery methods, such as oral, transdermal or intravenous delivery, ITDD reduces the amount of medication needed to treat a given condition by a factor as large as 300, thereby drastically diminishing life-threatening side effects (Lynch Reference Lynch2014). It is also useful to treat cases of CSF infection (e.g. meningitis) that require direct and prompt antibiotic therapy (Remeš et al. Reference Remeš, Tomáš, Jindrák, Vaniš and Setlík2013). In addition, ITDD is used to bypass the blood–brain barrier in treatments of certain cancers that have reached the CNS, including some types of lymphoma, medulloblastoma, oligodendroglioma and intracranial germ-cell tumours (Lee et al. Reference Lee, Hsieh, Chuang and Li2017). As in the case of pain and antibiotic medication, the advantage of ITDD chemotherapy is to maximize CNS exposure to the drug while reducing or even eliminating systemic drug toxicity as compared with intravenous or oral delivery.
Although ITDD is currently used with satisfactory results, the drug dispersion rate is rather unpredictable and exhibits dependences that are not thoroughly understood. For instance, Hsu et al. (Reference Hsu, Hettiarachchi, Zhu and Linninger2012) have shown that doubling the heart rate causes a 26.4 % decrease in intrathecal drug concentration at the injection site due to a faster drug-dispersion rate along the canal. It has also been shown that doubling the stroke volume across the foramen magnum may decrease intrathecal drug concentration at the injection site up to 38 % (Carpenter, Berkouk & Lucey Reference Carpenter, Berkouk and Lucey2003). Patient posture and amplitude of the intracranial pressure have also been shown to affect the motion of the CSF and the dispersion of the drug in the spinal canal (Shafer et al. Reference Shafer, Eisenach, Hood and Tong1998).
The limited predictive capability of drug-delivery rates to targeted locations, resulting from a lack of a clear understanding of the complex convective and diffusive mechanisms controlling the transport of the drug, may result in unexpected complications that cannot be explained by current knowledge of pharmacokinetics (Kamran & Wright Reference Kamran and Wright2001; Pardridge Reference Pardridge2011). Recent studies have revealed inexplicable variations in patient response, which may be attributed to differences in the physical and molecular characteristics of the injected solution, and more importantly, to the patient physiological parameters and specific anatomy and characteristics of the spinal canal. Inadvertent over- or under-dosage may result in serious clinical consequences. Under-dosage may occur in 30 % or more of patients receiving standard regimes of chemotherapy and those who are inadvertently under-dosed are at risk of a significantly reduced anticancer effect, with an estimated 20 % relative reduction in survival rate (Wallace & Yaksh Reference Wallace and Yaksh2012). In addition, over-dosing with anaesthetic via ITDD may produce serious consequences including acute nerve damage or chronic subclinical nerve damage (Buchser et al. Reference Buchser, Durrer, Chdel and Mustaki2004). Thus, there is an imperative need to develop a methodology capable of accurately predicting the dispersion of the drug along the spinal canal for the specific anatomy and physiological conditions of the individual patient as well as for the molecular characteristics and injection rate of the drug.
1.2 Flow and transport in the spinal canal
A major feature of spinal fluid flow is its oscillation, which is driven mainly by the intracranial pressure fluctuations that occur with each heart beat as a result of the cyclic variation of the cerebrovascular blood volume (du Boulay Reference du Boulay1966; Bhadelia et al.
Reference Bhadelia, Bogdan, Kaplan and Wolpert1997). As follows from conservation of intracranial volume, i.e. the so-called Monro–Kellie doctrine or hypothesis (Mokri Reference Mokri2001), this pressure fluctuation drives CSF periodically into and out of the compliant spinal canal (du Boulay Reference du Boulay1966). The oscillating CSF flow is accommodated by the compression of the venous and fatty tissue in the epidural space that surrounds the dural sac (Marmarou, Shulman & LaMorgese Reference Marmarou, Shulman and Lamorgese1975; Shapiro, Marmarou & Shulman Reference Shapiro, Marmarou and Shulman1980). The compliance of the canal is very limited, with the result that the tidal volume of CSF flowing across the foramen magnum from the cranial vault into the SAS space of the spinal canal during each cardiac cycle is approximately
 $\unicode[STIX]{x0394}V=1{-}2~\text{cm}^{3}$
(Linninger et al.
Reference Linninger, Tangen, Hsu and Frim2016), corresponding to a very small fraction (2–3 %) of the total CSF volume
 $V\simeq 40{-}60~\text{cm}^{3}$
contained inside the spinal canal. As a consequence, the stroke length of the fluctuating motion is just a few centimetres, resulting in velocities that are of the order of a few
 $\text{cm}~\text{s}^{-1}$
in the cervical region, progressively diminishing along the canal to reach much smaller values in the lumbar region.
In addition to this oscillatory flow, it has been known since the early radiological observations of Di Chiro (Reference Di Chiro1964) that the CSF exhibits a slow bulk motion with characteristic velocities of the order of
 $1~\text{cm}~\text{min}^{-1}$
, much smaller than those of the periodic fluctuating flow, and corresponding characteristic residence times of the order of 30 min, much longer than the period of the oscillating motion (approximately 1 s). This slow bulk motion has been reasoned in our recent paper to be the result of a steady-streaming phenomenon (Sánchez et al.
Reference Sánchez, Martínez-Bazán, Gutiérrez-Montes, Criado-Hidalgo, Pawlak, Bradley, Haughton and Lasheras2018). Our analysis models the SAS as a slowly varying annular canal with a linearly elastic outer wall (the dura membrane), such that the displacement of the latter is determined as the product of the local pressure fluctuation and a compliance factor
 $\unicode[STIX]{x1D6FE}^{\prime }$
. The canal deformation is small, as dictated by the condition
 $\unicode[STIX]{x0394}V/V\ll 1$
. Correspondingly, the dura-membrane displacement, given in order of magnitude by the product
 $\unicode[STIX]{x1D6FE}_{c}^{\prime }(\unicode[STIX]{x0394}p)_{c}$
of the characteristic value
 $\unicode[STIX]{x1D6FE}_{c}^{\prime }$
of the compliance factor and the amplitude
 $(\unicode[STIX]{x0394}p)_{c}$
of the pressure fluctuation in the cranial cavity, is much smaller than the characteristic width
 $h_{c}\sim 0.2~\text{cm}$
of the spinal canal, with their ratio
 $$\begin{eqnarray}\unicode[STIX]{x1D700}=\frac{\unicode[STIX]{x1D6FE}_{c}^{\prime }(\unicode[STIX]{x0394}p)_{c}}{h_{c}}\sim \unicode[STIX]{x0394}V/V\sim 1/50\end{eqnarray}$$
defining a small parameter characterizing the limited compliance of the canal.
At leading order in the limit
 $\unicode[STIX]{x1D700}\ll 1$
the oscillatory motion is determined by a linear unsteady lubrication problem, with the nonlinear terms associated with the convective acceleration and the deformation of the canal producing a small velocity correction with a steady component, which is commonly referred to as steady-streaming flow (Riley Reference Riley2001). The resulting magnitude of this steady velocity is a factor
 $\unicode[STIX]{x1D700}$
smaller than that of the pulsating flow, consistent with the experimental observations of the bulk flow. Recent numerical computations with anatomically correct geometries have verified the existence of steady streaming (Khani et al.
Reference Khani, Sass, Xing, Sharp, Balédent and Martin2018). In addition, their simulations show the steady-state augmentation resulting from the presence of nerve roots in the cervical region. It is worth noting that steady streaming in CSF flow in the spinal canal was also identified in earlier work in connection with the presence of the catheter used to infuse the drug (Nelissen Reference Nelissen2008; Borhani, Nelissen & Buchser Reference Borhani, Nelissen and Buchser2011).
Besides the steady-streaming component of the Eulerian velocity field, there are a number of additional transport mechanisms that may contribute to the dispersion of the drug along the spinal canal. For example, as demonstrated by Larrieu, Hinch & Charru (Reference Larrieu, Hinch and Charru2009) in their analysis of viscous oscillating flow near a wavy wall, the Lagrangian mean motion of an oscillating fluid particle may contain a contribution arising from Stokes drift. This is a purely kinematic effect associated with the spatial non-uniformity of the pulsatile flow. In the presence of a velocity gradient, a fluid particle subject to an oscillating velocity field experiences small velocity variations, so that it does not recover at the end of each cycle the position it occupied initially at the beginning of the cycle. The small cyclical displacements accumulate in time to give the so-called Stokes drift, with associated velocities that are comparable to those of steady streaming (Larrieu et al. Reference Larrieu, Hinch and Charru2009).
A different mechanism that has been postulated to be relevant in connection with drug dispersion in the SAS is the enhancement of the streamwise transport rate arising from the coupling of the velocity shear with the transverse diffusion (Linninger et al.
Reference Linninger, Tangen, Hsu and Frim2016), a phenomenon first investigated by Taylor (Reference Taylor1953). This so-called Taylor dispersion, described theoretically for oscillatory flow in a pipe by Watson (Reference Watson1983), is particularly effective in gaseous flow, where the molecular diffusivity of the solute
 $\unicode[STIX]{x1D705}$
is comparable to the kinematic viscosity of the carrier fluid
 $\unicode[STIX]{x1D708}$
(i.e. values of the Schmidt number
 $S=\unicode[STIX]{x1D708}/\unicode[STIX]{x1D705}\sim 1$
). For example, Taylor dispersion is known to play an important role in the transport of oxygen and carbon dioxide in the lung airways during pulmonary high-frequency ventilation (Grotberg Reference Grotberg1994), involving high-frequency oscillatory flows with small tidal volumes. The effects of Taylor dispersion in solute transport in liquids are necessarily limited by the smaller solute diffusivities. Although the resulting effective diffusion velocities along the spine have been estimated to be negligibly small (Sánchez et al.
Reference Sánchez, Martínez-Bazán, Gutiérrez-Montes, Criado-Hidalgo, Pawlak, Bradley, Haughton and Lasheras2018), more work is necessary to quantify diffusion enhancement stemming from the presence of micro-anatomical features (Linninger et al.
Reference Linninger, Tangen, Hsu and Frim2016).
The existence of two markedly different time scales (i.e. a period of oscillation of approximately 1 second and a residence time of approximately 30 min) hinders computational efforts, limiting their long-time predictive capability as well as their potential for providing understanding of the specific physical mechanisms that regulate the coupling between convection and diffusion and ultimately determine the drug-dispersion rate along the spinal canal. In particular, since solute transport in oscillatory flow is associated with nonlinear mechanisms (e.g. steady streaming, Stokes drift and Taylor dispersion) that have an accumulative effect over many cycles, computational analyses based on numerical integrations over a finite number of cycles are not well suited for investigating drug dispersion. Despite these inherent limitations, previous numerical analyses have helped understand local aspects of the problem. Many of the previous numerical studies of CSF flow and solute transport have been based on modelling of short segments of the SAS of the spinal canal. Most of these investigations consider rigid walls and open input and output cross-sections, with boundary velocity profiles adjusted to satisfy some radiological measurements (Kurtcuoglu Reference Kurtcuoglu and Miller2011). The effect of deformable walls (compliance of the canal) has been included in some simulations (Linninger et al. Reference Linninger, Tangen, Hsu and Frim2016), which have been recently extended to patient-specific three-dimensional (3-D) models of the anatomy of the canal. Some of these computational studies also include modelling pharmacokinetics parameters such as drug enzymatic decay, tissue uptake and clearance by the blood (Pizzichelli Reference Pizzichelli2016; Tangen et al. Reference Tangen, Leval, Mehta and Linninger2017).
The present analysis of solute dispersion in the spinal canal is motivated by the need for increased understanding and better quantification of the transport mechanisms responsible for long-time drug dispersion in ITDD procedures. Our work uses as a starting point our recently published asymptotic analysis of the motion of the CSF in the SAS of the spinal canal (Sánchez et al.
Reference Sánchez, Martínez-Bazán, Gutiérrez-Montes, Criado-Hidalgo, Pawlak, Bradley, Haughton and Lasheras2018). The disparity between the period of the oscillatory motion and the characteristic dispersion time is exploited in a two-time scale analysis accounting for the slenderness of the spinal SAS and its limited compliance, the latter measured by the parameter
 $\unicode[STIX]{x1D700}\sim \unicode[STIX]{x0394}V/V\sim 1/50$
defined in (1.1). We begin in § 2 by addressing the motion in the spinal canal, including the computation of fluid–particle trajectories, which provides the Lagrangian mean velocities involved in the long-time convective transport of the solute. The two-time scale methodology is employed in § 3 to investigate the dispersion of the solute, yielding a simplified transport equation in the long time scale, with separate derivations given in the two distinguished limits
 $S\sim \unicode[STIX]{x1D700}^{-2}$
, which applies to drug diffusion in the CSF, and
 $S\sim 1$
, relevant for diffusion in gaseous flows. An important conclusion is that Taylor dispersion, which is important for
 $S\sim 1$
, is nevertheless negligible for
 $S\sim \unicode[STIX]{x1D700}^{-2}$
. Numerical evaluations of the results of the asymptotic analysis are performed in § 4 for a canal of simplified geometry. The results suggest that, over a large range of values of
 $S$
of interest in ITDD applications, solute transport is largely controlled by the convective transport associated with the Lagrangian mean velocities averaged across the width of the canal. Concluding remarks and comments on limitations and future extensions of the work are given in § 5.
2 CSF motion in the spinal canal
2.1 Characteristic scales
CSF is an incompressible Newtonian fluid with density
 $\unicode[STIX]{x1D70C}$
and kinematic viscosity
 $\unicode[STIX]{x1D708}$
similar to those of water. It fills the subarachnoid space of the spinal canal, a thin annular gap surrounding the spinal cord bounded internally by the pia mater and externally by the deformable dura membrane, as indicated in figure 1(d). The spinal canal is doubly slender, in that its length
 $L\sim 60{-}80~\text{cm}$
, characteristic perimeter
 $\ell _{c}\sim 2~\text{cm}$
and characteristic width
 $h_{c}\sim 0.2~\text{cm}$
satisfy the inequalities
 $$\begin{eqnarray}L\gg \ell _{c}\gg h_{c}.\end{eqnarray}$$
The associated total volume of CSF in the spinal canal is of the order of
 $V\sim L\ell _{c}h_{c}\sim 40{-}60~\text{cm}^{3}$
.
The fluctuating motion of CSF in and out of the spinal canal is associated with the periodic variation of the intracranial pressure, driven by the pulsating blood flow in the rigid cranial vault, of angular frequency
 $\unicode[STIX]{x1D714}$
. In addition to the pulsation associated with the arterial blood flow, it has also been observed in many radiological studies (Kao et al.
Reference Kao, Guo, Liou, Hsiao and Chou2008; Dreha-Kulaczewski et al.
Reference Dreha-Kulaczewski, Joseph, Merboldt, Ludwig, Gärtner and Frahm2015) that respiration also produces a modulation of the intracranial pressure, resulting in a smaller additional oscillation of the CSF in the spinal canal at a lower frequency (12–18 cycles per minute in adults). For simplicity and reduced complexity of the algebraic manipulations, our analysis assumes the cranial pressure to be a periodic function with angular frequency
 $\unicode[STIX]{x1D714}$
, equal to that of that of the cardiac cycle. The effects of the lower-frequency component associated with respiratory effects should be addressed in future work by considering a more general temporal variation of the intracranial pressure.
Because of the limited compliance of the spinal canal, measured by the small parameter
 $\unicode[STIX]{x1D700}$
defined in (1.1), the tidal volume that is displaced along the canal during each cardiac cycle,
 $\unicode[STIX]{x0394}V\simeq \unicode[STIX]{x1D700}V\simeq 1{-}2~\text{cm}^{3}$
, is much smaller than
 $V$
. Correspondingly, the periodic flow involves axial displacements of order
 $\unicode[STIX]{x1D700}L$
in times of order
 $\unicode[STIX]{x1D714}^{-1}$
, resulting in streamwise velocities of the CSF with characteristic values
 $u_{c}=\unicode[STIX]{x1D700}\unicode[STIX]{x1D714}L$
of the order of a few
 $\text{cm}~\text{s}^{-1}$
near the entrance, progressively decaying along the canal to vanish at its closed-end sacral region. The corresponding characteristic values of the azimuthal
 $w_{c}=\unicode[STIX]{x1D700}\unicode[STIX]{x1D714}\ell _{c}$
and transverse
 $v_{c}=\unicode[STIX]{x1D700}\unicode[STIX]{x1D714}h_{c}$
velocities are much smaller, a consequence of the slenderness of the canal.
2.2 The Eulerian velocity field
The Eulerian velocity field in the spinal canal was described in our recent paper (Sánchez et al.
Reference Sánchez, Martínez-Bazán, Gutiérrez-Montes, Criado-Hidalgo, Pawlak, Bradley, Haughton and Lasheras2018) using the parameter
 $\unicode[STIX]{x1D700}\sim \unicode[STIX]{x0394}V/V\ll 1$
, defined in (1.1), as an asymptotically small quantity. A brief account of the associated asymptotic analysis is given in appendix A, where the previous treatment is generalized by allowing for a more general description of the compliance properties of the canal. The following paragraphs review the salient results that will be needed below in analysing the transport of the solute.
The slenderness of the flow is accounted for in defining a non-dimensional curvilinear coordinate system
 $(x,y,s)$
, with
 $x$
measuring the distance from the entrance scaled with
 $L$
,
 $y$
measuring the transverse distance from the pia mater scaled with
 $h_{c}$
, and
 $s$
measuring the azimuthal distance, normalized with the local perimeter (see figure 1
c,d for an indication of the coordinate system). The corresponding non-dimensional velocity components
 $(u,v,w)$
are scaled with the characteristic velocities
 $(u_{c},v_{c},w_{c})$
in the longitudinal, transverse and azimuthal directions respectively. The time is scaled with the period of the angular frequency
 $\unicode[STIX]{x1D714}^{-1}$
to give the dimensionless variable
 $t$
. Correspondingly, the velocity is
 $2\unicode[STIX]{x03C0}$
periodic in
 $t$
. The shape of the canal is described by the dimensionless inner perimeter
 $\ell (x)$
(scaled with
 $\ell _{c}$
) and the width distribution
 $h(x,s,t)$
(scaled with
 $h_{c}$
). The deformation of the dura membrane leads to small changes of the canal width
 $h=\bar{h}(x,s)+\unicode[STIX]{x1D700}h^{\prime }(x,s,t)$
, where
 $\bar{h}$
is the unperturbed canal width and
 $h^{\prime }(x,s,t)$
measures the time-dependent radial deformation, such that the transverse velocity satisfies
 $v=\unicode[STIX]{x2202}h^{\prime }/\unicode[STIX]{x2202}t$
at
 $y=h$
.
A straightforward order-of-magnitude analysis of the momentum conservation equation reveals the main characteristics of the CSF flow in the SAS of the spinal canal. The Strouhal number, measuring the relative importance of the local acceleration and the convective acceleration, is
 $\unicode[STIX]{x1D714}L/u_{c}=\unicode[STIX]{x1D714}\ell _{c}/w_{c}=\unicode[STIX]{x1D714}h_{c}/v_{c}=\unicode[STIX]{x1D700}^{-1}\gg 1$
, so that effects of inertia are small. The viscous time across the canal,
 $h_{c}^{2}/\unicode[STIX]{x1D708}$
, is of order
 $\unicode[STIX]{x1D714}^{-1}$
, yielding order-unity values of the Womersley number
 $\unicode[STIX]{x1D6FC}=h_{c}/(\unicode[STIX]{x1D708}/\unicode[STIX]{x1D714})^{1/2}\sim 1$
, with
 $\unicode[STIX]{x1D6FC}^{2}$
measuring the ratio of the local acceleration to the viscous forces. In the first approximation, therefore, the local acceleration balances the pressure and viscous forces, resulting in a linear unsteady lubrication problem with zero time-averaged velocity at any given point. The convective acceleration introduces a small relative correction of order
 $\unicode[STIX]{x1D700}$
to this oscillatory lubrication velocity. Because of the nonlinear nature of the inertial terms, this velocity correction, of order
 $\unicode[STIX]{x1D700}u_{c}=\unicode[STIX]{x1D700}^{2}\unicode[STIX]{x1D714}L$
in the axial direction, includes a steady component known as steady streaming (Riley Reference Riley2001).
The problem can be simplified in the slender-flow approximation (2.1) by consistently neglecting terms of order
 $(\ell _{c}/L)^{2}$
and
 $(h_{c}/L)^{2}$
when writing the conservation equations. Furthermore, to account for the deformation of the dura membrane and the resulting variable geometry, the distance to the pia mater is normalized with the local instantaneous width
 $h(x,s,t)$
to give the alternative transverse coordinate
 $\unicode[STIX]{x1D702}=y/h$
. The set of governing equations, given in appendix A, includes the mass conservation balance
 $$\begin{eqnarray}\frac{1}{\ell }\frac{\unicode[STIX]{x2202}}{\unicode[STIX]{x2202}x}(\ell u)-\frac{\unicode[STIX]{x2202}h}{\unicode[STIX]{x2202}x}\frac{\unicode[STIX]{x1D702}}{h}\frac{\unicode[STIX]{x2202}u}{\unicode[STIX]{x2202}\unicode[STIX]{x1D702}}+\frac{1}{h}\frac{\unicode[STIX]{x2202}v}{\unicode[STIX]{x2202}\unicode[STIX]{x1D702}}+\frac{1}{\ell }\frac{\unicode[STIX]{x2202}w}{\unicode[STIX]{x2202}s}-\frac{1}{\ell }\frac{\unicode[STIX]{x2202}h}{\unicode[STIX]{x2202}s}\frac{\unicode[STIX]{x1D702}}{h}\frac{\unicode[STIX]{x2202}w}{\unicode[STIX]{x2202}\unicode[STIX]{x1D702}}=0,\end{eqnarray}$$
along with the axial and azimuthal components of the momentum conservation equation. An additional constitutive equation must be introduced to relate the deformation of the canal
 $h^{\prime }(x,s,t)$
with the local pressure, with a linearly elastic model used for simplicity in the present analysis. The resulting problem is solved in the asymptotic limit
 $\unicode[STIX]{x1D700}\ll 1$
by introducing regular expansions of the form
 $$\begin{eqnarray}\left.\begin{array}{@{}c@{}}u=u_{0}(x,\unicode[STIX]{x1D702},s,t)+\unicode[STIX]{x1D700}u_{1}(x,\unicode[STIX]{x1D702},s,t)+\cdots \,,\\ v=v_{0}(x,\unicode[STIX]{x1D702},s,t)+\unicode[STIX]{x1D700}v_{1}(x,\unicode[STIX]{x1D702},s,t)+\cdots \,,\\ w=w_{0}(x,\unicode[STIX]{x1D702},s,t)+\unicode[STIX]{x1D700}w_{1}(x,\unicode[STIX]{x1D702},s,t)+\cdots \end{array}\right\}\end{eqnarray}$$
and
 $$\begin{eqnarray}h-\bar{h}(x,s)=\unicode[STIX]{x1D700}h^{\prime }(x,s,t)=\unicode[STIX]{x1D700}(h_{0}^{\prime }+\unicode[STIX]{x1D700}h_{1}^{\prime }+\cdots \,),\end{eqnarray}$$
with additional similar expansions introduced for the functions
 $p^{\prime }(x,t)$
and
 $\hat{p}(x,s,t)$
describing the streamwise and azimuthal pressure variations. As previously mentioned, the leading-order velocity component, determined by integration of an unsteady lubrication problem, has a zero time average
 $\langle u_{0}\rangle =\langle v_{0}\rangle =\langle w_{0}\rangle =0$
, with
 $\langle \cdot \rangle =(1/2\unicode[STIX]{x03C0})\int _{t}^{t+2\unicode[STIX]{x03C0}}\cdot \,\text{d}t$
, whereas the first-order correction, accounting for the effects of convective acceleration, includes non-zero steady-streaming components
 $(\langle u_{1}\rangle ,\langle v_{1}\rangle ,\langle w_{1}\rangle )$
. An analytic solution was found in Sánchez et al. (Reference Sánchez, Martínez-Bazán, Gutiérrez-Montes, Criado-Hidalgo, Pawlak, Bradley, Haughton and Lasheras2018) for the case of a harmonic intracranial pressure variation, such that the leading-order velocity components
 $u_{0}$
,
 $w_{0}$
and
 $v_{0}$
and wall deformation
 $h_{0}^{\prime }(x,s,t)$
are harmonic functions of the form
 $$\begin{eqnarray}u_{0}=\text{Re}(\text{i}\text{e}^{\text{i}t}U),\quad v_{0}=\text{Re}(\text{i}\text{e}^{\text{i}t}V),\quad w_{0}=\text{Re}(\text{i}\text{e}^{\text{i}t}W),\quad h_{0}^{\prime }=\text{Re}(\text{e}^{\text{i}t}H^{\prime }).\end{eqnarray}$$
The functions
 $U$
,
 $V$
,
 $W$
and
 $H$
, carrying the spatial dependence of the leading-order flow, are given in appendix A, along with integral expressions for the associated steady-streaming components
 $\langle u_{1}\rangle$
,
 $\langle v_{1}\rangle$
and
 $\langle w_{1}\rangle$
.
2.3 Fluid–particle trajectories
In view of the characteristics of the Eulerian velocity field, including harmonic leading-order components
 $(u_{0},v_{0},w_{0})$
and first-order corrections
 $(u_{1},v_{1},w_{1})$
that contain non-zero steady components
 $(\langle u_{1}\rangle ,\langle v_{1}\rangle ,\langle w_{1}\rangle )$
, it can be anticipated that, in addition to the small oscillations of dimensionless amplitude
 $\unicode[STIX]{x1D700}$
induced by the pulsatile component of the flow, the fluid particles undergo relative displacements of order unity in characteristic times of order
 $\unicode[STIX]{x1D700}^{-2}\unicode[STIX]{x1D714}^{-1}$
. We shall see that, besides the direct contribution resulting from the steady-streaming velocity
 $\langle \boldsymbol{v}_{1}\rangle =(\langle u_{1}\rangle ,\langle v_{1}\rangle ,\langle w_{1}\rangle )$
, this slow Lagrangian motion includes an additional contribution associated with the Stokes drift of the fluid particles, stemming from the non-uniformity of the harmonic leading-order velocity field
 $\boldsymbol{v}_{0}$
. This can be clarified by considering the motion of a fluid particle, whose trajectory is obtained by integration of
 $$\begin{eqnarray}\left.\begin{array}{@{}c@{}}{\displaystyle \frac{\text{d}x_{p}}{\text{d}t}}=\unicode[STIX]{x1D700}u(x_{p},\unicode[STIX]{x1D702}_{p},s_{p},t),\\ {\displaystyle \frac{\text{d}y_{p}}{\text{d}t}}=h{\displaystyle \frac{\text{d}\unicode[STIX]{x1D702}_{p}}{\text{d}t}}+\left({\displaystyle \frac{\unicode[STIX]{x2202}h}{\unicode[STIX]{x2202}t}}+{\displaystyle \frac{\unicode[STIX]{x2202}h}{\unicode[STIX]{x2202}x}}{\displaystyle \frac{\text{d}x_{p}}{\text{d}t}}+{\displaystyle \frac{\unicode[STIX]{x2202}h}{\unicode[STIX]{x2202}s}}{\displaystyle \frac{\text{d}s_{p}}{\text{d}t}}\right)\unicode[STIX]{x1D702}_{p}=\unicode[STIX]{x1D700}v(x_{p},\unicode[STIX]{x1D702}_{p},s_{p},t),\\ \ell {\displaystyle \frac{\text{d}s_{p}}{\text{d}t}}=\unicode[STIX]{x1D700}w(x_{p},\unicode[STIX]{x1D702}_{p},s_{p},t),\end{array}\right\}\end{eqnarray}$$
with initial conditions
 $(x_{p},\unicode[STIX]{x1D702}_{p},s_{p})=(x_{i},\unicode[STIX]{x1D702}_{i},s_{i})$
at
 $t=0$
.
It is convenient to exploit the existence of the two time scales
 $\unicode[STIX]{x1D714}^{-1}$
and
 $\unicode[STIX]{x1D700}^{-2}\unicode[STIX]{x1D714}^{-1}$
in a formal multiple-scale analysis that introduces a second time variable
 $\unicode[STIX]{x1D70F}=\unicode[STIX]{x1D700}^{2}t$
to describe the slow evolution of the fluid–particle location, with
 $x_{p}(t,\unicode[STIX]{x1D70F})$
,
 $\unicode[STIX]{x1D702}_{p}(t,\unicode[STIX]{x1D70F})$
, and
 $s_{p}(t,\unicode[STIX]{x1D70F})$
assumed to be periodic in the short time scale
 $t$
. This presumed time dependence is used to write (2.6) in the form
 $$\begin{eqnarray}\displaystyle & \displaystyle \frac{\unicode[STIX]{x2202}x_{p}}{\unicode[STIX]{x2202}t}+\unicode[STIX]{x1D700}^{2}\frac{\unicode[STIX]{x2202}x_{p}}{\unicode[STIX]{x2202}\unicode[STIX]{x1D70F}}=\unicode[STIX]{x1D700}u, & \displaystyle\end{eqnarray}$$
 $$\begin{eqnarray}\displaystyle & \displaystyle h\left(\frac{\unicode[STIX]{x2202}\unicode[STIX]{x1D702}_{p}}{\unicode[STIX]{x2202}t}+\unicode[STIX]{x1D700}^{2}\frac{\unicode[STIX]{x2202}\unicode[STIX]{x1D702}_{p}}{\unicode[STIX]{x2202}\unicode[STIX]{x1D70F}}\right)+\unicode[STIX]{x1D700}\left(\frac{\unicode[STIX]{x2202}h^{\prime }}{\unicode[STIX]{x2202}t}+\frac{\unicode[STIX]{x2202}h}{\unicode[STIX]{x2202}x}u+\frac{1}{\ell }\frac{\unicode[STIX]{x2202}h}{\unicode[STIX]{x2202}s}w\right)\unicode[STIX]{x1D702}_{p}=\unicode[STIX]{x1D700}v, & \displaystyle\end{eqnarray}$$
 $$\begin{eqnarray}\displaystyle & \displaystyle \ell \left(\frac{\unicode[STIX]{x2202}s_{p}}{\unicode[STIX]{x2202}t}+\unicode[STIX]{x1D700}^{2}\frac{\unicode[STIX]{x2202}s_{p}}{\unicode[STIX]{x2202}\unicode[STIX]{x1D70F}}\right)=\unicode[STIX]{x1D700}w. & \displaystyle\end{eqnarray}$$
The problem can be solved by introducing the expansions
 $$\begin{eqnarray}\left.\begin{array}{@{}rcl@{}}x_{p}\, & =\, & x_{0}(t,\unicode[STIX]{x1D70F})+\unicode[STIX]{x1D700}x_{1}(t,\unicode[STIX]{x1D70F})+\unicode[STIX]{x1D700}^{2}x_{2}(t,\unicode[STIX]{x1D70F})+\cdots \,,\\ \unicode[STIX]{x1D702}_{p}\, & =\, & \unicode[STIX]{x1D702}_{0}(t,\unicode[STIX]{x1D70F})+\unicode[STIX]{x1D700}\unicode[STIX]{x1D702}_{1}(t,\unicode[STIX]{x1D70F})+\unicode[STIX]{x1D700}^{2}\unicode[STIX]{x1D702}_{2}(t,\unicode[STIX]{x1D70F})+\cdots \,,\\ s_{p}\, & =\, & s_{0}(t,\unicode[STIX]{x1D70F})+\unicode[STIX]{x1D700}s_{1}(t,\unicode[STIX]{x1D70F})+\unicode[STIX]{x1D700}^{2}s_{2}(t,\unicode[STIX]{x1D70F})+\cdots \,.\end{array}\right\}\end{eqnarray}$$
Correspondingly, the Eulerian velocity components appearing in (2.7)–(2.9) must be expressed in the Taylor-expansion form
 $$\begin{eqnarray}\left.\begin{array}{@{}c@{}}u=u_{0}(\boldsymbol{x}_{0},t)+\unicode[STIX]{x1D700}\left[u_{1}(\boldsymbol{x}_{0},t)+x_{1}{\displaystyle \frac{\unicode[STIX]{x2202}u_{0}}{\unicode[STIX]{x2202}x}}(\boldsymbol{x}_{0},t)+\unicode[STIX]{x1D702}_{1}{\displaystyle \frac{\unicode[STIX]{x2202}u_{0}}{\unicode[STIX]{x2202}\unicode[STIX]{x1D702}}}(\boldsymbol{x}_{0},t)+s_{1}{\displaystyle \frac{\unicode[STIX]{x2202}u_{0}}{\unicode[STIX]{x2202}s}}(\boldsymbol{x}_{0},t)\right]+\cdots \,,\\ v=v_{0}(\boldsymbol{x}_{0},t)+\unicode[STIX]{x1D700}\left[v_{1}(\boldsymbol{x}_{0},t)+x_{1}{\displaystyle \frac{\unicode[STIX]{x2202}v_{0}}{\unicode[STIX]{x2202}x}}(\boldsymbol{x}_{0},t)+\unicode[STIX]{x1D702}_{1}{\displaystyle \frac{\unicode[STIX]{x2202}v_{0}}{\unicode[STIX]{x2202}\unicode[STIX]{x1D702}}}(\boldsymbol{x}_{0},t)+s_{1}{\displaystyle \frac{\unicode[STIX]{x2202}v_{0}}{\unicode[STIX]{x2202}s}}(\boldsymbol{x}_{0},t)\right]+\cdots \,,\\ w=w_{0}(\boldsymbol{x}_{0},t)+\unicode[STIX]{x1D700}\left[w_{1}(\boldsymbol{x}_{0},t)+x_{1}{\displaystyle \frac{\unicode[STIX]{x2202}w_{0}}{\unicode[STIX]{x2202}x}}(\boldsymbol{x}_{0},t)+\unicode[STIX]{x1D702}_{1}{\displaystyle \frac{\unicode[STIX]{x2202}w_{0}}{\unicode[STIX]{x2202}\unicode[STIX]{x1D702}}}(\boldsymbol{x}_{0},t)+s_{1}{\displaystyle \frac{\unicode[STIX]{x2202}w_{0}}{\unicode[STIX]{x2202}s}}(\boldsymbol{x}_{0},t)\right]+\cdots \,,\end{array}\right\}\end{eqnarray}$$
where the known functions
 $(u_{0},v_{0},w_{0}),(u_{1},v_{1},w_{1}),\ldots$
and their derivatives are evaluated at
 $\boldsymbol{x}_{0}=(x_{0},\unicode[STIX]{x1D702}_{0},s_{0})$
. Similarly, the canal perimeter
 $\ell (x)$
and width
 $h(x,s,t)$
must be expanded according to
 $$\begin{eqnarray}\ell =\ell (x_{0})+\unicode[STIX]{x1D700}x_{1}\frac{\unicode[STIX]{x2202}\ell }{\unicode[STIX]{x2202}x}(x_{0})+\cdots\end{eqnarray}$$
and
 $$\begin{eqnarray}h=\bar{h}(x_{0},s_{0})+\unicode[STIX]{x1D700}\left[h_{0}^{\prime }(x_{0},s_{0},t)+x_{1}{\displaystyle \frac{\unicode[STIX]{x2202}\bar{h}}{\unicode[STIX]{x2202}x}}(x_{0},s_{0})+s_{1}{\displaystyle \frac{\unicode[STIX]{x2202}\bar{h}}{\unicode[STIX]{x2202}s}}(x_{0},s_{0})\right]+\cdots \,,\end{eqnarray}$$
with similar expansions introduced for the known geometrical functions
 $\unicode[STIX]{x2202}h^{\prime }/\unicode[STIX]{x2202}t$
,
 $\unicode[STIX]{x2202}\bar{h}/\unicode[STIX]{x2202}x$
and
 $\unicode[STIX]{x2202}\bar{h}/\unicode[STIX]{x2202}s$
.
2.4 Lagrangian velocity in the spinal canal
Substituting (2.10)–(2.13) into (2.7)–(2.9) and collecting the terms that appear at different orders in powers of
 $\unicode[STIX]{x1D700}$
lead to a set of equations that can be solved sequentially. At the leading-order,
 $O(1)$
, the problem becomes
 $$\begin{eqnarray}\frac{\unicode[STIX]{x2202}x_{0}}{\unicode[STIX]{x2202}t}=\frac{\unicode[STIX]{x2202}\unicode[STIX]{x1D702}_{0}}{\unicode[STIX]{x2202}t}=\frac{\unicode[STIX]{x2202}s_{0}}{\unicode[STIX]{x2202}t}=0,\end{eqnarray}$$
which can be readily integrated to give the result
 $\boldsymbol{x}_{0}=[x_{0}(\unicode[STIX]{x1D70F}),\unicode[STIX]{x1D702}_{0}(\unicode[STIX]{x1D70F}),s_{0}(\unicode[STIX]{x1D70F})]$
, indicating that the leading-order terms evolve only in the long time scale, so that the fast oscillatory motion is restricted to the first-order corrections
 $\boldsymbol{x}_{1}=(x_{1},\unicode[STIX]{x1D702}_{1},s_{1})$
, as is consistent with the small stroke lengths of order
 $\unicode[STIX]{x1D700}$
of the Eulerian velocity field. The rate of change in the long time scale
 $\text{d}\boldsymbol{x}_{0}/\text{d}\unicode[STIX]{x1D70F}$
determines the time-averaged Lagrangian velocity components of the slow bulk motion according to
 $$\begin{eqnarray}u_{L}=\frac{\text{d}x_{0}}{\text{d}\unicode[STIX]{x1D70F}},\quad v_{L}=\frac{\text{d}y_{0}}{\text{d}\unicode[STIX]{x1D70F}}=\bar{h}\frac{\text{d}\unicode[STIX]{x1D702}_{0}}{\text{d}\unicode[STIX]{x1D70F}}+\unicode[STIX]{x1D702}_{0}\frac{\unicode[STIX]{x2202}\bar{h}}{\unicode[STIX]{x2202}x}\frac{\text{d}x_{0}}{\text{d}\unicode[STIX]{x1D70F}}+\unicode[STIX]{x1D702}_{0}\frac{\unicode[STIX]{x2202}\bar{h}}{\unicode[STIX]{x2202}s}\frac{\text{d}s_{0}}{\text{d}\unicode[STIX]{x1D70F}},\quad w_{L}=\ell \frac{\text{d}s_{0}}{\text{d}\unicode[STIX]{x1D70F}}\end{eqnarray}$$
to be obtained below by carrying the analysis to order
 $\unicode[STIX]{x1D700}^{2}$
.
At order
 $\unicode[STIX]{x1D700}$
we find
 $$\begin{eqnarray}\displaystyle & \displaystyle \frac{\unicode[STIX]{x2202}x_{1}}{\unicode[STIX]{x2202}t}=u_{0}, & \displaystyle\end{eqnarray}$$
 $$\begin{eqnarray}\displaystyle & \displaystyle \bar{h}\frac{\unicode[STIX]{x2202}\unicode[STIX]{x1D702}_{1}}{\unicode[STIX]{x2202}t}=v_{0}-\left({\displaystyle \frac{\unicode[STIX]{x2202}h_{0}^{\prime }}{\unicode[STIX]{x2202}t}}+{\displaystyle \frac{\unicode[STIX]{x2202}\bar{h}}{\unicode[STIX]{x2202}x}}u_{0}+{\displaystyle \frac{1}{\ell }}{\displaystyle \frac{\unicode[STIX]{x2202}\bar{h}}{\unicode[STIX]{x2202}s}}w_{0}\right)\unicode[STIX]{x1D702}_{0}, & \displaystyle\end{eqnarray}$$
 $$\begin{eqnarray}\displaystyle & \displaystyle \ell \frac{\unicode[STIX]{x2202}s_{1}}{\unicode[STIX]{x2202}t}=w_{0}. & \displaystyle\end{eqnarray}$$
Since the dependence on the short time scale
 $t$
enters above only through the harmonic functions
 $u_{0}[\boldsymbol{x}_{0}(\unicode[STIX]{x1D70F}),t]$
,
 $v_{0}[\boldsymbol{x}_{0}(\unicode[STIX]{x1D70F}),t]$
,
 $w_{0}[\boldsymbol{x}_{0}(\unicode[STIX]{x1D70F}),t]$
and
 $\unicode[STIX]{x2202}h_{0}^{\prime }/\unicode[STIX]{x2202}t[x_{0}(\unicode[STIX]{x1D70F}),s_{0}(\unicode[STIX]{x1D70F}),t]$
, given in (2.5), straightforward integration provides
 $$\begin{eqnarray}\displaystyle & \displaystyle x_{1}=\int u_{0}\,\text{d}t+\tilde{x}_{1}(\unicode[STIX]{x1D70F}), & \displaystyle\end{eqnarray}$$
 $$\begin{eqnarray}\displaystyle & \displaystyle \unicode[STIX]{x1D702}_{1}=\frac{1}{\bar{h}}\left[\int v_{0}\,\text{d}t-\left(h_{0}^{\prime }+\frac{\unicode[STIX]{x2202}\bar{h}}{\unicode[STIX]{x2202}x}\int u_{0}\,\text{d}t+\frac{1}{\ell }\frac{\unicode[STIX]{x2202}\bar{h}}{\unicode[STIX]{x2202}s}\int w_{0}\,\text{d}t\right)\unicode[STIX]{x1D702}_{0}\right]+\tilde{\unicode[STIX]{x1D702}}_{1}(\unicode[STIX]{x1D70F}) & \displaystyle\end{eqnarray}$$
 $$\begin{eqnarray}\displaystyle & \displaystyle s_{1}=\frac{1}{\ell }\int w_{0}\,\text{d}t+\tilde{s}_{1}(\unicode[STIX]{x1D70F}), & \displaystyle\end{eqnarray}$$
with
 $$\begin{eqnarray}\int u_{0}\,\text{d}t=\text{Re}(\text{e}^{\text{i}t}U),\quad \int v_{0}\,\text{d}t=\text{Re}(\text{e}^{\text{i}t}V),\quad \int w_{0}\,\text{d}t=\text{Re}(\text{e}^{\text{i}t}W),\end{eqnarray}$$
as follows from (2.5). The slowly varying terms
 $\tilde{x}_{1}$
,
 $\tilde{\unicode[STIX]{x1D702}}_{1}$
and
 $\tilde{s}_{1}$
appearing in (2.19)–(2.21), which represent small relative corrections of order
 $\unicode[STIX]{x1D700}$
to the long-time evolution of the fluid–particle location, are not to be further considered in the present development. They could be obtained by carrying the analysis to higher order if needed to compute the Lagrangian velocity
 $(u_{L},v_{L},w_{L})$
with increased accuracy.
The Lagrangian velocity components (2.15) are obtained by taking the time average of the trajectory equations that emerge at the following order. For instance, collecting terms of order
 $O(\unicode[STIX]{x1D700}^{2})$
in (2.7) provides
 $$\begin{eqnarray}\frac{\unicode[STIX]{x2202}x_{2}}{\unicode[STIX]{x2202}t}+\frac{\text{d}x_{0}}{\text{d}\unicode[STIX]{x1D70F}}=u_{1}+x_{1}\frac{\unicode[STIX]{x2202}u_{0}}{\unicode[STIX]{x2202}x}+\unicode[STIX]{x1D702}_{1}\frac{\unicode[STIX]{x2202}u_{0}}{\unicode[STIX]{x2202}\unicode[STIX]{x1D702}}+s_{1}\frac{\unicode[STIX]{x2202}u_{0}}{\unicode[STIX]{x2202}s},\end{eqnarray}$$
which leads to
 $$\begin{eqnarray}\displaystyle \frac{\text{d}x_{0}}{\text{d}\unicode[STIX]{x1D70F}} & = & \displaystyle \langle u_{1}\rangle +\left\langle \frac{\unicode[STIX]{x2202}u_{0}}{\unicode[STIX]{x2202}x}\int u_{0}\,\text{d}t\right\rangle +\frac{1}{\bar{h}}\left\langle \frac{\unicode[STIX]{x2202}u_{0}}{\unicode[STIX]{x2202}\unicode[STIX]{x1D702}}\int v_{0}\,\text{d}t\right\rangle +\frac{1}{\ell }\left\langle \frac{\unicode[STIX]{x2202}u_{0}}{\unicode[STIX]{x2202}s}\int w_{0}\,\text{d}t\right\rangle \nonumber\\ \displaystyle & & \displaystyle -\,\frac{\unicode[STIX]{x1D702}_{0}}{\bar{h}}\left(\left\langle \frac{\unicode[STIX]{x2202}u_{0}}{\unicode[STIX]{x2202}\unicode[STIX]{x1D702}}h_{0}^{\prime }\right\rangle +\frac{\unicode[STIX]{x2202}\bar{h}}{\unicode[STIX]{x2202}x}\left\langle \frac{\unicode[STIX]{x2202}u_{0}}{\unicode[STIX]{x2202}\unicode[STIX]{x1D702}}\int u_{0}\,\text{d}t\right\rangle +\frac{1}{\ell }\frac{\unicode[STIX]{x2202}\bar{h}}{\unicode[STIX]{x2202}s}\left\langle \frac{\unicode[STIX]{x2202}u_{0}}{\unicode[STIX]{x2202}\unicode[STIX]{x1D702}}\int w_{0}\,\text{d}t\right\rangle \right)\end{eqnarray}$$
upon taking the time average. The above equation includes products of harmonic functions, to be evaluated with use made of (2.5) and (2.22) together with the expressions given in appendix A for
 $U$
,
 $V$
,
 $W$
and
 $H$
. Using the relation
 $$\begin{eqnarray}\frac{1}{\ell }\frac{\unicode[STIX]{x2202}}{\unicode[STIX]{x2202}x}(\ell u_{0})-\frac{\unicode[STIX]{x2202}\bar{h}}{\unicode[STIX]{x2202}x}\frac{\unicode[STIX]{x1D702}_{0}}{\bar{h}}\frac{\unicode[STIX]{x2202}u_{0}}{\unicode[STIX]{x2202}\unicode[STIX]{x1D702}}+\frac{1}{\bar{h}}\frac{\unicode[STIX]{x2202}v_{0}}{\unicode[STIX]{x2202}\unicode[STIX]{x1D702}}+\frac{1}{\ell }\frac{\unicode[STIX]{x2202}w_{0}}{\unicode[STIX]{x2202}s}-\frac{1}{\ell }\frac{\unicode[STIX]{x2202}\bar{h}}{\unicode[STIX]{x2202}s}\frac{\unicode[STIX]{x1D702}_{0}}{\bar{h}}\frac{\unicode[STIX]{x2202}w_{0}}{\unicode[STIX]{x2202}\unicode[STIX]{x1D702}}=0,\end{eqnarray}$$
stemming at leading order from the continuity equation (2.2), along with integration by parts enables the above equation (2.24) to be written in the compact form
 $$\begin{eqnarray}\displaystyle u_{L}=\frac{\text{d}x_{0}}{\text{d}\unicode[STIX]{x1D70F}} & = & \displaystyle \langle u_{1}\rangle +\frac{1}{\bar{h}}\left\{\langle u_{0}h_{0}^{\prime }\rangle +\frac{1}{\ell }\frac{\unicode[STIX]{x2202}}{\unicode[STIX]{x2202}s}\left(\bar{h}\left\langle u_{0}\int w_{0}\,\text{d}t\right\rangle \right)\right\}\nonumber\\ \displaystyle & & \displaystyle +\,\frac{1}{\bar{h}}\frac{\unicode[STIX]{x2202}}{\unicode[STIX]{x2202}\unicode[STIX]{x1D702}}\left\langle u_{0}\left[\int v_{0}\,\text{d}t-\unicode[STIX]{x1D702}\left(h_{0}^{\prime }+\frac{1}{\ell }\frac{\unicode[STIX]{x2202}\bar{h}}{\unicode[STIX]{x2202}s}\int w_{0}\,\text{d}t\right)\right]\right\rangle .\end{eqnarray}$$
As expected, besides the steady-streaming velocity
 $\langle u_{1}\rangle$
, the Lagrangian velocity includes a Stokes-drift component arising from the interactions of the pulsating axial velocity with the pulsating azimuthal and transverse motion and also with the deformation of the canal. Similar manipulations of the corresponding equations for
 $\text{d}\unicode[STIX]{x1D702}_{0}/\text{d}\unicode[STIX]{x1D70F}$
and
 $\text{d}s_{0}/\text{d}\unicode[STIX]{x1D70F}$
lead to
 $$\begin{eqnarray}\displaystyle v_{L} & = & \displaystyle \langle v_{1}\rangle +\frac{1}{\ell }\frac{\unicode[STIX]{x2202}}{\unicode[STIX]{x2202}x}\left(\ell \left\langle v_{0}\int u_{0}\,\text{d}t\right\rangle \right)+\frac{1}{\ell }\frac{\unicode[STIX]{x2202}}{\unicode[STIX]{x2202}s}\left\langle v_{0}\int w_{0}\,\text{d}t\right\rangle \nonumber\\ \displaystyle & & \displaystyle -\,\frac{\unicode[STIX]{x1D702}}{\bar{h}}\frac{\unicode[STIX]{x2202}}{\unicode[STIX]{x2202}\unicode[STIX]{x1D702}}\left\langle v_{0}\left(h_{0}^{\prime }+\frac{\unicode[STIX]{x2202}\bar{h}}{\unicode[STIX]{x2202}x}\int u_{0}\,\text{d}t+\frac{1}{\ell }\frac{\unicode[STIX]{x2202}\bar{h}}{\unicode[STIX]{x2202}s}\int w_{0}\,\text{d}t\right)\right\rangle\end{eqnarray}$$
and
 $$\begin{eqnarray}\displaystyle w_{L} & = & \displaystyle \langle w_{1}\rangle +\frac{1}{\bar{h}}\left[\langle w_{0}h_{0}^{\prime }\rangle +\frac{\unicode[STIX]{x2202}}{\unicode[STIX]{x2202}x}\left(\bar{h}\left\langle w_{0}\int u_{0}\,\text{d}t\right\rangle \right)\right]\nonumber\\ \displaystyle & & \displaystyle +\,\frac{1}{\bar{h}}\frac{\unicode[STIX]{x2202}}{\unicode[STIX]{x2202}\unicode[STIX]{x1D702}}\left\langle w_{0}\left[\int v_{0}\,\text{d}t-\unicode[STIX]{x1D702}\left(h_{0}^{\prime }+\frac{\unicode[STIX]{x2202}\bar{h}}{\unicode[STIX]{x2202}x}\int u_{0}\,\text{d}t\right)\right]\right\rangle\end{eqnarray}$$
also exhibiting both the steady-streaming and the Stokes-drift components.
The Lagrangian velocities computed above will be seen to determine the convective transport of the solute in the long time scale
 $\unicode[STIX]{x1D70F}$
. The three components satisfy the mass conservation equation
 $$\begin{eqnarray}\frac{1}{\ell }\frac{\unicode[STIX]{x2202}}{\unicode[STIX]{x2202}x}(\ell u_{L})-\frac{\unicode[STIX]{x2202}\bar{h}}{\unicode[STIX]{x2202}x}\frac{\unicode[STIX]{x1D702}}{\bar{h}}\frac{\unicode[STIX]{x2202}u_{L}}{\unicode[STIX]{x2202}\unicode[STIX]{x1D702}}+\frac{1}{\bar{h}}\frac{\unicode[STIX]{x2202}v_{L}}{\unicode[STIX]{x2202}\unicode[STIX]{x1D702}}+\frac{1}{\ell }\frac{\unicode[STIX]{x2202}w_{L}}{\unicode[STIX]{x2202}s}-\frac{1}{\ell }\frac{\unicode[STIX]{x2202}\bar{h}}{\unicode[STIX]{x2202}s}\frac{\unicode[STIX]{x1D702}}{\bar{h}}\frac{\unicode[STIX]{x2202}w_{L}}{\unicode[STIX]{x2202}\unicode[STIX]{x1D702}}=0,\end{eqnarray}$$
which can be integrated across the canal to give
 $$\begin{eqnarray}\frac{1}{\ell }\frac{\unicode[STIX]{x2202}}{\unicode[STIX]{x2202}x}\left(\ell \bar{h}\int _{0}^{1}u_{L}\,\text{d}\unicode[STIX]{x1D702}\right)+\frac{1}{\ell }\frac{\unicode[STIX]{x2202}}{\unicode[STIX]{x2202}s}\left(\bar{h}\int _{0}^{1}w_{L}\,\text{d}\unicode[STIX]{x1D702}\right)=0\end{eqnarray}$$
relating the width-averaged values
 $$\begin{eqnarray}\int _{0}^{1}u_{L}\,\text{d}\unicode[STIX]{x1D702}=\int _{0}^{1}\langle u_{1}\rangle \,\text{d}\unicode[STIX]{x1D702}+\frac{1}{\bar{h}}\left[\int _{0}^{1}\langle h_{0}^{\prime }u_{0}\rangle \,\text{d}\unicode[STIX]{x1D702}+\frac{1}{\ell }\frac{\unicode[STIX]{x2202}}{\unicode[STIX]{x2202}s}\left(\bar{h}\int _{0}^{1}\left\langle u_{0}\int w_{0}\,\text{d}t\right\rangle \text{d}\unicode[STIX]{x1D702}\right)\right]\end{eqnarray}$$
and
 $$\begin{eqnarray}\int _{0}^{1}w_{L}\,\text{d}\unicode[STIX]{x1D702}=\int _{0}^{1}\langle w_{1}\rangle \,\text{d}\unicode[STIX]{x1D702}+\frac{1}{\bar{h}}\left[\int _{0}^{1}\langle h_{0}^{\prime }w_{0}\rangle \,\text{d}\unicode[STIX]{x1D702}+\frac{\unicode[STIX]{x2202}}{\unicode[STIX]{x2202}x}\left(\bar{h}\int _{0}^{1}\left\langle w_{0}\int u_{0}\,\text{d}t\right\rangle \text{d}\unicode[STIX]{x1D702}\right)\right]\end{eqnarray}$$
of the axial and azimuthal components of the time-averaged Lagrangian flow, also of interest in the following development.
3 The description of solute dispersion in the spinal canal
3.1 Characteristic scales
The velocity field in the spinal canal determines the convective transport of the drug injected in the lumbar region. Besides the characteristic time associated with the pulsating flow
 $\unicode[STIX]{x1D714}^{-1}$
, we have seen that the time-averaged Lagrangian motion introduces a second characteristic time scale, the residence time
 $\unicode[STIX]{x1D700}^{-2}\unicode[STIX]{x1D714}^{-1}$
. Molecular diffusion is characterized by the solute diffusivity
 $\unicode[STIX]{x1D705}$
, typical values of which are of the order of
 $\unicode[STIX]{x1D705}\simeq 5\times 10^{-10}~\text{m}^{2}~\text{s}^{-1}$
for chemotherapy drugs such as methotrexate (Blasberg, Patlak & Fenstermacher Reference Blasberg, Patlak and Fenstermacher1975), with even larger values pertaining to the radioactive tracers used in exploratory radiological imaging. The associated Schmidt number
 $S=\unicode[STIX]{x1D708}/\unicode[STIX]{x1D705}$
, defined as the ratio of the kinematic viscosity to the molecular diffusivity, is very large, of the order of a few thousand. Diffusion occurs primarily in the direction transverse to the width of the canal, with associated characteristic times
 $h_{c}^{2}/\unicode[STIX]{x1D705}$
, whereas the times characterizing axial and azimuthal diffusion, given by
 $L^{2}/\unicode[STIX]{x1D705}$
and
 $\ell _{c}^{2}/\unicode[STIX]{x1D705}$
, are much longer owing to the slenderness of the flow, so that these processes play a negligible role and can be discarded in the description.
To anticipate the relative importance of diffusion in the transport of the solute along the SAS of the canal it is of interest to compare the two flow characteristic times
 $\unicode[STIX]{x1D714}^{-1}$
and
 $\unicode[STIX]{x1D700}^{-2}\unicode[STIX]{x1D714}^{-1}$
identified above with the diffusion time
 $h_{c}^{2}/\unicode[STIX]{x1D705}=S\unicode[STIX]{x1D6FC}^{2}\unicode[STIX]{x1D714}^{-1}$
, expressed in terms of the square of the Womersley number
 $\unicode[STIX]{x1D6FC}^{2}=\unicode[STIX]{x1D714}h_{c}^{2}/\unicode[STIX]{x1D708}$
, which as previously mentioned is of order unity for the CSF flow in the spinal canal. The comparison of the large values
 $S\sim 1000$
of the Schmidt number with the typical values of the parameter
 $\unicode[STIX]{x1D700}\sim 1/50$
suggests that the distinguished limit
 $S\sim \unicode[STIX]{x1D700}^{-2}$
applies under most conditions of interest for intrathecal drug delivery, for which the diffusion times
 $h_{c}^{2}/\unicode[STIX]{x1D705}$
are comparable to the characteristic residence time
 $\unicode[STIX]{x1D700}^{-2}\unicode[STIX]{x1D714}^{-1}$
of the fluid particles in the spinal canal. As a result, in the limit
 $S\sim \unicode[STIX]{x1D700}^{-2}$
the temporal variation of the solute concentration is determined by the combined effects of the time-averaged Lagrangian convection and the diffusion across the canal width. The latter will be seen to become dominant for solutes with smaller values of
 $S\ll \unicode[STIX]{x1D700}^{-2}$
, causing the solute concentration to be uniform across the canal at leading order and resulting in a simpler transport equation involving the width-averaged Lagrangian velocities
 $\int _{0}^{1}u_{L}\,\text{d}\unicode[STIX]{x1D702}$
and
 $\int _{0}^{1}w_{L}\,\text{d}\unicode[STIX]{x1D702}$
.
The variation of the solute concentration in the short time scale
 $\unicode[STIX]{x1D714}^{-1}$
occurs through small fluctuations of order
 $\unicode[STIX]{x1D700}$
. For solutes with Schmidt numbers
 $S\sim 1$
, the interactions of these non-uniform fluctuations with the pulsating velocity field will be shown to lead to an additional dispersion mechanism, with transport rates that are seen to be of the order of (although significantly smaller than) those of the time-averaged Lagrangian convection. We shall see that this shear-enhanced dispersion, which has been shown to be an important transport mechanism in applications involving oscillatory gaseous flow, such as pulmonary high-frequency ventilation (Grotberg Reference Grotberg1994), becomes less effective as the value of
 $S$
increases, and is entirely negligible for the Schmidt numbers typical of drugs delivered intrathecally, for which transport relies mainly on Lagrangian convection.
The analysis below will employ the asymptotic limit
 $\unicode[STIX]{x1D700}\ll 1$
to derive an equation for the transport of the solute in the long time scale
 $\unicode[STIX]{x1D700}^{-2}\unicode[STIX]{x1D714}^{-1}$
. The discussion in the preceding paragraphs indicates that the interactions of the solute diffusion with the flow are fundamentally different depending on the solute Schmidt number, with the two limiting cases
 $S\sim \unicode[STIX]{x1D700}^{-2}$
and
 $S\sim 1$
leading to different transport equations, given below in (3.9) and (3.33), respectively. As expected, both equations consistently reduce to the same simplified form (3.13) in the intermediate limit
 $1\ll S\ll \unicode[STIX]{x1D700}^{-2}$
.
3.2 Transport equation
For the curvilinear coordinates
 $(x,y,s)$
the transport equation for a solute of molecular diffusivity
 $\unicode[STIX]{x1D705}$
with concentration
 $c$
takes the form
 $$\begin{eqnarray}\frac{\unicode[STIX]{x2202}c}{\unicode[STIX]{x2202}t}+\unicode[STIX]{x1D700}\left(u\frac{\unicode[STIX]{x2202}c}{\unicode[STIX]{x2202}x}+v\frac{\unicode[STIX]{x2202}c}{\unicode[STIX]{x2202}y}+\frac{w}{\ell }\frac{\unicode[STIX]{x2202}c}{\unicode[STIX]{x2202}s}\right)=\frac{1}{\unicode[STIX]{x1D6FC}^{2}S}\frac{\unicode[STIX]{x2202}^{2}c}{\unicode[STIX]{x2202}y^{2}},\end{eqnarray}$$
where
 $\unicode[STIX]{x1D6FC}\sim 1$
is the Womersley number and
 $S$
is the Schmidt number. The diffusion term in the above equation involves only derivatives in the
 $y$
direction, a simplification that follows from the slenderness condition (2.1). Effects of second-order derivatives in the azimuthal and axial direction are anticipated to introduce corrections that are of order
 $(h_{c}/\ell _{c})^{2}$
and
 $(h_{c}/L)^{2}$
, respectively, which are not described in the present development, consistent with the lubrication approximation used in computing the velocity field. The analysis below will be performed for the case of impermeable bounding surfaces, yielding boundary conditions
 $$\begin{eqnarray}\frac{\unicode[STIX]{x2202}c}{\unicode[STIX]{x2202}y}=0\quad \text{at }y=0,h.\end{eqnarray}$$
The description of solute absorption on the surface of the pia mater and dura membrane, leading to modified boundary conditions at
 $y=0,h$
, is to be discussed in § 5.
It is convenient to rewrite the above problem in terms of the normalized transverse coordinate
 $\unicode[STIX]{x1D702}=y/h$
. Also, because of the anticipated slow evolution of the concentration in the canal, with characteristic transport times
 $\unicode[STIX]{x1D700}^{-2}\unicode[STIX]{x1D714}^{-1}$
, the problem is analysed with the two-time formalism used above in § 2.3 to describe fluid–particle trajectories, involving the long time scale
 $\unicode[STIX]{x1D70F}=\unicode[STIX]{x1D700}^{2}t$
in addition to the short time scale
 $t$
. The resulting concentration field
 $c(x,\unicode[STIX]{x1D702},s,t,\unicode[STIX]{x1D70F})$
, assumed to be
 $2\unicode[STIX]{x03C0}$
periodic in
 $t$
, satisfies the transport problem
 $$\begin{eqnarray}\displaystyle & & \displaystyle \frac{\unicode[STIX]{x2202}c}{\unicode[STIX]{x2202}t}-\unicode[STIX]{x1D700}\frac{\unicode[STIX]{x2202}h^{\prime }}{\unicode[STIX]{x2202}t}\frac{\unicode[STIX]{x1D702}}{h}\frac{\unicode[STIX]{x2202}c}{\unicode[STIX]{x2202}\unicode[STIX]{x1D702}}+\unicode[STIX]{x1D700}^{2}\frac{\unicode[STIX]{x2202}c}{\unicode[STIX]{x2202}\unicode[STIX]{x1D70F}}+\unicode[STIX]{x1D700}\left[u\left(\frac{\unicode[STIX]{x2202}c}{\unicode[STIX]{x2202}x}-\frac{\unicode[STIX]{x2202}h}{\unicode[STIX]{x2202}x}\frac{\unicode[STIX]{x1D702}}{h}\frac{\unicode[STIX]{x2202}c}{\unicode[STIX]{x2202}\unicode[STIX]{x1D702}}\right)\right.\nonumber\\ \displaystyle & & \displaystyle \quad +\left.\frac{v}{h}\frac{\unicode[STIX]{x2202}c}{\unicode[STIX]{x2202}\unicode[STIX]{x1D702}}+\frac{w}{\ell }\left(\frac{\unicode[STIX]{x2202}c}{\unicode[STIX]{x2202}s}-\frac{\unicode[STIX]{x2202}h}{\unicode[STIX]{x2202}s}\frac{\unicode[STIX]{x1D702}}{h}\frac{\unicode[STIX]{x2202}c}{\unicode[STIX]{x2202}\unicode[STIX]{x1D702}}\right)\right]=\frac{1}{\unicode[STIX]{x1D6FC}^{2}Sh^{2}}\frac{\unicode[STIX]{x2202}^{2}c}{\unicode[STIX]{x2202}\unicode[STIX]{x1D702}^{2}};\quad \frac{\unicode[STIX]{x2202}c}{\unicode[STIX]{x2202}\unicode[STIX]{x1D702}}=0\quad \text{at }\unicode[STIX]{x1D702}=0,1\qquad\end{eqnarray}$$
as follows from (3.1).
The problem will be solved by expressing the solute concentration in the expansion form
 $$\begin{eqnarray}c=c_{0}+\unicode[STIX]{x1D700}c_{1}+\unicode[STIX]{x1D700}^{2}c_{2}+\cdots \,,\end{eqnarray}$$
consistent with (2.3) and (2.4). All expansion terms
 $c_{j}(x,\unicode[STIX]{x1D702},s,t,\unicode[STIX]{x1D70F})$
for
 $j=0,1,2,\ldots$
are assumed to be expressible in the form
 $c_{j}=\langle c_{j}\rangle +\tilde{c}_{j}$
, where the average in the short time scale
 $\langle c_{j}\rangle (x,\unicode[STIX]{x1D702},s,\unicode[STIX]{x1D70F})=(1/2\unicode[STIX]{x03C0})\int _{t}^{t+2\unicode[STIX]{x03C0}}c_{j}\,\text{d}t$
varies in the long time scale
 $\unicode[STIX]{x1D70F}$
, while the harmonic functions
 $\tilde{c}_{j}(x,\unicode[STIX]{x1D702},s,t,\unicode[STIX]{x1D70F})$
carry the pulsatile short-time dependence. Introducing (2.3), (2.4), and (3.4) into (3.3) and collecting terms in increasing powers of
 $\unicode[STIX]{x1D700}$
yield a series of problems that can be solved sequentially, as done below in the two distinguished limits
 $S=O(\unicode[STIX]{x1D700}^{-2})$
and
 $S=O(1)$
.
3.3 Solute transport for
 $S\sim \unicode[STIX]{x1D700}^{-2}$

We begin by considering the clinically significant case of large values of the Schmidt number
 $S\sim \unicode[STIX]{x1D700}^{-2}$
, corresponding to most drugs used in ITDD procedures. In this distinguished limit, the diffusion time across the canal
 $h_{c}^{2}/\unicode[STIX]{x1D705}$
is comparable to the characteristic residence time
 $\unicode[STIX]{x1D700}^{-2}\unicode[STIX]{x1D714}^{-1}$
, and therefore much larger than the oscillation time
 $\unicode[STIX]{x1D714}^{-1}\sim h_{c}^{2}/\unicode[STIX]{x1D708}$
, so that interactions between the short-time fluctuations of concentration and velocity do not lead to appreciable enhancement of the solute dispersion. We begin by rewriting the Schmidt number in (3.3) in the rescaled form
 $$\begin{eqnarray}\unicode[STIX]{x1D70E}=\unicode[STIX]{x1D700}^{2}S,\quad \text{with }\unicode[STIX]{x1D70E}\sim 1.\end{eqnarray}$$
At
 $O(1)$
the solution provides
 $$\begin{eqnarray}\frac{\unicode[STIX]{x2202}c_{0}}{\unicode[STIX]{x2202}t}=0\quad \rightarrow \quad c_{0}=c_{0}(x,\unicode[STIX]{x1D702},s,\unicode[STIX]{x1D70F}),\end{eqnarray}$$
indicating that at leading order the concentration evolves only in the long time scale. The short-time variation of the concentration is limited to the corrections
 $c_{1}$
, which are described by the problem that arises at the following order, given by
 $$\begin{eqnarray}\frac{\unicode[STIX]{x2202}c_{1}}{\unicode[STIX]{x2202}t}=-u_{0}\frac{\unicode[STIX]{x2202}c_{0}}{\unicode[STIX]{x2202}x}-\frac{w_{0}}{\ell }\frac{\unicode[STIX]{x2202}c_{0}}{\unicode[STIX]{x2202}s}-\left[v_{0}-\left(\frac{\unicode[STIX]{x2202}h_{0}^{\prime }}{\unicode[STIX]{x2202}t}+\frac{\unicode[STIX]{x2202}\bar{h}}{\unicode[STIX]{x2202}x}u_{0}+\frac{1}{\ell }\frac{\unicode[STIX]{x2202}\bar{h}}{\unicode[STIX]{x2202}s}w_{0}\right)\unicode[STIX]{x1D702}\right]\frac{1}{\bar{h}}\frac{\unicode[STIX]{x2202}c_{0}}{\unicode[STIX]{x2202}\unicode[STIX]{x1D702}}.\end{eqnarray}$$
Since the dependence on
 $t$
enters in (3.7) only through the harmonic functions
 $u_{0}$
,
 $v_{0}$
,
 $w_{0}$
and
 $\unicode[STIX]{x2202}h_{0}^{\prime }/\unicode[STIX]{x2202}t$
, to be evaluated using the expressions (2.5), straightforward integration provides
 $$\begin{eqnarray}\displaystyle c_{1} & = & \displaystyle -\!\int u_{0}\,\text{d}t\frac{\unicode[STIX]{x2202}c_{0}}{\unicode[STIX]{x2202}x}-\int w_{0}\,\text{d}t\frac{1}{\ell }\frac{\unicode[STIX]{x2202}c_{0}}{\unicode[STIX]{x2202}s}-\int v_{0}\,\text{d}t\frac{1}{\bar{h}}\frac{\unicode[STIX]{x2202}c_{0}}{\unicode[STIX]{x2202}\unicode[STIX]{x1D702}}\nonumber\\ \displaystyle & & \displaystyle +\left(h_{0}^{\prime }+\int u_{0}\,\text{d}t\frac{\unicode[STIX]{x2202}\bar{h}}{\unicode[STIX]{x2202}x}+\int w_{0}\,\text{d}t\frac{1}{\ell }\frac{\unicode[STIX]{x2202}\bar{h}}{\unicode[STIX]{x2202}s}\right)\frac{\unicode[STIX]{x1D702}}{\bar{h}}\frac{\unicode[STIX]{x2202}c_{0}}{\unicode[STIX]{x2202}\unicode[STIX]{x1D702}}+\langle c_{1}\rangle\end{eqnarray}$$
including the time-averaged value
 $\langle c_{1}\rangle (x,\unicode[STIX]{x1D702},s,\unicode[STIX]{x1D70F})$
and the harmonic functions
 $h_{0}^{\prime }$
,
 $\int u_{0}\,\text{d}t$
,
 $\int v_{0}\,\text{d}t$
, and
 $\int w_{0}\,\text{d}t$
given in (2.5) and (2.22).
The evolution equation for
 $c_{0}$
emerges at the following order. Collecting terms of
 $O(\unicode[STIX]{x1D700}^{2})$
in (3.3) and taking the time average leads, after significant algebra, to the convection–diffusion equation
 $$\begin{eqnarray}\frac{\unicode[STIX]{x2202}c_{0}}{\unicode[STIX]{x2202}\unicode[STIX]{x1D70F}}+u_{L}\left(\frac{\unicode[STIX]{x2202}c_{0}}{\unicode[STIX]{x2202}x}-\frac{\unicode[STIX]{x2202}\bar{h}}{\unicode[STIX]{x2202}x}\frac{\unicode[STIX]{x1D702}}{\bar{h}}\frac{\unicode[STIX]{x2202}c_{0}}{\unicode[STIX]{x2202}\unicode[STIX]{x1D702}}\right)+\frac{v_{L}}{\bar{h}}\frac{\unicode[STIX]{x2202}c_{0}}{\unicode[STIX]{x2202}\unicode[STIX]{x1D702}}+\frac{w_{L}}{\ell }\left(\frac{\unicode[STIX]{x2202}c_{0}}{\unicode[STIX]{x2202}s}-\frac{\unicode[STIX]{x2202}\bar{h}}{\unicode[STIX]{x2202}s}\frac{\unicode[STIX]{x1D702}}{\bar{h}}\frac{\unicode[STIX]{x2202}c_{0}}{\unicode[STIX]{x2202}\unicode[STIX]{x1D702}}\right)=\frac{1}{\unicode[STIX]{x1D6FC}^{2}\unicode[STIX]{x1D70E}\bar{h}^{2}}\frac{\unicode[STIX]{x2202}^{2}c_{0}}{\unicode[STIX]{x2202}\unicode[STIX]{x1D702}^{2}},\end{eqnarray}$$
involving the time-averaged Lagrangian velocities (2.26)–(2.28) and the rescaled Schmidt number
 $\unicode[STIX]{x1D70E}\sim 1$
defined in (3.5). Equation (3.9) is to be integrated for a given initial distribution
 $c_{0}=c_{i}(x,\unicode[STIX]{x1D702},s)$
with the boundary conditions
 $\unicode[STIX]{x2202}c_{0}/\unicode[STIX]{x2202}\unicode[STIX]{x1D702}=0$
at
 $\unicode[STIX]{x1D702}=0,1$
. An integral equation for the total amount of solute contained between a given section
 $x$
and the end of the canal follows from integrating (3.9) to yield
 $$\begin{eqnarray}\frac{\unicode[STIX]{x2202}}{\unicode[STIX]{x2202}\unicode[STIX]{x1D70F}}\left\{\int _{x}^{1}\left[\ell \int _{0}^{1}\left(\bar{h}\int _{0}^{1}c_{0}\,\text{d}\unicode[STIX]{x1D702}\right)\text{d}s\right]\text{d}x\right\}=\ell \int _{0}^{1}\bar{h}\left(\int _{0}^{1}u_{L}c_{0}\,\text{d}\unicode[STIX]{x1D702}\right)\text{d}s,\end{eqnarray}$$
involving the solute flux across section
 $x$
 $$\begin{eqnarray}\unicode[STIX]{x1D719}_{c}=\ell \int _{0}^{1}\left(\int _{0}^{1}u_{L}c_{0}\,\text{d}\unicode[STIX]{x1D702}\right)\bar{h}\,\text{d}s.\end{eqnarray}$$
It is also worth noting that one may alternatively write the problem (3.9) in the form
 $$\begin{eqnarray}\frac{\unicode[STIX]{x2202}c_{0}}{\unicode[STIX]{x2202}\unicode[STIX]{x1D70F}}+u_{L}\frac{\unicode[STIX]{x2202}c_{0}}{\unicode[STIX]{x2202}x}+v_{L}\frac{\unicode[STIX]{x2202}c_{0}}{\unicode[STIX]{x2202}y}+\frac{w_{L}}{\ell }\frac{\unicode[STIX]{x2202}c_{0}}{\unicode[STIX]{x2202}s}=\frac{1}{\unicode[STIX]{x1D6FC}^{2}\unicode[STIX]{x1D70E}}\frac{\unicode[STIX]{x2202}^{2}c_{0}}{\unicode[STIX]{x2202}y^{2}};\quad \frac{\unicode[STIX]{x2202}c_{0}}{\unicode[STIX]{x2202}y}=0\quad \text{at }y=0,\bar{h}(x,s),\end{eqnarray}$$
obtained from (3.9) by using the relation
 $y=\unicode[STIX]{x1D702}\bar{h}(x,y)$
to express
 $u_{L}$
,
 $v_{L}$
and
 $w_{L}$
as functions of
 $(x,y,s)$
. Despite the apparent simplicity of (3.12), the associated computational domain varies in time according to
 $0\leqslant y\leqslant h(x,s,t)$
, so that the more complicated equation (3.9), involving a transverse coordinate with normalized constant bounds
 $0\leqslant \unicode[STIX]{x1D702}\leqslant 1$
, offers advantages for computational purposes.
One can rewrite simpler descriptions of the above equation for extreme values of
 $\unicode[STIX]{x1D70E}=\unicode[STIX]{x1D700}^{2}S$
. For example, for
 $\unicode[STIX]{x1D70E}\gg 1$
, corresponding to tracers with
 $S\gg \unicode[STIX]{x1D700}^{-2}$
, diffusion is entirely negligible, with the result that the fluid particle conserves its initial concentration at all times. On the other hand, in the opposite limit
 $\unicode[STIX]{x1D70E}\ll 1$
corresponding to values
 $S\ll \unicode[STIX]{x1D700}^{-2}$
(but still sufficiently larger than unity for the analysis leading to (3.9) to remain valid), the transverse diffusion term on the right-hand side of (3.9) becomes dominant. Since
 $\unicode[STIX]{x2202}c_{0}/\unicode[STIX]{x2202}\unicode[STIX]{x1D702}=0$
at
 $\unicode[STIX]{x1D702}=0,1$
, it follows that the concentration of the solute is uniform across the width of the canal, with small departures of order
 $\unicode[STIX]{x1D70E}$
that need not be considered in the first-order approximation. In deriving an equation for
 $c_{0}(x,s,\unicode[STIX]{x1D70F})$
it is convenient to remove the singular diffusion term by integrating (3.9) from
 $\unicode[STIX]{x1D702}=0$
to
 $\unicode[STIX]{x1D702}=1$
taking into account the condition
 $\unicode[STIX]{x2202}c_{0}/\unicode[STIX]{x2202}\unicode[STIX]{x1D702}=0$
in evaluating the convective terms, leading to
 $$\begin{eqnarray}\frac{\unicode[STIX]{x2202}c_{0}}{\unicode[STIX]{x2202}\unicode[STIX]{x1D70F}}+\left(\int _{0}^{1}u_{L}\,\text{d}\unicode[STIX]{x1D702}\right)\frac{\unicode[STIX]{x2202}c_{0}}{\unicode[STIX]{x2202}x}+\left(\int _{0}^{1}w_{L}\,\text{d}\unicode[STIX]{x1D702}\right)\frac{1}{\ell }\frac{\unicode[STIX]{x2202}c_{0}}{\unicode[STIX]{x2202}s}=0\end{eqnarray}$$
involving the width-averaged Lagrangian velocity components (2.31) and (2.32). The predictive capability of this simple description is to be tested in § 4.3.
3.4 Solute transport for
$S\sim 1$

Although the molecular diffusivities of the drugs used in ITDD are always much smaller than the kinematic viscosity, yielding large values of
 $S=\unicode[STIX]{x1D708}/\unicode[STIX]{x1D705}\gg 1$
, to investigate the role of Taylor dispersion it is of interest to consider the transport of solutes with
 $S\sim 1$
. In this distinguished limit the diffusion time across the canal
 $h_{c}^{2}/\unicode[STIX]{x1D705}$
is comparable to the oscillation time
 $\unicode[STIX]{x1D714}^{-1}\sim h_{c}^{2}/\unicode[STIX]{x1D708}$
, and therefore much smaller than the characteristic residence time
 $\unicode[STIX]{x1D700}^{-2}\unicode[STIX]{x1D714}^{-1}$
. As a result, the leading-order time-averaged solute concentration
 $\langle c_{0}\rangle (x,s,\unicode[STIX]{x1D70F})$
becomes independent of the transverse coordinate
 $\unicode[STIX]{x1D702}$
. We shall see that the small short-time fluctuations of the concentration described by the harmonic function
 $\tilde{c}_{1}$
are essential in the description, in that their interactions with the oscillating velocity provide an additional dispersion mechanism for the solute, described in the time-averaged transport equation for
 $\langle c_{0}\rangle (x,s,\unicode[STIX]{x1D70F})$
through apparent diffusion rates proportional to Taylor diffusivities.
At
 $O(1)$
the problem (3.3) becomes
 $$\begin{eqnarray}\frac{\unicode[STIX]{x2202}c_{0}}{\unicode[STIX]{x2202}t}=\frac{1}{\unicode[STIX]{x1D6FC}^{2}S\bar{h}^{2}}\frac{\unicode[STIX]{x2202}^{2}c_{0}}{\unicode[STIX]{x2202}\unicode[STIX]{x1D702}^{2}},\quad \frac{\unicode[STIX]{x2202}c_{0}}{\unicode[STIX]{x2202}\unicode[STIX]{x1D702}}=0\quad \text{at }\unicode[STIX]{x1D702}=0,1,\end{eqnarray}$$
with
 $c_{0}=\langle c_{0}\rangle +\tilde{c}_{0}$
. An equation for
 $\langle c_{0}\rangle$
follows from taking the time average of (3.14) to yield
 $$\begin{eqnarray}0=\frac{\unicode[STIX]{x2202}^{2}\langle c_{0}\rangle }{\unicode[STIX]{x2202}\unicode[STIX]{x1D702}^{2}},\quad \frac{\unicode[STIX]{x2202}\langle c_{0}\rangle }{\unicode[STIX]{x2202}\unicode[STIX]{x1D702}}=0\quad \text{at }\unicode[STIX]{x1D702}=0,1,\end{eqnarray}$$
which can be readily integrated to give
 $\unicode[STIX]{x2202}\langle c_{0}\rangle /\unicode[STIX]{x2202}\unicode[STIX]{x1D702}=0$
. The complex function
 $\tilde{C}_{0}$
that determines the leading-order harmonic contribution
 $\tilde{c}_{0}=\text{Re}(\text{e}^{\text{i}t}\tilde{C}_{0})$
is identically zero, as can be seen by integrating
 $$\begin{eqnarray}\text{i}\tilde{C}_{0}=\frac{1}{\unicode[STIX]{x1D6FC}^{2}S\bar{h}^{2}}\frac{\unicode[STIX]{x2202}^{2}\tilde{C}_{0}}{\unicode[STIX]{x2202}\unicode[STIX]{x1D702}^{2}},\quad \frac{\unicode[STIX]{x2202}\tilde{C}_{0}}{\unicode[STIX]{x2202}\unicode[STIX]{x1D702}}=0\quad \text{at }\unicode[STIX]{x1D702}=0,1.\end{eqnarray}$$
Consequently, at this order the solution reduces to
 $$\begin{eqnarray}c_{0}=\langle c_{0}\rangle =c_{0}(x,s,\unicode[STIX]{x1D70F}).\end{eqnarray}$$
At
 $O(\unicode[STIX]{x1D700})$
the transport problem (3.3) yields
 $$\begin{eqnarray}\frac{\unicode[STIX]{x2202}c_{1}}{\unicode[STIX]{x2202}t}+u_{0}\frac{\unicode[STIX]{x2202}c_{0}}{\unicode[STIX]{x2202}x}+\frac{w_{0}}{\ell }\frac{\unicode[STIX]{x2202}c_{0}}{\unicode[STIX]{x2202}s}=\frac{1}{\unicode[STIX]{x1D6FC}^{2}S\bar{h}^{2}}\frac{\unicode[STIX]{x2202}^{2}c_{1}}{\unicode[STIX]{x2202}\unicode[STIX]{x1D702}^{2}},\quad \frac{\unicode[STIX]{x2202}c_{1}}{\unicode[STIX]{x2202}\unicode[STIX]{x1D702}}=0\quad \text{at }\unicode[STIX]{x1D702}=0,1\end{eqnarray}$$
for the first-order correction
 $c_{1}$
. The leading-order velocity components satisfy
 $\langle u_{0}\rangle =\langle w_{0}\rangle =0$
, so that the time average of (3.18) provides
 $$\begin{eqnarray}0=\frac{\unicode[STIX]{x2202}^{2}\langle c_{1}\rangle }{\unicode[STIX]{x2202}\unicode[STIX]{x1D702}^{2}},\quad \frac{\unicode[STIX]{x2202}\langle c_{1}\rangle }{\unicode[STIX]{x2202}\unicode[STIX]{x1D702}}=0\quad \text{at }\unicode[STIX]{x1D702}=0,1,\end{eqnarray}$$
which readily yields
 $\langle c_{1}\rangle =\langle c_{1}\rangle (x,s,\unicode[STIX]{x1D70F})$
. The harmonic fluctuation
 $\tilde{c}_{1}$
, needed in the following development, is determined by integration of
 $$\begin{eqnarray}\frac{1}{\unicode[STIX]{x1D6FC}^{2}S\bar{h}^{2}}\frac{\unicode[STIX]{x2202}^{2}\tilde{c}_{1}}{\unicode[STIX]{x2202}\unicode[STIX]{x1D702}^{2}}-\frac{\unicode[STIX]{x2202}\tilde{c}_{1}}{\unicode[STIX]{x2202}t}=u_{0}\frac{\unicode[STIX]{x2202}c_{0}}{\unicode[STIX]{x2202}x}+\frac{w_{0}}{\ell }\frac{\unicode[STIX]{x2202}c_{0}}{\unicode[STIX]{x2202}s},\quad \frac{\unicode[STIX]{x2202}\tilde{c}_{1}}{\unicode[STIX]{x2202}\unicode[STIX]{x1D702}}=0\quad \text{at }\unicode[STIX]{x1D702}=0,1.\end{eqnarray}$$
The solution reduces simply to
 $$\begin{eqnarray}\tilde{c}_{1}=-\!\left(\int u_{0}\,\text{d}t\right)\frac{\unicode[STIX]{x2202}c_{0}}{\unicode[STIX]{x2202}x}-\left(\int w_{0}\,\text{d}t\right)\frac{1}{\ell }\frac{\unicode[STIX]{x2202}c_{0}}{\unicode[STIX]{x2202}s}\quad \text{for }S\gg 1,\end{eqnarray}$$
when the diffusion term in (3.20) becomes negligibly small, whereas in the general case
 $S\sim 1$
the solution is more complicated and requires consideration of the variation with
 $\unicode[STIX]{x1D702}$
of the axial and azimuthal velocity components
 $u_{0}=\text{Re}\left(\text{i}\text{e}^{\text{i}t}U\right)$
and
 $w_{0}=\text{Re}\left(\text{i}\text{e}^{\text{i}t}W\right)$
. The functions
 $U(x,\unicode[STIX]{x1D702},s)$
and
 $W(x,\unicode[STIX]{x1D702},s)$
, obtained in appendix A, can be used to write
 $$\begin{eqnarray}u_{0}=\text{Re}\left(\text{i}\text{e}^{\text{i}t}\frac{\text{d}P^{\prime }}{\text{d}x}G\right)\quad \text{and}\quad w_{0}=\text{Re}\left(\text{i}\text{e}^{\text{i}t}\frac{1}{\ell }\frac{\unicode[STIX]{x2202}\hat{P}}{\unicode[STIX]{x2202}s}G\right),\end{eqnarray}$$
where the dependence on
 $\unicode[STIX]{x1D702}$
is carried by the function
 $$\begin{eqnarray}G=1-\frac{\cosh \left[{\displaystyle \frac{\unicode[STIX]{x1D6FC}\bar{h}}{2}}{\displaystyle \frac{1+\text{i}}{\sqrt{2}}}\left(2\unicode[STIX]{x1D702}-1\right)\right]}{\cosh \left[{\displaystyle \frac{\unicode[STIX]{x1D6FC}\bar{h}}{2}}{\displaystyle \frac{1+\text{i}}{\sqrt{2}}}\right]}.\end{eqnarray}$$
The functions
 $P^{\prime }(x)$
and
 $\hat{P}(x,s)$
in (3.22), independent of
 $\unicode[STIX]{x1D702}$
, define the spatial variation of the leading-order pressure functions
 $p^{\prime }$
and
 $\hat{p}$
. Using (3.22) together with
 $\tilde{c}_{1}=\text{Re}(\text{e}^{\text{i}t}\tilde{C}_{1})$
in (3.20) yields
 $$\begin{eqnarray}\frac{1}{\unicode[STIX]{x1D6FC}^{2}S\bar{h}^{2}}\frac{\unicode[STIX]{x2202}^{2}\tilde{C}_{1}}{\unicode[STIX]{x2202}\unicode[STIX]{x1D702}^{2}}-\text{i}\tilde{C}_{1}=\text{i}G\left(\frac{\text{d}P^{\prime }}{\text{d}x}\frac{\unicode[STIX]{x2202}c_{0}}{\unicode[STIX]{x2202}x}+\frac{1}{\ell }\frac{\unicode[STIX]{x2202}\hat{P}}{\unicode[STIX]{x2202}s}\frac{1}{\ell }\frac{\unicode[STIX]{x2202}c_{0}}{\unicode[STIX]{x2202}s}\right),\quad \frac{\unicode[STIX]{x2202}\tilde{C}_{1}}{\unicode[STIX]{x2202}\unicode[STIX]{x1D702}}=0\quad \text{at }\unicode[STIX]{x1D702}=0,1\end{eqnarray}$$
which can be integrated to give
 $$\begin{eqnarray}\tilde{C}_{1}=-F\left(\frac{\text{d}P^{\prime }}{\text{d}x}\frac{\unicode[STIX]{x2202}c_{0}}{\unicode[STIX]{x2202}x}+\frac{1}{\ell }\frac{\unicode[STIX]{x2202}\hat{P}}{\unicode[STIX]{x2202}s}\frac{1}{\ell }\frac{\unicode[STIX]{x2202}c_{0}}{\unicode[STIX]{x2202}s}\right),\end{eqnarray}$$
where
 $$\begin{eqnarray}\displaystyle F & = & \displaystyle \frac{\unicode[STIX]{x1D706}}{2}\left[\left(\text{e}^{\unicode[STIX]{x1D706}}\int _{0}^{1}G\text{e}^{-\unicode[STIX]{x1D706}\unicode[STIX]{x1D702}}\,\text{d}\unicode[STIX]{x1D702}+\text{e}^{-\unicode[STIX]{x1D706}}\int _{0}^{1}G\text{e}^{\unicode[STIX]{x1D706}\unicode[STIX]{x1D702}}\,\text{d}\unicode[STIX]{x1D702}\right)\frac{\text{e}^{\unicode[STIX]{x1D706}\unicode[STIX]{x1D702}}+\text{e}^{-\unicode[STIX]{x1D706}\unicode[STIX]{x1D702}}}{\text{e}^{\unicode[STIX]{x1D706}}-\text{e}^{-\unicode[STIX]{x1D706}}}\right.\nonumber\\ \displaystyle & & \displaystyle +\left.\text{e}^{-\unicode[STIX]{x1D706}\unicode[STIX]{x1D702}}\int _{0}^{\unicode[STIX]{x1D702}}G\text{e}^{\unicode[STIX]{x1D706}\bar{\unicode[STIX]{x1D702}}}\,\text{d}\bar{\unicode[STIX]{x1D702}}-\text{e}^{\unicode[STIX]{x1D706}\unicode[STIX]{x1D702}}\int _{0}^{\unicode[STIX]{x1D702}}G\text{e}^{-\unicode[STIX]{x1D706}\bar{\unicode[STIX]{x1D702}}}\,\text{d}\bar{\unicode[STIX]{x1D702}}\right],\end{eqnarray}$$
with
 $\unicode[STIX]{x1D706}=(1+\text{i}/\sqrt{2})\sqrt{S}\unicode[STIX]{x1D6FC}\bar{h}(x,s)$
. The resulting expression for
 $\tilde{c}_{1}=\text{Re}(\text{e}^{\text{i}t}\tilde{C}_{1})$
can be cast in the compact form
 $$\begin{eqnarray}\tilde{c}_{1}=-\!\left(\int u_{a}\,\text{d}t\right)\frac{\unicode[STIX]{x2202}c_{0}}{\unicode[STIX]{x2202}x}-\left(\int w_{a}\,\text{d}t\right)\frac{1}{\ell }\frac{\unicode[STIX]{x2202}c_{0}}{\unicode[STIX]{x2202}s}\end{eqnarray}$$
by introducing the apparent velocities
 $$\begin{eqnarray}u_{a}=\text{Re}\left(\text{i}\text{e}^{\text{i}t}\frac{\text{d}P^{\prime }}{\text{d}x}F\right)\quad \text{and}\quad w_{a}=\text{Re}\left(\text{i}\text{e}^{\text{i}t}\frac{1}{\ell }\frac{\unicode[STIX]{x2202}\hat{P}}{\unicode[STIX]{x2202}s}F\right).\end{eqnarray}$$
Equation (3.26) can be approximated by
 $$\begin{eqnarray}\displaystyle F & = & \displaystyle G+S^{-1}(G-1)+S^{-1/2}(1+S^{-1})\tanh \left(\frac{1+\text{i}}{2\sqrt{2}}\unicode[STIX]{x1D6FC}\bar{h}\right)\nonumber\\ \displaystyle & & \displaystyle \times \,\left\{\exp \left[-\frac{1+\text{i}}{\sqrt{2}}\sqrt{S}\unicode[STIX]{x1D6FC}\bar{h}\unicode[STIX]{x1D702}\right]+\exp \left[-\frac{1+\text{i}}{\sqrt{2}}\sqrt{S}\unicode[STIX]{x1D6FC}\bar{h}(1-\unicode[STIX]{x1D702})\right]\right\}\end{eqnarray}$$
for large values of the Schmidt number
 $S\gg 1$
, indicating that
 $F=G$
as
 $S\rightarrow \infty$
, with the result that
 $u_{a}=u_{0}$
and
 $w_{a}=w_{0}$
, so that (3.27) reduces to (3.21) in that limit.
The transport equation for
 $c_{0}$
can be obtained from the analysis of (3.3) at
 $O(\unicode[STIX]{x1D700}^{2})$
. The solution can be derived directly by considering the global conservation equation
 $$\begin{eqnarray}\displaystyle & & \displaystyle \frac{\unicode[STIX]{x2202}}{\unicode[STIX]{x2202}t}\left(h\int _{0}^{1}c\,\text{d}\unicode[STIX]{x1D702}\right)+\unicode[STIX]{x1D700}^{2}\frac{\unicode[STIX]{x2202}}{\unicode[STIX]{x2202}\unicode[STIX]{x1D70F}}\left(h\int _{0}^{1}c\text{d}\unicode[STIX]{x1D702}\right)\nonumber\\ \displaystyle & & \displaystyle \quad +\,\frac{\unicode[STIX]{x1D700}}{\ell }\left[\frac{\unicode[STIX]{x2202}}{\unicode[STIX]{x2202}x}\left(\ell h\int _{0}^{1}uc\text{d}\unicode[STIX]{x1D702}\right)+\frac{\unicode[STIX]{x2202}}{\unicode[STIX]{x2202}s}\left(h\int _{0}^{1}wc\,\text{d}\unicode[STIX]{x1D702}\right)\right]=0,\end{eqnarray}$$
obtained by integrating (3.3) between
 $\unicode[STIX]{x1D702}=0$
and
 $\unicode[STIX]{x1D702}=1$
. Writing (3.30) for the two-time formalism and introducing the expansions (2.3), (2.4) and (3.4) provides
 $$\begin{eqnarray}\displaystyle & & \displaystyle \bar{h}\frac{\unicode[STIX]{x2202}c_{0}}{\unicode[STIX]{x2202}\unicode[STIX]{x1D70F}}+\left(\bar{h}\int _{0}^{1}\langle u_{1}\rangle \,\text{d}\unicode[STIX]{x1D702}+\int _{0}^{1}\langle h_{0}^{\prime }u_{0}\rangle \,\text{d}\unicode[STIX]{x1D702}\right)\frac{\unicode[STIX]{x2202}c_{0}}{\unicode[STIX]{x2202}x}+\left(\bar{h}\int _{0}^{1}\langle w_{1}\rangle \,\text{d}\unicode[STIX]{x1D702}+\int _{0}^{1}\langle h_{0}^{\prime }w_{0}\rangle \,\text{d}\unicode[STIX]{x1D702}\right)\frac{1}{\ell }\frac{\unicode[STIX]{x2202}c_{0}}{\unicode[STIX]{x2202}s}\nonumber\\ \displaystyle & & \displaystyle \quad +\,\frac{1}{\ell }\frac{\unicode[STIX]{x2202}}{\unicode[STIX]{x2202}x}\left(\ell \bar{h}\int _{0}^{1}\langle u_{0}\tilde{c}_{1}\rangle \,\text{d}\unicode[STIX]{x1D702}\right)+\frac{1}{\ell }\frac{\unicode[STIX]{x2202}}{\unicode[STIX]{x2202}s}\left(\bar{h}\int _{0}^{1}\langle w_{0}\tilde{c}_{1}\rangle \,\text{d}\unicode[STIX]{x1D702}\right)=0\end{eqnarray}$$
after taking the time average and accounting for the conditions
 $\unicode[STIX]{x2202}c_{0}/\unicode[STIX]{x2202}\unicode[STIX]{x1D702}=0$
and
 $\langle u_{0}\rangle =\langle w_{0}\rangle =0$
.
As can be inferred from observation of (2.31) and (2.32), the factors in the apparent convective terms in the first line of (3.31) correspond to the width-averaged Lagrangian velocity components
 $\int u_{L}\,\text{d}\unicode[STIX]{x1D702}$
and
 $\int w_{L}\,\text{d}\unicode[STIX]{x1D702}$
, except for the last Stokes-drift terms in (2.31) and (2.32), which are missing in (3.31). The integrals in the second line of (3.31) account for the interactions of the fluctuations of concentration with the fluctuations of velocity. When
 $S\gg 1$
the fluctuations of concentration, given in (3.21), are not affected by diffusion and the interactions described by the last two terms in (3.31) result in the missing contribution to the Stokes-drift convective transport, as can be seen by using (3.21) to write
 $$\begin{eqnarray}\displaystyle & & \displaystyle \frac{1}{\ell }\frac{\unicode[STIX]{x2202}}{\unicode[STIX]{x2202}x}\left(\ell \bar{h}\int _{0}^{1}\langle u_{0}\tilde{c}_{1}\rangle \,\text{d}\unicode[STIX]{x1D702}\right)+\frac{1}{\ell }\frac{\unicode[STIX]{x2202}}{\unicode[STIX]{x2202}s}\left(\bar{h}\int _{0}^{1}\langle w_{0}\tilde{c}_{1}\rangle \,\text{d}\unicode[STIX]{x1D702}\right)\nonumber\\ \displaystyle & & \displaystyle \quad =\frac{1}{\ell }\frac{\unicode[STIX]{x2202}}{\unicode[STIX]{x2202}s}\left(\bar{h}\int _{0}^{1}\left\langle u_{0}\int w_{0}\,\text{d}t\right\rangle \text{d}\unicode[STIX]{x1D702}\right)\frac{\unicode[STIX]{x2202}c_{0}}{\unicode[STIX]{x2202}x}+\frac{\unicode[STIX]{x2202}}{\unicode[STIX]{x2202}x}\left(\bar{h}\int _{0}^{1}\left\langle w_{0}\int u_{0}\,\text{d}t\right\rangle \text{d}\unicode[STIX]{x1D702}\right)\frac{1}{\ell }\frac{\unicode[STIX]{x2202}c_{0}}{\unicode[STIX]{x2202}s}.\nonumber\\ \displaystyle & & \displaystyle\end{eqnarray}$$
Consequently, in the limit
 $S\gg 1$
the transport equation (3.31) reduces to (3.13), which was derived earlier from (3.9) by considering values of
 $\unicode[STIX]{x1D70E}=\unicode[STIX]{x1D700}^{2}S\ll 1$
.
In the general case
 $S\sim 1$
, the effect of transverse diffusion modifies the short-time fluctuations
 $\tilde{c}_{1}$
, as described by (3.27). In this case, the interactions of these fluctuations with the fluctuations of velocity, described by the non-uniform velocity profiles
 $u_{0}$
and
 $w_{0}$
, lead to Taylor dispersion in the azimuthal and axial directions, providing an additional transport mechanism for the solute, supplemental to the convection associated with the time-averaged Lagrangian motion. Using (3.27) in evaluating in (3.31) the integrals containing
 $\tilde{c}_{1}$
and rearranging the result to isolate the effect of Taylor dispersion lead to
 $$\begin{eqnarray}\displaystyle & & \displaystyle \bar{h}\frac{\unicode[STIX]{x2202}c_{0}}{\unicode[STIX]{x2202}\unicode[STIX]{x1D70F}}+\bar{h}\left(\int _{0}^{1}u_{L}\,\text{d}\unicode[STIX]{x1D702}\right)\frac{\unicode[STIX]{x2202}c_{0}}{\unicode[STIX]{x2202}x}+\bar{h}\left(\int _{0}^{1}w_{L}\,\text{d}\unicode[STIX]{x1D702}\right)\frac{1}{\ell }\frac{\unicode[STIX]{x2202}c_{0}}{\unicode[STIX]{x2202}s}=\frac{1}{\ell }\frac{\unicode[STIX]{x2202}}{\unicode[STIX]{x2202}x}\left(\ell D_{xx}\frac{\unicode[STIX]{x2202}c_{0}}{\unicode[STIX]{x2202}x}\right)\nonumber\\ \displaystyle & & \displaystyle \quad +\,\frac{1}{\ell }\frac{\unicode[STIX]{x2202}}{\unicode[STIX]{x2202}x}\left(D_{xs}\frac{\unicode[STIX]{x2202}c_{0}}{\unicode[STIX]{x2202}s}\right)+\frac{1}{\ell }\frac{\unicode[STIX]{x2202}}{\unicode[STIX]{x2202}s}\left(D_{sx}\frac{\unicode[STIX]{x2202}c_{0}}{\unicode[STIX]{x2202}x}\right)+\frac{1}{\ell }\frac{\unicode[STIX]{x2202}}{\unicode[STIX]{x2202}s}\left(D_{ss}\frac{1}{\ell }\frac{\unicode[STIX]{x2202}c_{0}}{\unicode[STIX]{x2202}s}\right),\end{eqnarray}$$
involving the width-averaged Lagrangian velocities given in (2.31) and (2.32) along with the Taylor diffusivities
 $$\begin{eqnarray}\left.\begin{array}{@{}c@{}}D_{xx}(x,s)=\bar{h}\displaystyle \int _{0}^{1}\left\langle u_{0}\left(\displaystyle \int u_{a}\,\text{d}t\right)\right\rangle \text{d}\unicode[STIX]{x1D702},\\ D_{xs}(x,s)=\bar{h}\displaystyle \int _{0}^{1}\left\langle u_{0}\left(\displaystyle \int (w_{a}-w_{0})\,\text{d}t\right)\right\rangle \text{d}\unicode[STIX]{x1D702},\\ D_{sx}(x,s)=\bar{h}\displaystyle \int _{0}^{1}\left\langle w_{0}\left(\displaystyle \int (u_{a}-u_{0})\,\text{d}t\right)\right\rangle \text{d}\unicode[STIX]{x1D702},\\ D_{ss}(x,s)=\bar{h}\displaystyle \int _{0}^{1}\left\langle w_{0}\left(\displaystyle \int w_{a}\,\text{d}t\right)\right\rangle \text{d}\unicode[STIX]{x1D702}.\end{array}\right\}\end{eqnarray}$$
Since
 $u_{a}=u_{0}$
and
 $w_{a}=w_{0}$
for
 $S\gg 1$
, it is clear from the definitions (3.34) that all diffusivities vanish as
 $S\rightarrow \infty$
, so that (3.33) naturally reduces to (3.13) in this limit. An integral conservation equation, the counterpart of (3.10) for
 $S\sim 1$
, can be derived by integrating (3.33) to give
 $$\begin{eqnarray}\frac{\unicode[STIX]{x2202}}{\unicode[STIX]{x2202}\unicode[STIX]{x1D70F}}\left\{\int _{x}^{1}\left[\ell \int _{0}^{1}c_{0}\bar{h}\,\text{d}s\right]\text{d}x\right\}=\unicode[STIX]{x1D719}_{c},\end{eqnarray}$$
where
 $$\begin{eqnarray}\unicode[STIX]{x1D719}_{c}=\ell \int _{0}^{1}\left(\int _{0}^{1}u_{L}\,\text{d}\unicode[STIX]{x1D702}\right)c_{0}\bar{h}\,\text{d}s-\ell \int _{0}^{1}D_{xx}\frac{\unicode[STIX]{x2202}c_{0}}{\unicode[STIX]{x2202}x}\,\text{d}s-\int _{0}^{1}D_{xs}\frac{\unicode[STIX]{x2202}c_{0}}{\unicode[STIX]{x2202}s}\,\text{d}s\end{eqnarray}$$
is the solute flux across section
 $x$
.
4 Selected results for a model problem
The time-averaged transport equation for the solute takes different forms depending on the value of the Schmidt number. For
 $S\sim \unicode[STIX]{x1D700}^{-2}\gg 1$
the solute concentration at leading order
 $c_{0}(x,\unicode[STIX]{x1D702},s,\unicode[STIX]{x1D70F})$
is obtained from the reduced transport equation (3.9), involving transverse diffusion across the width of the canal and convective transport, the latter driven by the time-averaged Lagrangian velocity
 $(u_{L},v_{L},w_{L})$
. For
 $S\sim 1$
the solute concentration
 $c_{0}(x,s,\unicode[STIX]{x1D70F})$
is found to be uniform across the width of the canal in the first approximation as a result of the dominant effect of transverse diffusion. As seen in the associated transport equation (3.33), convective transport involves the width-averaged axial and azimuthal components of the Lagrangian velocity, while the apparent diffusion terms resulting from the interactions of the small fluctuations of the concentration with the pulsatile flow are expressed in terms of Taylor diffusivities.
The relevant transport coefficients, i.e.
 $u_{L}$
,
 $v_{L}$
, and
 $w_{L}$
in (3.9) and
 $\int _{0}^{1}u_{L}\,\text{d}\unicode[STIX]{x1D702}$
,
 $\int _{0}^{1}w_{L}\,\text{d}\unicode[STIX]{x1D702}$
,
 $D_{xx}$
,
 $D_{xs}$
,
 $D_{sx}$
and
 $D_{ss}$
in (3.33), can be evaluated using the expressions given in appendix A for the Eulerian velocity components and wall deformation, along with the expressions given in (3.34) for the Taylor diffusivities. The results depend on two order-unity parameters, namely, the Womersley number
 $\unicode[STIX]{x1D6FC}$
defined in (A 6), which measures the relative importance of viscous forces, and the dimensionless wavenumber defined in (A 2), which enters in the elastic equation (A 1) relating the pressure with the canal deformation, with the Taylor diffusivities (3.34) having an additional dependence on the Schmidt number
 $S$
, entering in (3.28) through the function
 $F$
given in (3.26). The geometry of the canal is defined by two non-dimensional functions of order unity, namely, the inner perimeter
 $\ell (x)$
and unperturbed canal width
 $\bar{h}(x,s)$
. Additionally, a compliance function
 $\unicode[STIX]{x1D6FE}(x,s)\sim 1$
is introduced for generality to describe the spatial variation of the elastic properties of the outer dura membrane.
Although the formulation given above can be used to describe transport in anatomically correct spinal-canal geometries through introduction of appropriately selected functions
 $\ell (x)$
,
 $\bar{h}(x,s)$
and
 $\unicode[STIX]{x1D6FE}(x,s)$
, to illustrate the most prominent features of the drug-dispersion process we shall use in the following computations the simplified model geometry employed in Sánchez et al. (Reference Sánchez, Martínez-Bazán, Gutiérrez-Montes, Criado-Hidalgo, Pawlak, Bradley, Haughton and Lasheras2018) to evaluate the Eulerian velocity. Following our previous work, the SAS is modelled as an annular canal with uniform elastic properties (i.e.
 $\unicode[STIX]{x1D6FE}=1$
) bounded between two eccentric parallel circular cylinders whose radii differ by a small amount
 $h_{c}$
and their axes are displaced by
 $\unicode[STIX]{x1D6FD}h_{c}$
with
 $0\leqslant \unicode[STIX]{x1D6FD}<1$
, so that
 $\ell =1$
and
 $\bar{h}=1-\unicode[STIX]{x1D6FD}\cos (2\unicode[STIX]{x03C0}s)$
. The resulting canal geometry is schematically represented in figure 2(a). We begin by evaluating time-averaged Lagrangian velocities and Taylor diffusivities for different values of
 $\unicode[STIX]{x1D6FC}$
,
 $k$
and
 $\unicode[STIX]{x1D6FD}$
. The results are then used in computations of the temporal evolution of solute distributions from a prescribed initial condition. The quantitative results given below will serve to assess the relative importance of the different transport mechanisms.
A schematic view of the model geometry used in the numerical evaluations (a) and the associated distributions of Lagrangian velocity components at different sections
 $x$
for
 $\unicode[STIX]{x1D6FD}=0.5$
,
 $\unicode[STIX]{x1D6FC}=3$
,
 $k=0.5$
(b).

4.1 Time-averaged Lagrangian velocity
The expressions given in (2.26)–(2.28) together with the leading-order Eulerian velocity components
 $u_{0}$
,
 $v_{0}$
,
 $w_{0}$
, wall deformation
 $h_{0}^{\prime }$
, and steady-streaming components
 $\langle u_{1}\rangle$
,
 $\langle v_{1}\rangle$
and
 $\langle w_{1}\rangle$
can be used to evaluate
 $(u_{L},v_{L},w_{L})$
. Figure 2(b) shows the resulting distributions at different sections
 $x$
for
 $\unicode[STIX]{x1D6FD}=0.5$
,
 $\unicode[STIX]{x1D6FC}=3$
and
 $k=0.5$
, with the width of the annular cross-section arbitrarily enlarged to facilitate visualization. As expected, the distributions of
 $u_{L}$
and
 $v_{L}$
are symmetric with respect to the symmetry plane of the canal, whereas
 $w_{L}$
is antisymmetric.
For the geometry investigated, steady streaming is the dominant contribution to the Lagrangian velocity, while the contribution of Stokes drift is comparatively smaller. This is apparent when comparing the distributions of axial and azimuthal Lagrangian velocity
 $u_{L}$
and
 $w_{L}$
shown in figure 2 with the distributions of
 $\langle u_{1}\rangle$
and
 $\langle w_{1}\rangle$
, given for these same conditions in figures 5 and 6 of Sánchez et al. (Reference Sánchez, Martínez-Bazán, Gutiérrez-Montes, Criado-Hidalgo, Pawlak, Bradley, Haughton and Lasheras2018). The comparison reveals that the Lagrangian velocity and the steady-streaming velocity display the same qualitative characteristics. In particular, the axial motion is directed towards the cranial vault (i.e. negative values of
 $u_{L}$
and
 $\langle u_{1}\rangle$
) in the narrow part of the canal and towards the lumbar region in the wide part, with the azimuthal velocity being directed from the narrowest section
 $s=0$
to the widest section
 $s=0.5$
to accommodate the deceleration of the flow as the closed end is approached.
(a) Maps show the distributions of the width-averaged axial and azimuthal Lagrangian velocity components for
 $\unicode[STIX]{x1D6FD}=0.5$
,
 $\unicode[STIX]{x1D6FC}=3$
and
 $k=0.5$
, while (b) shows the parametric variation of their root-mean-square values
 $\Vert \!\int _{0}^{1}u_{L}\,\text{d}\unicode[STIX]{x1D702}\Vert$
and
 $\Vert \!\int _{0}^{1}w_{L}\,\text{d}\unicode[STIX]{x1D702}\Vert$
, with the dots indicating the values corresponding to the distributions shown in (a).

The width-averaged axial and azimuthal components of the Lagrangian velocity
 $\int _{0}^{1}u_{L}\,\text{d}\unicode[STIX]{x1D702}$
and
 $\int _{0}^{1}w_{L}\,\text{d}\unicode[STIX]{x1D702}$
, which determine the convective transport of solutes with values of the Schmidt number
 $S\ll \unicode[STIX]{x1D700}^{-2}$
, as seen in the reduced transport equations (3.13) (for
 $1\ll S\ll \unicode[STIX]{x1D700}^{-2}$
) and (3.33) (for
 $S\sim 1$
), are plotted in figure 3(a) for the same conditions as figure 2. Parametric dependences on the three controlling parameters
 $\unicode[STIX]{x1D6FD}$
,
 $\unicode[STIX]{x1D6FC}$
and
 $k$
, are investigated in figure 3(b) by showing the variation of the root-mean-square values
 $\Vert \!\int _{0}^{1}u_{L}\,\text{d}\unicode[STIX]{x1D702}\Vert$
and
 $\Vert \!\int _{0}^{1}w_{L}\,\text{d}\unicode[STIX]{x1D702}\Vert$
(where
 $\Vert \cdot \Vert =[\int _{0}^{1}\int _{0}^{1}(\cdot )^{2}\,\text{d}s\,\text{d}x]^{1/2}$
) with each individual parameter, while keeping the other two at the fixed constant values of figure 2.
The results in figure 3 indicate that for axisymmetric configurations, corresponding in the model to the case
 $\unicode[STIX]{x1D6FD}=0$
of concentric cylinders, the azimuthal motion is absent, and the resulting width-averaged axial velocity is strictly zero, as follows from the continuity equation (2.30). This feature of the solution underscores the important role of eccentricity, in that if the spinal canal had perfect axial symmetry, convective transport would be drastically limited. Non-zero values of
 $\int _{0}^{1}u_{L}\,\text{d}\unicode[STIX]{x1D702}$
and
 $\int _{0}^{1}w_{L}\,\text{d}\unicode[STIX]{x1D702}$
are found for any
 $\unicode[STIX]{x1D6FD}>0$
, with the motion being most pronounced for an intermediate value (i.e.
 $\unicode[STIX]{x1D6FD}\simeq 0.4$
for
 $\unicode[STIX]{x1D6FC}=3$
, and
 $k=0.5$
). The existence of a maximum in the curves is partly attributable to the fact that, for increasing values of
 $\unicode[STIX]{x1D6FD}$
, the canal becomes narrower near
 $s=0$
, promoting the action of viscous forces there. The resulting local flow slows down, diminishing the contribution of this region to the net values of
 $\Vert \!\int _{0}^{1}u_{L}\,\text{d}\unicode[STIX]{x1D702}\Vert$
and
 $\Vert \!\int _{0}^{1}w_{L}\,\text{d}\unicode[STIX]{x1D702}\Vert$
, so that the variation of these two quantities with increasing
 $\unicode[STIX]{x1D6FD}$
shows a decline after reaching a maximum, as observed in figure 3.
The effect of viscous forces is measured in the problem through the Womersley number
 $\unicode[STIX]{x1D6FC}=h_{c}/(\unicode[STIX]{x1D708}/\unicode[STIX]{x1D714})^{1/2}$
. When this effect is dominant for
 $\unicode[STIX]{x1D6FC}\ll 1$
, the resulting pulsating flow is very slow and the associated Lagrangian motion, involving time-averaged products of fluctuations, becomes negligibly slow. In the opposite limit
 $\unicode[STIX]{x1D6FC}\gg 1$
effects of viscosity are confined to near-wall Stokes layers. The numerical evaluations reveal a persistent Lagrangian motion with associated root-mean-square velocities that approach finite values for
 $\unicode[STIX]{x1D6FC}\gg 1$
. It is of interest that, for intermediate values
 $\unicode[STIX]{x1D6FC}\sim 1$
, pertaining to spinal-canal flow conditions, the curves of
 $\Vert \!\int _{0}^{1}u_{L}\,\text{d}\unicode[STIX]{x1D702}\Vert$
and
 $\Vert \!\int _{0}^{1}w_{L}\,\text{d}\unicode[STIX]{x1D702}\Vert$
in figure 3 display a non-monotonic variation, with maxima reached at
 $\unicode[STIX]{x1D6FC}\simeq 4$
followed by local minima around
 $\unicode[STIX]{x1D6FC}\simeq 10$
.
The last column in figure 3 investigates the influence of the wavenumber
 $k$
, which measures the ratio of the canal length to the characteristic elastic wavelength, a parameter of order unity in the spinal canal, as shown by magnetic resonance imaging (MRI) measurements (Kalata et al.
Reference Kalata, Martin, Oshinski, Jerosch-Herold, Royston and Loth2009). This parameter determines the amplitude of the tidal volume flux for the leading-order oscillatory flow, as shown in Sánchez et al. (Reference Sánchez, Martínez-Bazán, Gutiérrez-Montes, Criado-Hidalgo, Pawlak, Bradley, Haughton and Lasheras2018). The numerical computations reveal finite values of
 $\Vert \!\int _{0}^{1}u_{L}\,\text{d}\unicode[STIX]{x1D702}\Vert$
and
 $\Vert \!\int _{0}^{1}w_{L}\,\text{d}\unicode[STIX]{x1D702}\Vert$
for
 $k\ll 1$
, corresponding to canal deformations that are everywhere in phase with the cranial pressure variation. The Lagrangian velocities increase initially with increasing
 $k$
, but eventually decrease to vanish in the short-wavelength limit
 $k\gg 1$
, associated with vanishing tidal volume fluxes. The most vigorous Lagrangian motion is found around
 $k\simeq 1$
, associated with the peak in the amplitude of the tidal volume flux (see figure 2 in Sánchez et al.
Reference Sánchez, Martínez-Bazán, Gutiérrez-Montes, Criado-Hidalgo, Pawlak, Bradley, Haughton and Lasheras2018).
The complicated parametric dependences of the Lagrangian motion revealed by the strong non-monotonic dependences shown in figure 3 emphasize the need for detailed descriptions of the geometry and elastic properties in future quantitative analyses of CSF flow in the spinal canal.
4.2 Taylor diffusivities in the spinal canal
The diffusion terms in (3.33) describe the dispersion resulting from the interactions of the short-time fluctuations of concentration and velocity, when the former are influenced by transverse diffusion. The relative contribution of this additional transport mechanism to the dispersion of the solute along the canal depends on the values of the Taylor diffusivities (3.34), to be compared with the width-averaged Lagrangian velocities, which determine in (3.33) the convective transport. For the model geometry considered here, the values of
 $\int _{0}^{1}u_{L}\,\text{d}\unicode[STIX]{x1D702}$
and
 $\int _{0}^{1}w_{L}\,\text{d}\unicode[STIX]{x1D702}$
are shown in figure 3(a) for
 $\unicode[STIX]{x1D6FD}=0.5$
,
 $\unicode[STIX]{x1D6FC}=3$
and
 $k=0.5$
. Corresponding distributions of
 $D_{xx}$
,
 $D_{xs}$
,
 $D_{sx}$
and
 $D_{ss}$
are given in figure 4 for
 $S=1$
.
The distributions of the Taylor diffusivities for
 $\unicode[STIX]{x1D6FD}=0.5$
,
 $\unicode[STIX]{x1D6FC}=3$
,
 $k=0.5$
and
 $S=1$
.

A first observation from the numerical results is that, even for this case of very diffusive solutes with
 $S=1$
, the magnitude of the Taylor diffusivities is relatively small, compared with those of the width-averaged axial and azimuthal Lagrangian velocities. The axial diffusivity exhibits the largest values
 $D_{xx}\sim 0.1$
, while the other three diffusivities remain everywhere smaller than 0.01, with
 $D_{ss}$
showing the smallest values.
The spatial distributions of axial diffusivity
 $D_{xx}$
and azimuthal diffusivity
 $D_{ss}$
, symmetric about
 $s=0.5$
, show a strong correlation with the distributions of the amplitudes of the oscillatory velocity components
 $|u_{0}|$
and
 $|w_{0}|$
. Thus, the distribution of
 $D_{xx}$
is concentrated near the entrance in the widest part of the canal (
 $s=0.5$
), where the axial motion is more pronounced. Similarly, the distribution of
 $D_{ss}$
shows two longitudinal bands centred about
 $s\simeq 0.25$
and
 $s\simeq 0.75$
, corresponding to the peaks of the azimuthal velocity amplitude
 $|w_{0}|$
. Outside these distinct regions the diffusivities are found to be negligibly small, that being a result of the quadratic dependence of
 $D_{xx}$
and
 $D_{ss}$
on the fluctuations. The diffusivities
 $D_{xs}$
and
 $D_{sx}$
are antisymmetric about
 $s=0.5$
, and therefore show positive and negative values, with spatial distributions that tend to be more uniform than those of
 $D_{xx}$
and
 $D_{ss}$
.
Parametric dependences of the Taylor diffusivities are investigated in figure 5 by plotting their root-mean-square values. The plots are generated by varying one of the four controlling parameters
 $\unicode[STIX]{x1D6FD}$
,
 $\unicode[STIX]{x1D6FC}$
,
 $k$
and
 $S$
at a time, while keeping the other three constant and equal to the values employed in figure 4. Due to the absence of azimuthal motion in axisymmetric canals, for
 $\unicode[STIX]{x1D6FD}=0$
the only non-zero diffusivity is
 $D_{xx}$
. All diffusivities increase for increasing values of the eccentricity and reach their maximum values at
 $\unicode[STIX]{x1D6FD}=1$
. By way of contrast, the curves showing the variations with
 $\unicode[STIX]{x1D6FC}$
,
 $k$
and
 $S$
are non-monotonic, with diffusivities peaking at intermediate values of these controlling parameters. The computations with varying Schmidt number were extended up to
 $S=1000$
, a value representative of the drugs used in intrathecal delivery procedures. As can be seen, the resulting diffusivities are negligibly small for
 $S>100$
, indicating that shear-enhanced dispersion is ineffective under conditions of interest for therapeutical applications, for which the mean Lagrangian motion becomes the dominant transport mechanism. This is to be further assessed in the time-dependent computations given below.
The parametric variation of the root-mean-square values of the Taylor diffusivities, with the dots indicating the values corresponding to the distributions shown in figure 4.

4.3 Numerical computations of solute dispersion
Once the time-averaged Lagrangian velocities and Taylor diffusivities are evaluated for given values of the governing parameters and geometry, the computation of the solute dispersion reduces to the integration of a linear transport equation, given in (3.9) for
 $\unicode[STIX]{x1D70E}=\unicode[STIX]{x1D700}^{2}S\sim 1$
and in (3.33) for
 $S\sim 1$
, with the simpler equation (3.13) applying in the intermediate case
 $1\ll S\ll \unicode[STIX]{x1D700}^{-2}$
. In these equations convective transport is driven by the time-averaged Lagrangian velocity, given by the sum of the steady-streaming and Stokes-drift components. Taylor dispersion emerges in (3.33) as an additional transport mechanism for solutes with
 $S\sim 1$
. Although this mechanism in principle can be important, in view of the relative magnitude of the width-averaged velocities
 $\int _{0}^{1}u_{L}\,\text{d}\unicode[STIX]{x1D702}$
and
 $\int _{0}^{1}w_{L}\,\text{d}\unicode[STIX]{x1D702}$
, shown in figure 3, and the much smaller Taylor diffusivities, shown in figures 4 and 5, it can be anticipated that, even for
 $S\sim 1$
, convection largely dominates the transport of the solute under most conditions, as verified in the integrations below. The only exception is that of perfectly axisymmetric canals (i.e. with
 $\bar{h}=\bar{h}(x)$
and
 $\unicode[STIX]{x1D6FE}=\unicode[STIX]{x1D6FE}(x)$
), for which the azimuthal motion is absent, with the result that the width-averaged axial velocity along the closed-end canal is identically zero, as follows from (2.30), so that (3.33) reduces to
 $$\begin{eqnarray}\bar{h}\frac{\unicode[STIX]{x2202}c_{0}}{\unicode[STIX]{x2202}\unicode[STIX]{x1D70F}}=\frac{1}{\ell }\frac{\unicode[STIX]{x2202}}{\unicode[STIX]{x2202}x}\left(\ell D_{xx}\frac{\unicode[STIX]{x2202}c_{0}}{\unicode[STIX]{x2202}x}\right).\end{eqnarray}$$
This case, of some academic interest, is analysed separately in appendix B. The results are, however, of limited practical relevance for solute transport in the spinal canal, because of the lack of axial symmetry therein. For that reason, the remaining computations shown here consider instead an eccentric canal, a geometry that is more relevant in connection with ITDD applications.
Distributions of width-averaged concentration
 $\int _{0}^{1}c_{0}\,\text{d}\unicode[STIX]{x1D702}$
at different instants of time as obtained numerically for
 $\unicode[STIX]{x1D6FD}=0.5$
,
 $\unicode[STIX]{x1D6FC}=3$
and
 $k=0.5$
by integration of (3.9) with
 $\unicode[STIX]{x1D70E}=10$
(a) and
 $\unicode[STIX]{x1D70E}=1$
(b), by integration of (3.13) (c) and by integration of (3.33) with
 $S=1$
(d). The axial distribution of the average concentration at each canal section
 $\int _{0}^{1}\bar{h}\int _{0}^{1}c_{0}\,\text{d}\unicode[STIX]{x1D702}\,\text{d}s$
is indicated along the right side of each panel.

The variation with time of the solute flux
 $\unicode[STIX]{x1D719}_{c}(\unicode[STIX]{x1D70F})$
at three different sections
 $x=(0,0.25,0.5)$
for
 $\unicode[STIX]{x1D6FD}=0.5$
,
 $\unicode[STIX]{x1D6FC}=3$
and
 $k=0.5$
. The value of
 $\unicode[STIX]{x1D719}_{c}$
for
 $S=1$
(thin dot-dashed curves) and
 $S=50$
(thick dot-dashed curves) was evaluated from (3.36), whereas that for
 $1\ll S\ll \unicode[STIX]{x1D700}^{-2}$
(thick solid curves) was evaluated from (4.2) and that for
 $\unicode[STIX]{x1D70E}=\unicode[STIX]{x1D700}^{2}S=1$
(thick dashed curves) and
 $\unicode[STIX]{x1D70E}=\unicode[STIX]{x1D700}^{2}S=10$
(thin dashed curves) was evaluated from (3.11).

The results given in figures 6 and 7 correspond to an eccentricity
 $\unicode[STIX]{x1D6FD}=0.5$
, a Womersley number
 $\unicode[STIX]{x1D6FC}=3$
, and a non-dimensional wavenumber
 $k=0.5$
. The corresponding Lagrangian velocity components and associated width-averaged values displayed in figures 2 and 3, whereas the Taylor diffusivities for
 $S=1$
are shown in figure 4. The numerical computations, employing a second-order central finite-difference approximation for the spatial discretizations and a Runge–Kutta
 $4/5$
method for the time advancement, consider a solute delivered at
 $\unicode[STIX]{x1D70F}=0$
in a localized region centred about
 $x=0.75$
. The resulting distributions of width-averaged concentration
 $\int _{0}^{1}c_{0}\,\text{d}\unicode[STIX]{x1D702}$
as a function of
 $x$
and
 $s$
at different instants of time are shown in figure 6 for different solute diffusivities. For improved clarity, the azimuthal coordinate in the plots is extended beyond the range
 $0<s<1$
, with values of
 $\int _{0}^{1}c_{0}\,\text{d}\unicode[STIX]{x1D702}$
at
 $s<0$
corresponding to those at
 $1+s$
and values at
 $s>1$
corresponding to those at
 $s-1$
. The axial distribution of the averaged concentration at each section
 $x$
, computed according to
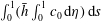 $\int _{0}^{1}(\bar{h}\int _{0}^{1}c_{0}\,\text{d}\unicode[STIX]{x1D702})\,\text{d}s$
, is indicated on the side of each individual panel.
Results of integrations of (3.9) for
 $\unicode[STIX]{x1D70E}=\unicode[STIX]{x1D700}^{2}S=10$
and
 $\unicode[STIX]{x1D70E}=\unicode[STIX]{x1D700}^{2}S=1$
are shown in figures 6(a) and 6(b), respectively, while figure 6(c) shows results for
 $1\ll S\ll \unicode[STIX]{x1D700}^{-2}$
, obtained from (3.13), and figure 6(d) shows results for
 $S=1$
, computed with use of (3.33). With the characteristic value of
 $\unicode[STIX]{x1D700}$
being of order
 $\unicode[STIX]{x1D700}\sim 1/50$
and the Schmidt number of drugs typically used in ITDD procedures being of order
 $S\sim 1000$
, it appears that the conditions investigated in figure 6(b) are directly relevant to drug dispersion in the spinal canal, while the results for
 $\unicode[STIX]{x1D70E}=\unicode[STIX]{x1D700}^{2}S=10$
, corresponding to Schmidt numbers of order
 $S\sim 25\,000$
, are representative of transport of radioactive or fluorescence tracers, used in clinical studies. On the other hand, the results for
 $S=1$
, corresponding to mixing of two gases, are included to illustrate effects of Taylor dispersion and the intermediate case
 $1\ll S\ll \unicode[STIX]{x1D700}^{-2}$
is included to test the predictive capability of the simplified transport equation (3.13).
For all of the computations shown in figure 6 the initial concentration is given by the Gaussian distribution
 $c_{i}=\exp [-16^{2}(x-0.75)^{2}]$
. The integration of (3.9) employs the boundary conditions
 $\unicode[STIX]{x2202}c_{0}/\unicode[STIX]{x2202}\unicode[STIX]{x1D702}=0$
at
 $\unicode[STIX]{x1D702}=0,1$
, corresponding to impermeable bounding surfaces. Additionally, a boundary condition must be specified for
 $c_{0}$
at the open boundary
 $x=0$
. Since convection is the only axial transport mechanism in (3.9), the appropriate condition is determined by the sign of
 $u_{L}$
at
 $x=0$
, indicated by blue (upward) and red (downward) colours in the upper left circular plot of figure 2. In regions of upward flow (negative values of
 $u_{L}$
) the concentration is given by that within the canal at earlier times, whereas in regions of downward flow (positive values of
 $u_{L}$
) the concentration is that found outside the canal, assumed to be
 $c_{0}=0$
in our integrations. The same boundary conditions are used at the canal entrance
 $x=0$
when integrating (3.13). On the other hand, the presence of Taylor dispersion in (3.33), involving second-order spatial derivatives, necessitates introduction of suitable modified boundary conditions at the entrance
 $x=0$
, but not at the closed end
 $x=1$
, because there the diffusion rate vanishes as a result of the zero values of
 $D_{xx}$
,
 $D_{xs}$
and
 $D_{sx}$
, which are apparent in the plots of figure 4. As discussed by Hydon & Pedley (Reference Hydon and Pedley1993) in connection with axial dispersion in a channel with oscillating walls, the determination of the entry conditions requires in principle consideration of the flow outside the canal, which would be dependent upon the specific geometry found there. To avoid this complicating aspect of the problem, in the integrations reported in figure 6(d) we chose a simplified computational strategy, in which the axial diffusive transport across the boundary at
 $x=0$
is eliminated, and in which the axial convective transport is treated as described before, i.e. in regions of inflow the concentration is set to zero, whereas in regions of outflow it is determined by its value within the canal at earlier times.
A notable finding of the numerical integrations in figure 6 is the striking qualitative agreement of the different transport patterns, that being a result of the dominant effect of convection driven by the Lagrangian motion, with the axial velocity
 $u_{L}$
largely determining the evolution of the solute in all cases. As expected from the distributions of
 $u_{L}$
shown in figure 3, regardless of the Schmidt number the solute is transported rapidly towards the canal entrance along the preferential path
 $s=0$
(or
 $s=1$
), corresponding to the narrow part of the canal where we find large negative values of
 $u_{L}$
.
The extent of the effects of Taylor dispersion can be assessed by comparing the snapshots in figure 6(d), corresponding to
 $S=1$
, with the dispersion-free results shown in figure 6(c) for the same rescaled times. As can be seen, even for this large diffusivity case
 $S=1$
, the differences between both sets of computations are not significant, and are mainly observed in the solute distribution in the low velocity region near the closed end, where the effect of Taylor dispersion tends to spread the solute concentration. Additional results of integrations of (3.33) for
 $S=50$
, not shown in figure 6, gave solute distributions that are virtually indistinguishable from those shown in figure 6(c). These findings, consistent with the quantitative results in figure 5, indicate that Taylor dispersion, which is known to play a central role in axial dispersion in axisymmetric or planar configurations, contributes negligibly to the transport of drugs delivered intrathecally in the spinal canal.
As previously discussed, for
 $S\ll \unicode[STIX]{x1D700}^{-2}$
the solute concentration is uniform across the width of the canal in the first approximation, while in the opposite case
 $S\gg \unicode[STIX]{x1D700}^{-2}$
molecular diffusion is entirely negligible, so that each fluid particle conserves its initial concentration. An intermediate behaviour is found in the distinguished limit
 $S\sim \unicode[STIX]{x1D700}^{-2}$
, the case considered in figure 6(a,b), where transverse molecular diffusion is significant, although it is not able to uniformize completely the solute concentration. As a result, the solute located initially near the bounding surfaces
 $\unicode[STIX]{x1D702}=0$
and
 $\unicode[STIX]{x1D702}=1$
, where the velocity is small, tends to remain at the initial location, an effect that is clearly visible in the computations for
 $\unicode[STIX]{x1D70E}=\unicode[STIX]{x1D700}^{2}S=10$
in figure 6(a). Away from the walls the solute is convected by the flow, so that the resulting transport pattern in figure 6(a,b) is similar to figure 6(c).
To provide a more direct quantitative assessment of the effects of the Schmidt number on solute dispersion, the value of the solute flux
 $\unicode[STIX]{x1D719}_{c}$
was computed at three different sections
 $x=(0,0.25,0.5)$
for the solute evolutions of figure 6 and also for additional computations with
 $S=50$
based on (3.33). The value of
 $\unicode[STIX]{x1D719}_{c}(x,\unicode[STIX]{x1D70F})$
is evaluated from (3.11) in the integrations for
 $\unicode[STIX]{x1D70E}=\unicode[STIX]{x1D700}^{2}S=10$
and
 $\unicode[STIX]{x1D70E}=\unicode[STIX]{x1D700}^{2}S=1$
and from (3.36) in the integrations for
 $S=1$
and
 $S=50$
, with the simpler expression
 $$\begin{eqnarray}\unicode[STIX]{x1D719}_{c}=\ell \int _{0}^{1}\left(\int _{0}^{1}u_{L}\,\text{d}\unicode[STIX]{x1D702}\right)c_{0}\bar{h}\,\text{d}s\end{eqnarray}$$
applying in the intermediate limit
 $1\ll S\ll \unicode[STIX]{x1D700}^{-2}$
. The results are represented in figure 7.
Since the solute migrates towards the canal entrance, the corresponding values of
 $\unicode[STIX]{x1D719}_{c}$
are negative. The curves at different sections display the expected delay associated with the distance from the injection location (
 $x=0.75$
). The differences in the temporal variation of the solute flux between the extreme values of the Schmidt number
 $\unicode[STIX]{x1D700}^{2}S=10$
and
 $S=1$
can be attributed to their distinct convective transport. For the least diffusive case (
 $\unicode[STIX]{x1D700}^{2}S=10$
) the concentration of each fluid particle remains almost constant, so that particles located initially near the centre of the canal
 $\unicode[STIX]{x1D702}=0.5$
, where the velocity is higher, tend to move faster, whereas those near the bounding surfaces
 $\unicode[STIX]{x1D702}=(0,1)$
move more slowly. By way of contrast, for
 $S=1$
the concentration, uniform in
 $\unicode[STIX]{x1D702}$
, is convected with the width-averaged velocity, smaller than the peak velocity found near the centre. As a result, for
 $\unicode[STIX]{x1D700}^{2}S=10$
the flux
 $\unicode[STIX]{x1D719}_{c}$
increases earlier than that for
 $S=1$
, because of the rapid motion of the fluid particles near the centre of the canal, but reaches a peak value that is significantly lower, because near-wall fluid particles take a long time to move from the initial location. The differences between the other three curves (
 $S=50$
,
 $1\ll S\ll \unicode[STIX]{x1D700}^{2}$
and
 $\unicode[STIX]{x1D70E}=\unicode[STIX]{x1D700}^{2}S=1$
) are much smaller, with associated predictions of solute flux differing typically by approximately 10 %. This quantitative agreement suggests that the simplified transport model (3.13), involving only convection driven by the width-averaged Lagrangian velocities, can provide a sufficiently accurate description for many purposes. Additional computations involving canals with more complicated geometries would be needed to ascertain the level of accuracy to be expected in predictive studies for ITDD applications.
5 Concluding remarks
This paper addresses the transport of a solute carried by the CSF in the SAS of the spinal canal. The objective is to improve understanding of the transport processes governing the dispersion of drugs administered by ITDD. The analysis takes advantage of the existence of two different time scales, namely, the period of the CSF oscillatory motion
 ${\sim}\unicode[STIX]{x1D714}^{-1}$
(a short time scale of the order of 1 second) and the residence time associated with the bulk flow
 ${\sim}\unicode[STIX]{x1D700}^{-2}\unicode[STIX]{x1D714}^{-1}$
(a long time scale of the order of 30 min), with the small parameter
 $\unicode[STIX]{x1D700}\sim 1/50\ll 1$
measuring the ratio of the tidal volume to the total volume of CSF in the spinal canal. The two-time scale analysis reveals that the mechanisms controlling the dispersion of the solute in the long time scale
 $\unicode[STIX]{x1D700}^{-2}\unicode[STIX]{x1D714}^{-1}$
are a consequence of the nonlinear convective–diffusive interactions occurring in the short time scale
 $\unicode[STIX]{x1D714}^{-1}$
, with different mechanisms arising depending on the magnitude of the Schmidt number
 $S$
.
To gain insight into the short-time convective–diffusive interactions, the analysis considers in particular the distinguished limit
 $S\sim 1$
, which applies strictly to solute diffusion in gases, not relevant for the present application. In this limit, the diffusion time across the width of the canal is comparable to the period of the pulsating flow, with the consequence that the interactions of the small short-time fluctuations of the concentration with the oscillating velocity lead to Taylor dispersion, represented by apparent diffusion terms in the resulting long-time transport equation (3.33). As can be seen in figure 5, the magnitude of the effective diffusivities decreases rapidly with increasing values of
 $S$
, becoming vanishingly small for the characteristic values
 $S\sim 1000$
of ITDD drugs, for which Taylor dispersion is entirely negligible.
In the distinguished limit
 $S\sim \unicode[STIX]{x1D700}^{-2}$
, which represents the case of clinical interest, the dispersion of the solute is determined by the reduced transport equation (3.9) (or (3.12)). This involves the competition of molecular diffusion across the width of the canal and convective transport driven by the time-averaged Lagrangian velocity (2.26)–(2.28), obtained as the sum of the Eulerian steady-streaming velocity and the Stokes-drift component associated with the non-uniform oscillating flow. The reduced transport description can be further simplified by considering solutes with smaller Schmidt numbers
 $S\ll \unicode[STIX]{x1D700}^{-2}$
, for which the solute concentration is uniform across the width of the canal in the first approximation. The results presented in figures 6 and 7 for a model geometry suggest that this simplified description, given in (3.13), may provide sufficient accuracy for many purposes.
The application of our formulation for patient-specific computations in a clinical setting requires knowledge of the functions
 $\ell (x)$
,
 $\bar{h}(x,s)$
and
 $\unicode[STIX]{x1D6FE}(x,s)$
that describe the geometry and elastic properties of the spinal canal. Current high-resolution anatomic MRI techniques permit the 3-D reconstruction of the spinal canal geometry. The procedure involves the acquisition of a series of axial or sagittal images, which are posteriorly segmented in a semi-automatic fashion to delimitate the boundaries of the spinal cord and dura membrane (Tangen et al.
Reference Tangen, Leval, Mehta and Linninger2017; Sass et al.
Reference Sass, Khani, Natividad, Tubbs, Baledent and Martin2017). From these, the spinal-cord perimeter can be characterized as a function of the axial position, yielding – upon normalization by a conveniently chosen characteristic value
 $\ell _{c}$
– the dimensionless function
 $\ell (x)$
. Similarly, the canal width function
 $\bar{h}(x,s)$
can be constructed by computing the spacing between the cord and the dura membrane as a function of the azimuthal and axial position followed by normalization by an appropriately selected
 $h_{c}$
. The spatial distribution of the canal compliance, characterized here through the function
 $\unicode[STIX]{x1D6FE}(x,s)$
, has been hypothesized (Marmarou et al.
Reference Marmarou, Shulman and Lamorgese1975; Shapiro et al.
Reference Shapiro, Marmarou and Shulman1980) to be influenced by the presence of fatty tissue and blood vessels in the epidural space, but precise measurements are not available. Nevertheless, the axial variation of the average compliance
 $\int _{0}^{1}\unicode[STIX]{x1D6FE}(x,s)\,\text{d}s$
, which enters in the determination of the pressure distribution through (A 18), can be indirectly inferred from patient-specific in vivo measurements of the variation of the stroke volume
 $\unicode[STIX]{x0394}V$
along the canal. These in vivo measurements of the stroke volume are facilitated by the recent advent of cardiac-gated phase contrast Cine MRI (see e.g. Sass et al.
Reference Sass, Khani, Natividad, Tubbs, Baledent and Martin2017; Tangen et al.
Reference Tangen, Leval, Mehta and Linninger2017).
Although our analysis retains the essential transport mechanisms, there are various effects that should be incorporated in future extensions of the model. For example, the presence of the microanatomical features of the spinal canal (i.e. ligaments, nerve roots and trabeculae), not included in the slowly varying geometry assumed in the analysis, could have a localized influence on the steady-streaming flow and on the dispersion of the drug. In that regard, recent numerical analyses indicate that interactions of the oscillating flow with nerve roots may lead to increased steady streaming, with the effect being more prominent in the cervical region (Khani et al.
Reference Khani, Sass, Xing, Sharp, Balédent and Martin2018). Lattice Boltzmann simulations of solute transport in an idealized concentric model of the spinal canal (Stockman Reference Stockman2007) found that inclusion of the fine structure of the subarachnoid space (nerves and trabeculae) enhances both the longitudinal and transverse drug dispersion, with the enhancement factor reaching values of the order of 10 for solutes with
 $S=100$
. Attention should also be given to buoyancy effects resulting from density differences between the drug and the CSF, with the extent of the associated induced flow depending on the position of the patient during infusion.
From the clinical point of view, it is worth mentioning that the model results presented above, involving the evolution of the solute from a prescribed initial distribution
 $c_{i}(x,\unicode[STIX]{x1D702},s)$
, are representative of drug transport following a rapid injection of a bolus. The initial condition clearly depends on the details of the injection procedure, typically occurring in a time scale much shorter that
 $\unicode[STIX]{x1D700}^{-2}\unicode[STIX]{x1D714}^{-1}$
but much longer than
 $\unicode[STIX]{x1D714}^{-1}$
, posing a flow problem that should be investigated in future work. A different scenario emerges in connection with chronic ITDD procedures, in which the drug is administered continuously at a small rate using a small pump that is surgically placed under the skin of the abdomen, delivering the medication into the intrathecal space through a tunnelled catheter. Since the resulting injection velocity is typically too small to affect the CSF flow in the canal, the corresponding transport problem could be described on the basis of our long-time transport equations supplemented with an appropriately modified boundary condition for
 $c_{0}$
accounting for the localized release of the drug. As revealed in in vivo experiments (Flack & Bernards Reference Flack and Bernards2010), the drug dispersion rate associated with intrathecal bolus injection and slow intrathecal infusion can be substantially different, an aspect of the problem that warrants future investigation.
It should also be pointed out that our analysis has been devoted to the convective–diffusive transport processes governing the dispersion of the drug but did not consider pharmokinetic effects, i.e. drug decay due to enzymatic effects, tissue uptake and clearance by the blood, which are essential in ITDD applications. Extensions of the analysis to account for these effects should be addressed in future work. Drug uptake by the spinal nerve as well as through the dura membrane can be incorporated by modelling the drug absorption rate at the tissue surfaces as a function of the local solute concentration and the characteristics of the tissue. If the characteristic absorption time is of the order of the residence time
 $\unicode[STIX]{x1D700}^{-2}\unicode[STIX]{x1D714}^{-1}$
, a non-negligible fraction of the solute deposited in the lumbar region can be expected to be absorbed along the canal before reaching the cranial cavity. This can be accounted for in our formulation by incorporating modified boundary conditions on the inner and outer boundary surfaces. For instance, if the absorption rate is assumed to be linearly proportional to the local concentration, then the boundary conditions
 $\unicode[STIX]{x2202}c_{0}/\unicode[STIX]{x2202}\unicode[STIX]{x1D702}=0$
at
 $\unicode[STIX]{x1D702}=0,1$
for (3.9), corresponding to the relevant limit
 $S\sim \unicode[STIX]{x1D700}^{-2}$
, must be replaced with
 $$\begin{eqnarray}\frac{1}{\unicode[STIX]{x1D6FC}^{2}\unicode[STIX]{x1D70E}\bar{h}}\frac{\unicode[STIX]{x2202}c_{0}}{\unicode[STIX]{x2202}\unicode[STIX]{x1D702}}=B_{p}c_{0}\quad \text{at }\unicode[STIX]{x1D702}=0\quad \text{and}\quad \frac{1}{\unicode[STIX]{x1D6FC}^{2}\unicode[STIX]{x1D70E}\bar{h}}\frac{\unicode[STIX]{x2202}c_{0}}{\unicode[STIX]{x2202}\unicode[STIX]{x1D702}}=-B_{d}c_{0}\quad \text{at }\unicode[STIX]{x1D702}=1,\end{eqnarray}$$
where the order-unity functions
 $B_{p}(x,s)$
and
 $B_{d}(x,s)$
measure the absorption rate on the pia mater and dura membrane, respectively. Correspondingly, (3.13), describing solute transport in the limit
 $1\ll S\ll \unicode[STIX]{x1D700}^{-2}$
, must be replaced with
 $$\begin{eqnarray}\frac{\unicode[STIX]{x2202}c_{0}}{\unicode[STIX]{x2202}\unicode[STIX]{x1D70F}}+\left(\int _{0}^{1}u_{L}\,\text{d}\unicode[STIX]{x1D702}\right)\frac{\unicode[STIX]{x2202}c_{0}}{\unicode[STIX]{x2202}x}+\left(\int _{0}^{1}w_{L}\,\text{d}\unicode[STIX]{x1D702}\right)\frac{1}{\ell }\frac{\unicode[STIX]{x2202}c_{0}}{\unicode[STIX]{x2202}s}=-\unicode[STIX]{x0394}c_{0},\end{eqnarray}$$
obtained by integrating (3.9) across the canal width with account taken of the modified boundary conditions (5.1). According to (5.2), the solute evolution is determined by a convection–reaction balance involving the width-averaged Lagrangian velocity components
 $\int _{0}^{1}u_{L}\,\text{d}\unicode[STIX]{x1D702}$
and
 $\int _{0}^{1}w_{L}\,\text{d}\unicode[STIX]{x1D702}$
along with an effective Damköhler number
 $\unicode[STIX]{x0394}(x,s)=(B_{p}+B_{d})/\bar{h}$
measuring the absorption rate. The results of the model geometry computations discussed above suggest that the simplified description (5.2), which applies strictly in the intermediate limit
 $1\ll S\ll \unicode[STIX]{x1D700}^{-2}$
, might be sufficiently accurate in the clinically relevant limit
 $S\sim \unicode[STIX]{x1D700}^{-2}$
. Future quantitative studies should assess its predictive capability in connection with clinically relevant ITDD processes.
In summary, our asymptotic analysis of solute transport has clarified the role of steady streaming, Stokes drift and Taylor dispersion in the transport of a drug injected intrathecally in the spinal canal. An important outcome of the asymptotic analysis is a reduced transport equation describing the dispersion of the solute. By focusing on the evolution in the long time scale
 $\unicode[STIX]{x1D700}^{-2}\unicode[STIX]{x1D714}^{-1}\sim 30$
min, relevant for solute dispersion along the canal, the formulation reduces drastically the required computational time, circumventing the need to describe the small concentration fluctuations occurring in the short time scale
 $\unicode[STIX]{x1D714}^{-1}\sim 1~\text{s}$
. The results can be employed in future quantitative studies to investigate differences in drug dispersion due to anatomical and physiological differences between patients, enabling the patient-specific optimization of drug delivery to a target site from injection by a lumbar puncture.
Acknowledgements
C.M.-B. acknowledges the financial support provided by the Spanish MINECO (Secretaría de Estado de Investigación, Desarrollo e Innovación) through grants DPI2014-59292-C3-3 and DPI2017-88201-C3-2-R, co-financed by the European Regional Development Fund (ERDF).
Appendix A. CSF motion in the spinal canal
This appendix summarizes the results of the analysis presented in Sánchez et al. (Reference Sánchez, Martínez-Bazán, Gutiérrez-Montes, Criado-Hidalgo, Pawlak, Bradley, Haughton and Lasheras2018) for the motion of CSF in the spinal canal. The flow is driven by the periodic pressure fluctuation in the cranial cavity
 $(\unicode[STIX]{x0394}p)_{c}\unicode[STIX]{x1D6F1}(t)$
, where
 $(\unicode[STIX]{x0394}p)_{c}$
is the amplitude and
 $\unicode[STIX]{x1D6F1}(t)$
is a dimensionless periodic function. The resulting volume flux is accommodated by the deformation of the dura membrane. For simplicity, the displacement of the dura membrane is assumed to be linearly proportional to the local pressure fluctuation, with a compliance factor
 $\unicode[STIX]{x1D6FE}^{\prime }$
whose characteristic value
 $\unicode[STIX]{x1D6FE}_{c}^{\prime }\ll h_{c}/(\unicode[STIX]{x0394}p)_{c}$
defines in (1.1) the small parameter
 $\unicode[STIX]{x1D700}$
measuring the limited compliance of the spinal SAS as well as the small oscillatory displacements of the CSF in the canal. In dimensionless form, the constitutive equation becomes
 $$\begin{eqnarray}h-\bar{h}=\unicode[STIX]{x1D700}\unicode[STIX]{x1D6FE}p\quad \Rightarrow \quad h^{\prime }=\unicode[STIX]{x1D6FE}(\unicode[STIX]{x1D6F1}+k^{2}p^{\prime })\end{eqnarray}$$
involving the canal deformation
 $h-\bar{h}=\unicode[STIX]{x1D700}h^{\prime }$
from its unperturbed distribution
 $\bar{h}(x,s)$
and the streamwise pressure distribution
 $p-\unicode[STIX]{x1D6F1}(t)=k^{2}p^{\prime }(x,t)$
, where
 $p^{\prime }(x,t)$
is the pressure variation from its entrance value scaled with
 $\unicode[STIX]{x1D70C}\unicode[STIX]{x1D700}\unicode[STIX]{x1D714}^{2}L^{2}$
and
 $$\begin{eqnarray}k=\frac{L\unicode[STIX]{x1D714}}{[(h_{c}/\unicode[STIX]{x1D6FE}_{c}^{\prime })/\unicode[STIX]{x1D70C}]^{1/2}}\end{eqnarray}$$
is a dimensionless wavenumber, with
 $[(h_{c}/\unicode[STIX]{x1D6FE}_{c}^{\prime })/\unicode[STIX]{x1D70C}]^{1/2}$
representing the relevant elastic wave speed. In our previous analysis (Sánchez et al.
Reference Sánchez, Martínez-Bazán, Gutiérrez-Montes, Criado-Hidalgo, Pawlak, Bradley, Haughton and Lasheras2018) the compliance factor was defined as the ratio of the section-averaged canal width to an effective elastic modulus, both being functions of
 $x$
only, so that the resulting canal deformations
 $h^{\prime }$
were only a function of
 $x$
and
 $t$
. Here the description is generalized by allowing for a more general variation
 $\unicode[STIX]{x1D6FE}^{\prime }/\unicode[STIX]{x1D6FE}_{c}^{\prime }=\unicode[STIX]{x1D6FE}(x,s)\sim 1$
, so that
 $h^{\prime }(x,s,t)$
. Besides the velocity field, given by the three velocity components
 $u$
,
 $v$
, and
 $w$
, and the deformation
 $h^{\prime }$
, the solution determines the pressure distribution. This is given in the first approximation by its streamwise distribution
 $p^{\prime }(x,t)$
appearing in (A 1), with a supplementary function
 $\hat{p}(x,s,t)$
introduced in the azimuthal component of the momentum equation (A 5) to describe the small relative pressure variations occurring within each section, of order
 $(\ell _{c}/L)\ll 1$
.
In the slender-flow limit (2.1), the continuity equation takes the form
 $$\begin{eqnarray}\frac{1}{\ell }\frac{\unicode[STIX]{x2202}}{\unicode[STIX]{x2202}x}(\ell u)+\frac{\unicode[STIX]{x2202}v}{\unicode[STIX]{x2202}y}+\frac{1}{\ell }\frac{\unicode[STIX]{x2202}w}{\unicode[STIX]{x2202}s}=0,\end{eqnarray}$$
whereas the axial and azimuthal components of the momentum equation are
 $$\begin{eqnarray}\displaystyle & \displaystyle \frac{\unicode[STIX]{x2202}u}{\unicode[STIX]{x2202}t}+\unicode[STIX]{x1D700}\left[\frac{1}{\ell }\frac{\unicode[STIX]{x2202}}{\unicode[STIX]{x2202}x}(\ell u^{2})+\frac{\unicode[STIX]{x2202}}{\unicode[STIX]{x2202}y}(uv)+\frac{1}{\ell }\frac{\unicode[STIX]{x2202}}{\unicode[STIX]{x2202}s}(uw)\right]=-\frac{\unicode[STIX]{x2202}p^{\prime }}{\unicode[STIX]{x2202}x}+\frac{1}{\unicode[STIX]{x1D6FC}^{2}}\frac{\unicode[STIX]{x2202}^{2}u}{\unicode[STIX]{x2202}y^{2}}, & \displaystyle\end{eqnarray}$$
 $$\begin{eqnarray}\displaystyle & \displaystyle \frac{\unicode[STIX]{x2202}w}{\unicode[STIX]{x2202}t}+\unicode[STIX]{x1D700}\left[\frac{\unicode[STIX]{x2202}}{\unicode[STIX]{x2202}x}(uw)+2\frac{uw}{\ell }\frac{\unicode[STIX]{x2202}\ell }{\unicode[STIX]{x2202}x}+\frac{\unicode[STIX]{x2202}}{\unicode[STIX]{x2202}y}(vw)+\frac{1}{\ell }\frac{\unicode[STIX]{x2202}}{\unicode[STIX]{x2202}s}(w^{2})\right]=-\frac{1}{\ell }\frac{\unicode[STIX]{x2202}\hat{p}}{\unicode[STIX]{x2202}s}+\frac{1}{\unicode[STIX]{x1D6FC}^{2}}\frac{\unicode[STIX]{x2202}^{2}w}{\unicode[STIX]{x2202}y^{2}}, & \displaystyle\end{eqnarray}$$
where
 $$\begin{eqnarray}\unicode[STIX]{x1D6FC}=\frac{h_{c}}{(\unicode[STIX]{x1D708}/\unicode[STIX]{x1D714})^{1/2}}\end{eqnarray}$$
is the Womersley number, which takes values of order unity.
The pressure drop is negligible at the entrance of the canal, corresponding to the condition
 $p^{\prime }=0$
at
 $x=0$
. The velocity satisfies
 $u=v=w=0$
at
 $y=0$
and
 $u=v-\unicode[STIX]{x2202}h^{\prime }/\unicode[STIX]{x2202}t=w=0$
at
 $y=h$
. Since the canal is symmetric the azimuthal velocity component
 $w$
vanishes at
 $s=0$
and
 $s=1$
. The requirement that the axial volume flux
 $\int _{0}^{1}(\int _{0}^{h}u\,\text{d}y)\,\text{d}s$
must vanish at the closed end
 $x=1$
completes the set of boundary conditions needed to determine the flow in the canal.
In the computation, it is convenient to introduce the normalized transverse coordinate
 $\unicode[STIX]{x1D702}=y/h$
, along with the regular expansions (2.3) and (2.4) for the velocity and deformation and similar expansion in powers of
 $\unicode[STIX]{x1D700}$
for the pressure functions
 $p^{\prime }$
and
 $\hat{p}$
. The solution for the first two terms in the expansions is given below for an intracranial pressure of the form
 $\unicode[STIX]{x1D6F1}(t)=\cos t$
. Additional terms in a Fourier expansion for
 $\unicode[STIX]{x1D6F1}(t)$
could be computed in a similar manner, thereby enabling the extension of the analysis to general non-harmonic periodic functions
 $\unicode[STIX]{x1D6F1}(t)$
.
A.1 Leading-order solution
In the limit
 $\unicode[STIX]{x1D700}\ll 1$
with
 $\unicode[STIX]{x1D6FC}\sim 1$
and
 $k\sim 1$
, the problem defined by (A 1) and (A 3)–(A 5) with the boundary conditions given below (A 5) can be solved in terms of regular expansions of the form
 $$\begin{eqnarray}\left.\begin{array}{@{}c@{}}u=u_{0}+\unicode[STIX]{x1D700}u_{1}+\cdots \,,\quad v=v_{0}+\unicode[STIX]{x1D700}v_{1}+\cdots \,,\quad w=w_{0}+\unicode[STIX]{x1D700}w_{1}+\cdots \,,\\ h^{\prime }=h_{0}^{\prime }+\unicode[STIX]{x1D700}h_{1}^{\prime }+\cdots \,,\quad p^{\prime }=p_{0}^{\prime }+\unicode[STIX]{x1D700}p_{1}^{\prime }+\cdots \,,\quad \hat{p}=\hat{p}_{0}+\unicode[STIX]{x1D700}\hat{p}_{1}+\cdots \,.\end{array}\right\}\end{eqnarray}$$
The linear problem encountered at leading order can be readily integrated to give
 $$\begin{eqnarray}\left.\begin{array}{@{}c@{}}u_{0}=\text{Re}(\text{i}\text{e}^{\text{i}t}U),\quad v_{0}=\text{Re}(\text{i}\text{e}^{\text{i}t}V),\quad w_{0}=\text{Re}(\text{i}\text{e}^{\text{i}t}W),\\ p_{0}^{\prime }=\text{Re}(\text{e}^{\text{i}t}P^{\prime }),\quad \hat{p}_{0}=\text{Re}(\text{e}^{\text{i}t}\hat{P}),\quad h_{0}^{\prime }=\text{Re}(\text{e}^{\text{i}t}H^{\prime }),\end{array}\right\}\end{eqnarray}$$
involving the complex functions
 $U(x,\unicode[STIX]{x1D702},s)$
,
 $V(x,\unicode[STIX]{x1D702},s)$
,
 $W(x,\unicode[STIX]{x1D702},s)$
,
 $P^{\prime }(x)$
,
 $\hat{P}(x,s)$
and
 $H^{\prime }(x,s)$
, to be defined below.
The axial and azimuthal velocity are given in terms of the components of the pressure gradient by
 $$\begin{eqnarray}U=\frac{\text{d}P^{\prime }}{\text{d}x}G\quad \text{and}\quad W=\frac{1}{\ell }\frac{\unicode[STIX]{x2202}\hat{P}}{\unicode[STIX]{x2202}s}G\end{eqnarray}$$
with
 $$\begin{eqnarray}G(x,\unicode[STIX]{x1D702},s)=1-\frac{\cosh \left[{\displaystyle \frac{\unicode[STIX]{x1D6FC}\bar{h}}{2}}{\displaystyle \frac{1+\text{i}}{\sqrt{2}}}(2\unicode[STIX]{x1D702}-1)\right]}{\cosh \left[{\displaystyle \frac{\unicode[STIX]{x1D6FC}\bar{h}}{2}}{\displaystyle \frac{1+\text{i}}{\sqrt{2}}}\right]}\end{eqnarray}$$
as follows at this order by integration of (A 4) and (A 5) with boundary conditions
 $u_{0}=w_{0}=0$
at
 $\unicode[STIX]{x1D702}=(0,1)$
. The transverse velocity can be evaluated by integrating (A 3) with the condition
 $v_{0}=0$
at
 $\unicode[STIX]{x1D702}=0$
to give
 $$\begin{eqnarray}V=-\frac{1}{\ell }\frac{\unicode[STIX]{x2202}}{\unicode[STIX]{x2202}x}\left(\ell \frac{\text{d}P^{\prime }}{\text{d}x}\bar{h}\int _{0}^{\unicode[STIX]{x1D702}}G\,\text{d}\unicode[STIX]{x1D702}\right)-\frac{1}{\ell }\frac{\unicode[STIX]{x2202}}{\unicode[STIX]{x2202}s}\left(\frac{1}{\ell }\frac{\unicode[STIX]{x2202}\hat{P}}{\unicode[STIX]{x2202}s}\bar{h}\int _{0}^{\unicode[STIX]{x1D702}}G\,\text{d}\unicode[STIX]{x1D702}\right)+\frac{\unicode[STIX]{x2202}\bar{h}}{\unicode[STIX]{x2202}x}\frac{\text{d}P^{\prime }}{\text{d}x}\unicode[STIX]{x1D702}G+\frac{1}{\ell }\frac{\unicode[STIX]{x2202}\bar{h}}{\unicode[STIX]{x2202}s}\frac{1}{\ell }\frac{\unicode[STIX]{x2202}\hat{P}}{\unicode[STIX]{x2202}s}\unicode[STIX]{x1D702}G,\end{eqnarray}$$
where
 $$\begin{eqnarray}\bar{h}\int _{0}^{\unicode[STIX]{x1D702}}G\,\text{d}\unicode[STIX]{x1D702}=\bar{h}\unicode[STIX]{x1D702}-\frac{1-\text{i}}{\sqrt{2}\unicode[STIX]{x1D6FC}}\frac{\sinh \left[{\displaystyle \frac{\unicode[STIX]{x1D6FC}\bar{h}}{2}}{\displaystyle \frac{1+\text{i}}{\sqrt{2}}}(2\unicode[STIX]{x1D702}-1)\right]+\sinh \left[{\displaystyle \frac{\unicode[STIX]{x1D6FC}\bar{h}}{2}}{\displaystyle \frac{1+\text{i}}{\sqrt{2}}}\right]}{\cosh \left[{\displaystyle \frac{\unicode[STIX]{x1D6FC}\bar{h}}{2}}{\displaystyle \frac{1+\text{i}}{\sqrt{2}}}\right]}.\end{eqnarray}$$
Evaluating (A 11) at
 $\unicode[STIX]{x1D702}=1$
, where
 $V=H^{\prime }$
as corresponds to
 $v_{0}=\unicode[STIX]{x2202}h_{0}^{\prime }/\unicode[STIX]{x2202}t$
, gives
 $$\begin{eqnarray}H^{\prime }+\frac{1}{\ell }\frac{\unicode[STIX]{x2202}}{\unicode[STIX]{x2202}x}\left(\ell \frac{\text{d}P^{\prime }}{\text{d}x}q(x,s)\right)+\frac{1}{\ell }\frac{\unicode[STIX]{x2202}}{\unicode[STIX]{x2202}s}\left[\frac{1}{\ell }\frac{\unicode[STIX]{x2202}\hat{P}}{\unicode[STIX]{x2202}s}q(x,s)\right]=0,\end{eqnarray}$$
with
 $$\begin{eqnarray}q(x,s)=\bar{h}\int _{0}^{1}G\,\text{d}\unicode[STIX]{x1D702}=\bar{h}-\frac{\sqrt{2}(1-\text{i})}{\unicode[STIX]{x1D6FC}}\tanh \left(\frac{\unicode[STIX]{x1D6FC}\bar{h}}{2}\frac{1+\text{i}}{\sqrt{2}}\right)\end{eqnarray}$$
and
 $$\begin{eqnarray}H^{\prime }=\unicode[STIX]{x1D6FE}(1+k^{2}P^{\prime }),\end{eqnarray}$$
the latter stemming from (A 1). Note that (A 13) corresponds to the leading-order form of the continuity equation
 $$\begin{eqnarray}\frac{\unicode[STIX]{x2202}h^{\prime }}{\unicode[STIX]{x2202}t}+\frac{1}{\ell }\frac{\unicode[STIX]{x2202}}{\unicode[STIX]{x2202}x}\left(\ell \int _{0}^{h}u\,\text{d}y\right)+\frac{1}{\ell }\frac{\unicode[STIX]{x2202}}{\unicode[STIX]{x2202}s}\left(\int _{0}^{h}w\,\text{d}y\right)=0,\end{eqnarray}$$
obtained by integrating (A 3) across the canal with boundary conditions
 $v=0$
at
 $y=0$
and
 $v=\unicode[STIX]{x2202}h^{\prime }/\unicode[STIX]{x2202}t$
at
 $y=h$
. Integrating (A 13) around the canal section with
 $\unicode[STIX]{x2202}\hat{P}/\unicode[STIX]{x2202}s=0$
at
 $s=0$
, consistent with the symmetry condition
 $w_{0}=0$
at
 $s=0$
, yields
 $$\begin{eqnarray}\frac{q}{\ell ^{2}}\frac{\unicode[STIX]{x2202}\hat{P}}{\unicode[STIX]{x2202}s}+\frac{1}{\ell }\frac{\unicode[STIX]{x2202}}{\unicode[STIX]{x2202}x}\left[\ell \int _{0}^{s}q\,\text{d}\tilde{s}\frac{\text{d}P^{\prime }}{\text{d}x}\right]+\left(\int _{0}^{s}\unicode[STIX]{x1D6FE}\,\text{d}\tilde{s}\right)(k^{2}P^{\prime }+1)=0.\end{eqnarray}$$
Evaluating the last equation at
 $s=1$
, where
 $\unicode[STIX]{x2202}\hat{P}/\unicode[STIX]{x2202}s=0$
, finally yields the problem
 $$\begin{eqnarray}\frac{1}{\ell }\frac{\text{d}}{\text{d}x}\left[\ell Q\frac{\text{d}P^{\prime }}{\text{d}x}\right]+\left(\int _{0}^{1}\unicode[STIX]{x1D6FE}\,\text{d}s\right)(k^{2}P^{\prime }+1)=0;\quad \left.\begin{array}{@{}c@{}}P^{\prime }=0\quad \text{at }x=0\\ {\displaystyle \frac{\text{d}P^{\prime }}{\text{d}x}}=0\quad \text{at }x=1\end{array}\right\},\end{eqnarray}$$
involving the average section compliance
 $\int _{0}^{1}\unicode[STIX]{x1D6FE}\,\text{d}s$
and the volume-flux function
 $$\begin{eqnarray}Q(x)=\int _{0}^{1}q\,\text{d}s=\int _{0}^{1}\left[\bar{h}-\frac{\sqrt{2}(1-\text{i})}{\unicode[STIX]{x1D6FC}}\tanh \left(\frac{\unicode[STIX]{x1D6FC}\bar{h}}{2}\frac{1+\text{i}}{\sqrt{2}}\right)\right]\text{d}s.\end{eqnarray}$$
For given values of
 $\unicode[STIX]{x1D6FE}(x,s)$
,
 $\bar{h}(x,s)$
and
 $\ell (x)$
the integration of (A 18) determines
 $P^{\prime }(x)$
, which can be used to evaluate
 $U$
and
 $H^{\prime }$
with use made of (A 9) and (A 13), while the associated azimuthal pressure gradient
 $\unicode[STIX]{x2202}\hat{P}/\unicode[STIX]{x2202}s$
, determined from (A 17), is needed to evaluate the functions
 $W$
and
 $V$
from (A 9) and (A 11), thereby completing the description of the harmonic solution (A 8). The solution simplifies when the average section compliance and the shape of the canal section are independent of
 $x$
, so that
 $\int _{0}^{1}\unicode[STIX]{x1D6FE}\,\text{d}s=1$
,
 $\ell =1$
and
 $Q=\text{const.}$
In that case, integration of (A 18) yields
 $$\begin{eqnarray}P^{\prime }=\frac{1}{k^{2}}\left\{\frac{\cos [k(1-x)/\sqrt{Q}]}{\cos (k/\sqrt{Q})}-1\right\}.\end{eqnarray}$$
A.2 Steady streaming
Because of nonlinear interactions, associated with the convective terms and with the temporal and spatial variations of the canal width, the first-order corrections to the flow contain a steady component in addition to the oscillatory component. The computation of this steady-streaming flow begins by collecting terms of order
 $\unicode[STIX]{x1D700}$
in (A 4) and (A 5). Taking the time average
 $\langle \cdot \rangle =(1/2\unicode[STIX]{x03C0})\int _{0}^{2\unicode[STIX]{x03C0}}\cdot \,\text{d}t$
of the resulting equations yields
 $$\begin{eqnarray}\displaystyle & \displaystyle {\mathcal{F}}_{x}=-\frac{\unicode[STIX]{x2202}\langle p_{1}^{\prime }\rangle }{\unicode[STIX]{x2202}x}+\frac{1}{\bar{h}^{2}\unicode[STIX]{x1D6FC}^{2}}\frac{\unicode[STIX]{x2202}^{2}\langle u_{1}\rangle }{\unicode[STIX]{x2202}\unicode[STIX]{x1D702}^{2}} & \displaystyle\end{eqnarray}$$
 $$\begin{eqnarray}\displaystyle & \displaystyle {\mathcal{F}}_{s}=-\frac{1}{\ell }\frac{\unicode[STIX]{x2202}\langle \,\hat{p}_{1}\rangle }{\unicode[STIX]{x2202}s}+\frac{1}{\bar{h}^{2}\unicode[STIX]{x1D6FC}^{2}}\frac{\unicode[STIX]{x2202}^{2}\langle w_{1}\rangle }{\unicode[STIX]{x2202}\unicode[STIX]{x1D702}^{2}}, & \displaystyle\end{eqnarray}$$
where
 $$\begin{eqnarray}\displaystyle {\mathcal{F}}_{x} & = & \displaystyle \frac{1}{\ell }\frac{\unicode[STIX]{x2202}}{\unicode[STIX]{x2202}x}(\ell \langle u_{0}^{2}\rangle )+\frac{1}{\bar{h}}\frac{\unicode[STIX]{x2202}}{\unicode[STIX]{x2202}\unicode[STIX]{x1D702}}\langle u_{0}v_{0}\rangle +\frac{1}{\ell }\frac{\unicode[STIX]{x2202}}{\unicode[STIX]{x2202}s}\langle u_{0}w_{0}\rangle \nonumber\\ \displaystyle & & \displaystyle -\,\frac{\unicode[STIX]{x1D702}}{\bar{h}}\frac{\unicode[STIX]{x2202}}{\unicode[STIX]{x2202}\unicode[STIX]{x1D702}}\left\langle \frac{\unicode[STIX]{x2202}h_{0}^{\prime }}{\unicode[STIX]{x2202}t}u_{0}\right\rangle -\frac{\unicode[STIX]{x2202}\bar{h}}{\unicode[STIX]{x2202}x}\frac{\unicode[STIX]{x1D702}}{\bar{h}}\frac{\unicode[STIX]{x2202}}{\unicode[STIX]{x2202}\unicode[STIX]{x1D702}}\langle u_{0}^{2}\rangle -\frac{1}{\ell }\frac{\unicode[STIX]{x2202}\bar{h}}{\unicode[STIX]{x2202}s}\frac{\unicode[STIX]{x1D702}}{\bar{h}}\frac{\unicode[STIX]{x2202}}{\unicode[STIX]{x2202}\unicode[STIX]{x1D702}}\langle u_{0}w_{0}\rangle +\frac{2}{\bar{h}^{3}\unicode[STIX]{x1D6FC}^{2}}\frac{\unicode[STIX]{x2202}^{2}}{\unicode[STIX]{x2202}\unicode[STIX]{x1D702}^{2}}\langle h_{0}^{\prime }u_{0}\rangle \qquad\end{eqnarray}$$
and
 $$\begin{eqnarray}\displaystyle {\mathcal{F}}_{s} & = & \displaystyle \frac{\unicode[STIX]{x2202}}{\unicode[STIX]{x2202}x}\langle u_{0}w_{0}\rangle +2\frac{\langle u_{0}w_{0}\rangle }{\ell }\frac{\unicode[STIX]{x2202}\ell }{\unicode[STIX]{x2202}x}+\frac{1}{\bar{h}}\frac{\unicode[STIX]{x2202}}{\unicode[STIX]{x2202}\unicode[STIX]{x1D702}}\langle v_{0}w_{0}\rangle +\frac{1}{\ell }\frac{\unicode[STIX]{x2202}}{\unicode[STIX]{x2202}s}\langle w_{0}^{2}\rangle -\frac{\unicode[STIX]{x1D702}}{\bar{h}}\frac{\unicode[STIX]{x2202}}{\unicode[STIX]{x2202}\unicode[STIX]{x1D702}}\left\langle \frac{\unicode[STIX]{x2202}h_{0}^{\prime }}{\unicode[STIX]{x2202}t}w_{0}\right\rangle \nonumber\\ \displaystyle & & \displaystyle -\,\frac{\unicode[STIX]{x2202}\bar{h}}{\unicode[STIX]{x2202}x}\frac{\unicode[STIX]{x1D702}}{\bar{h}}\frac{\unicode[STIX]{x2202}}{\unicode[STIX]{x2202}\unicode[STIX]{x1D702}}\langle u_{0}w_{0}\rangle -\frac{1}{\ell }\frac{\unicode[STIX]{x2202}\bar{h}}{\unicode[STIX]{x2202}s}\frac{\unicode[STIX]{x1D702}}{\bar{h}}\frac{\unicode[STIX]{x2202}}{\unicode[STIX]{x2202}\unicode[STIX]{x1D702}}\langle w_{0}^{2}\rangle +\frac{2}{\bar{h}^{3}\unicode[STIX]{x1D6FC}^{2}}\frac{\unicode[STIX]{x2202}^{2}}{\unicode[STIX]{x2202}\unicode[STIX]{x1D702}^{2}}\langle h_{0}^{\prime }w_{0}\rangle\end{eqnarray}$$
can be evaluated in terms of the leading-order solution. The computation of the time averages is facilitated by use of the identities
 $\langle \text{Re}(\text{i}\text{e}^{\text{i}t}A)\,\text{Re}(\text{i}\text{e}^{\text{i}t}B)\rangle =\text{Re}(AB^{\ast })/2$
and
 $\langle \text{Re}(\text{e}^{\text{i}t}A)\,\text{Re}(\text{i}\text{e}^{\text{i}t}B)\rangle =\text{Im}(AB^{\ast })/2$
, which apply to any generic time-independent complex functions
 $A$
and
 $B$
, with the asterisk
 $\ast$
denoting complex conjugates.
Integrating (A 21) and (A 22) subject to
 $\langle u_{1}\rangle =\langle w_{1}\rangle =0$
at
 $\unicode[STIX]{x1D702}=0,1$
yields
 $$\begin{eqnarray}\frac{\langle u_{1}\rangle }{\bar{h}^{2}\unicode[STIX]{x1D6FC}^{2}}=-\frac{\text{d}\langle p_{1}^{\prime }\rangle }{\text{d}x}\frac{(1-\unicode[STIX]{x1D702})\unicode[STIX]{x1D702}}{2}+\unicode[STIX]{x1D702}\int _{0}^{\unicode[STIX]{x1D702}}{\mathcal{F}}_{x}\,\text{d}\bar{\unicode[STIX]{x1D702}}-\int _{0}^{\unicode[STIX]{x1D702}}{\mathcal{F}}_{x}\bar{\unicode[STIX]{x1D702}}\,\text{d}\bar{\unicode[STIX]{x1D702}}-\unicode[STIX]{x1D702}\int _{0}^{1}{\mathcal{F}}_{x}(1-\unicode[STIX]{x1D702})\,\text{d}\unicode[STIX]{x1D702}\end{eqnarray}$$
and
 $$\begin{eqnarray}\frac{\langle w_{1}\rangle }{\bar{h}^{2}\unicode[STIX]{x1D6FC}^{2}}=-\frac{1}{\ell }\frac{\unicode[STIX]{x2202}\langle \,\hat{p}_{1}\rangle }{\unicode[STIX]{x2202}s}\frac{(1-\unicode[STIX]{x1D702})\unicode[STIX]{x1D702}}{2}+\unicode[STIX]{x1D702}\int _{0}^{\unicode[STIX]{x1D702}}{\mathcal{F}}_{s}\,\text{d}\bar{\unicode[STIX]{x1D702}}-\int _{0}^{\unicode[STIX]{x1D702}}{\mathcal{F}}_{s}\bar{\unicode[STIX]{x1D702}}\,\text{d}\bar{\unicode[STIX]{x1D702}}-\unicode[STIX]{x1D702}\int _{0}^{1}{\mathcal{F}}_{s}(1-\unicode[STIX]{x1D702})\,\text{d}\unicode[STIX]{x1D702}\end{eqnarray}$$
in terms of the unknown axial and azimuthal pressure gradients
 $\text{d}\langle p_{1}^{\prime }\rangle /\text{d}x$
and
 $\unicode[STIX]{x2202}\langle \,\hat{p}_{1}\rangle /\unicode[STIX]{x2202}s$
. Our previous paper (Sánchez et al.
Reference Sánchez, Martínez-Bazán, Gutiérrez-Montes, Criado-Hidalgo, Pawlak, Bradley, Haughton and Lasheras2018) did not explicitly consider the transverse steady-streaming velocity
 $\langle v_{1}\rangle$
, which enters in the transport description of the solute through the Lagrangian velocity component (2.27). This important quantity can be obtained by considering terms of order
 $\unicode[STIX]{x1D700}$
in the time-averaged continuity equation, yielding
 $$\begin{eqnarray}\displaystyle \langle v_{1}\rangle & = & \displaystyle -\frac{1}{\ell }\frac{\unicode[STIX]{x2202}}{\unicode[STIX]{x2202}x}\left[\ell \int _{0}^{\unicode[STIX]{x1D702}}(\bar{h}\langle u_{1}\rangle +\langle h_{0}^{\prime }u_{0}\rangle )\,\text{d}\unicode[STIX]{x1D702}\right]+\unicode[STIX]{x1D702}\frac{\unicode[STIX]{x2202}\bar{h}}{\unicode[STIX]{x2202}x}\langle u_{1}\rangle +\unicode[STIX]{x1D702}\left\langle u_{0}\frac{\unicode[STIX]{x2202}h_{0}^{\prime }}{\unicode[STIX]{x2202}x}\right\rangle \nonumber\\ \displaystyle & & \displaystyle -\,\frac{1}{\ell }\frac{\unicode[STIX]{x2202}}{\unicode[STIX]{x2202}s}\left[\int _{0}^{\unicode[STIX]{x1D702}}(\bar{h}\langle w_{1}\rangle +\langle h_{0}^{\prime }w_{0}\rangle )\,\text{d}\unicode[STIX]{x1D702}\right]+\unicode[STIX]{x1D702}\frac{1}{\ell }\frac{\unicode[STIX]{x2202}\bar{h}}{\unicode[STIX]{x2202}s}\langle w_{1}\rangle +\unicode[STIX]{x1D702}\left\langle w_{0}\frac{1}{\ell }\frac{\unicode[STIX]{x2202}h_{0}^{\prime }}{\unicode[STIX]{x2202}s}\right\rangle .\end{eqnarray}$$
The axial and azimuthal steady-streaming components are related by
 $$\begin{eqnarray}\frac{\unicode[STIX]{x2202}}{\unicode[STIX]{x2202}x}\left[\ell \left(\bar{h}\int _{0}^{1}\langle u_{1}\rangle \,\text{d}\unicode[STIX]{x1D702}+\int _{0}^{1}\langle h_{0}^{\prime }u_{0}\rangle \,\text{d}\unicode[STIX]{x1D702}\right)\right]+\frac{\unicode[STIX]{x2202}}{\unicode[STIX]{x2202}s}\left(\bar{h}\int _{0}^{1}\langle w_{1}\rangle \,\text{d}\unicode[STIX]{x1D702}+\int _{0}^{1}\langle h_{0}^{\prime }w_{0}\rangle \,\text{d}\unicode[STIX]{x1D702}\right)=0\end{eqnarray}$$
obtained by taking the time average of (A 16). Integrating this last equation in the azimuthal direction gives
 $$\begin{eqnarray}\bar{h}\int _{0}^{1}\langle w_{1}\rangle \,\text{d}\unicode[STIX]{x1D702}+\int _{0}^{1}\langle h_{0}^{\prime }w_{0}\rangle \,\text{d}\unicode[STIX]{x1D702}=-\frac{\unicode[STIX]{x2202}}{\unicode[STIX]{x2202}x}\left[\ell \int _{0}^{s}\left(\bar{h}\int _{0}^{1}\langle u_{1}\rangle \,\text{d}\unicode[STIX]{x1D702}+\int _{0}^{1}\langle h_{0}^{\prime }u_{0}\rangle \,\text{d}\unicode[STIX]{x1D702}\right)\,\text{d}s\right],\end{eqnarray}$$
which can be used together with (A 25) and (A 26) to determine
 $\unicode[STIX]{x2202}\langle \,\hat{p}_{1}\rangle /\unicode[STIX]{x2202}s$
as a function of
 $\text{d}\langle p_{1}^{\prime }\rangle /\text{d}x$
. Evaluating (A 29) at
 $s=1$
and using the condition that the canal is closed at
 $x=1$
, so that the time-averaged value of the axial volume flux has to be necessarily zero, leads to
 $$\begin{eqnarray}\int _{0}^{1}\bar{h}\left(\int _{0}^{1}\langle u_{1}\rangle \,\text{d}\unicode[STIX]{x1D702}\right)\,\text{d}s+\int _{0}^{1}\int _{0}^{1}\langle h_{0}^{\prime }u_{0}\rangle \,\text{d}\unicode[STIX]{x1D702}\,\text{d}s=0,\end{eqnarray}$$
which can be used, together with (A 25), to compute the average streamwise pressure gradient
 $\text{d}\langle p_{1}^{\prime }\rangle /\text{d}x$
, thereby completing the determination of the steady-streaming flow.
Appendix B. Solute transport in concentric annular canals
As discussed in the main text, axisymmetric annular canals constitute a singular configuration of academic interest, although its anticipated relevance in connection with transport in the spinal canal is limited. A distinctive characteristic of axisymmetric geometries is that, because of the absence of azimuthal motion, the width-averaged axial velocity
 $\int _{0}^{1}u_{L}\,\text{d}\unicode[STIX]{x1D702}$
is identically zero, so that solute transport for
 $S\sim 1$
depends exclusively on Taylor dispersion, as described by (4.1).
To investigate this case in more detail, we consider a concentric annular canal of uniform elastic properties (i.e.
 $\ell =1$
,
 $\bar{h}=1$
, and
 $\unicode[STIX]{x1D6FE}=1$
) with an initial solute concentration
 $$\begin{eqnarray}c_{i}(x)=\exp [-16^{2}(x-0.75)^{2}].\end{eqnarray}$$
A detailed description of the temporal evolution requires integration of the full transport equation (3.1) over multiple cycles in the short time scale
 $t$
for a sufficiently small value of
 $\unicode[STIX]{x1D700}$
. For the concentric canal, the equation takes the simplified form
 $$\begin{eqnarray}\frac{\unicode[STIX]{x2202}c}{\unicode[STIX]{x2202}t}-\unicode[STIX]{x1D700}\frac{\unicode[STIX]{x2202}h^{\prime }}{\unicode[STIX]{x2202}t}\frac{\unicode[STIX]{x1D702}}{h}\frac{\unicode[STIX]{x2202}c}{\unicode[STIX]{x2202}\unicode[STIX]{x1D702}}+\unicode[STIX]{x1D700}u\left(\frac{\unicode[STIX]{x2202}c}{\unicode[STIX]{x2202}x}-\frac{\unicode[STIX]{x2202}h}{\unicode[STIX]{x2202}x}\frac{\unicode[STIX]{x1D702}}{h}\frac{\unicode[STIX]{x2202}c}{\unicode[STIX]{x2202}\unicode[STIX]{x1D702}}\right)+\unicode[STIX]{x1D700}\frac{v}{h}\frac{\unicode[STIX]{x2202}c}{\unicode[STIX]{x2202}\unicode[STIX]{x1D702}}=\frac{1}{\unicode[STIX]{x1D6FC}^{2}Sh^{2}}\frac{\unicode[STIX]{x2202}^{2}c}{\unicode[STIX]{x2202}\unicode[STIX]{x1D702}^{2}}.\end{eqnarray}$$
The instantaneous velocity and canal deformation were evaluated from the results of appendix A from the approximate expressions
 $u=u_{0}+\unicode[STIX]{x1D700}\langle u_{1}\rangle$
,
 $v=v_{0}+\unicode[STIX]{x1D700}\langle v_{1}\rangle$
,
 $h-1=\unicode[STIX]{x1D700}h^{\prime }=\unicode[STIX]{x1D700}h_{0}^{\prime }$
. Besides the non-permeability boundary conditions
 $\unicode[STIX]{x2202}c/\unicode[STIX]{x2202}\unicode[STIX]{x1D702}=0$
at
 $\unicode[STIX]{x1D702}=0,1$
, the integration of (B 2) must specify a boundary condition at
 $x=0$
. To handle the oscillatory nature of the axial flow at that boundary, the computational domain was artificially extended in the upward direction by an absorbing buffer region between
 $x=-0.1$
and
 $x=0$
, in which the values of the transport coefficients in (B 2) were set equal to those at
 $x=0$
. An absorption term
 $-Bc$
with
 $B=\max (0,-\{1-\tanh [20(x+0.05)]\}u)$
is added to the right-hand side of the transport equation (B 2) to effectively absorb the solute concentration that enters the buffer region during the upward-moving part of the oscillation cycle. The numerical integrations of (B 2) with the additional absorption term were performed using a third-order implicit backward difference scheme for time derivatives and a fourth-order centred finite difference discretization for the spatial derivatives.
Results of integrations of (B 2) are to be compared with those of the reduced evolution equation
 $$\begin{eqnarray}\frac{\unicode[STIX]{x2202}c_{0}}{\unicode[STIX]{x2202}\unicode[STIX]{x1D70F}}=\frac{\unicode[STIX]{x2202}}{\unicode[STIX]{x2202}x}\left(D_{xx}\frac{\unicode[STIX]{x2202}c_{0}}{\unicode[STIX]{x2202}x}\right)\end{eqnarray}$$
which follows from (4.1) when
 $\bar{h}=\ell =1$
. A boundary value
 $c_{0}=0$
at
 $x=0$
was used in the integrations, with no boundary conditions needed at the canal end
 $x=1$
, since
 $D_{xx}$
vanishes there.
The evolution of the solute concentration in a concentric canal (
 $\unicode[STIX]{x1D6FD}=0.0$
) obtained for
 $\unicode[STIX]{x1D6FC}=6$
,
 $k=1$
and
 $S=1$
. (a) Instantaneous spatial distributions at six instants of time. Each panel shows on the left the concentration
 $c(x,\unicode[STIX]{x1D702},t)$
obtained from integration of (B 2) for
 $\unicode[STIX]{x1D700}=0.02$
, with the corresponding width-averaged value
 $\int _{0}^{1}c\,\text{d}\unicode[STIX]{x1D702}$
(red solid line) compared on the right with the value of
 $c_{0}(x,\unicode[STIX]{x1D70F})$
obtained from the simplified transport equation (B 3) (thick dashed line). (b) Comparison of the temporal evolution of the width-averaged value
 $\int _{0}^{1}c\,\text{d}\unicode[STIX]{x1D702}$
at
 $x=0.65$
obtained from (B 2) for
 $\unicode[STIX]{x1D700}=0.02$
(pink) and
 $\unicode[STIX]{x1D700}=0.1$
(purple) with the value of
 $c_{0}(x=0.65,\unicode[STIX]{x1D70F})$
(black) determined from (B 3).

Results of integrations of (B 2) for
 $\unicode[STIX]{x1D700}=0.02$
,
 $\unicode[STIX]{x1D6FC}=6$
,
 $k=1$
and different values of
 $S$
. (a) Concentration fields
 $c(x,\unicode[STIX]{x1D702},t)$
at
 $t/(2\unicode[STIX]{x03C0})=125$
. (b) Time evolution of
 $\unicode[STIX]{x0394}c=\int _{0}^{1}\int _{0}^{1}(c-c_{i})^{2}\,\text{d}\unicode[STIX]{x1D702}\,\text{d}x/\!\int _{0}^{1}\int _{0}^{1}(c_{i})^{2}\,\text{d}\unicode[STIX]{x1D702}\,\text{d}x$
.

Instantaneous concentration maps
 $c(x,\unicode[STIX]{x1D702},t)$
obtained from (B 2) for
 $S=1$
and
 $\unicode[STIX]{x1D700}=0.02$
are shown in figure 8(a). In the integrations, the velocity and canal deformation are evaluated with
 $\unicode[STIX]{x1D6FC}=6$
and
 $k=1$
. As indicated in the top right corner, the times selected
 $t-\unicode[STIX]{x03C0}/2=2\unicode[STIX]{x03C0}(125,250,375,500,626)$
incorporate a
 $\unicode[STIX]{x03C0}/2$
shift, so that the specific snapshots shown in the figure represent intermediate instants between peaks of the fluctuating cycle. The results are used to compute the width-averaged concentration
 $\int _{0}^{1}c\,\text{d}\unicode[STIX]{x1D702}$
, whose axial distribution is shown as a solid curve on the right side of each plot. The results are compared with the profiles of
 $c_{0}(x,\unicode[STIX]{x1D70F})$
at corresponding times
 $\unicode[STIX]{x1D70F}=\unicode[STIX]{x1D700}^{2}t$
obtained by integrating (B 3), with the value of
 $D_{xx}$
evaluated for
 $\unicode[STIX]{x1D6FC}=6$
,
 $k=1$
and
 $S=1$
. As can be seen, the accuracy of the predictions provided by the reduced equation (B 3), represented by dashed curves, is excellent in all cases.
The time-averaged variable
 $c_{0}(x,\unicode[STIX]{x1D70F})$
does not describe the short-time fluctuations of the concentration that are driven by the oscillatory flow. These can be significant initially when the solute is injected in a small localized region, that being the case considered in (B 1). The extent of the resulting fluctuations, larger for larger values of
 $\unicode[STIX]{x1D700}$
, is illustrated by plotting in figure 8(b) the variation of
 $\int _{0}^{1}c\,\text{d}\unicode[STIX]{x1D702}$
with
 $t$
at
 $x=0.65$
. The solution is compared with the corresponding variation of
 $c_{0}$
with
 $\unicode[STIX]{x1D70F}=\unicode[STIX]{x1D700}^{2}t$
at that same location, obtained by integrating (B 3). The comparisons indicate that the time-averaged value
 $c_{0}$
describes adequately the evolution of the envelope of the fluctuating solution, with decreasing errors that reduce to values of order
 $|\int _{0}^{1}c\,\text{d}\unicode[STIX]{x1D702}-c_{0}|\sim \unicode[STIX]{x1D700}$
for long times, as is consistent with the order of the approximation used here.
The model equation (B 3), describing the long-time evolution of the solute in the distinguished limit
 $S\sim 1$
, involves a concentration
 $c_{0}(x,\unicode[STIX]{x1D70F})$
that is uniform across the canal. Correspondingly, convective transport is absent in this limit, because the axial velocity
 $u_{L}$
has a zero width-averaged value
 $\int _{0}^{1}u_{L}\,\text{d}\unicode[STIX]{x1D702}=0$
. The non-uniformities of the concentration across the canal become more pronounced for increasing values of
 $S$
, thereby promoting convective transport by mean Lagrangian motion. This is clearly seen in the reduced transport equation that arises in the distinguished limit
 $S\sim \unicode[STIX]{x1D700}^{-2}$
,
 $$\begin{eqnarray}\frac{\unicode[STIX]{x2202}c_{0}}{\unicode[STIX]{x2202}\unicode[STIX]{x1D70F}}+u_{L}\frac{\unicode[STIX]{x2202}c_{0}}{\unicode[STIX]{x2202}x}+v_{L}\frac{\unicode[STIX]{x2202}c_{0}}{\unicode[STIX]{x2202}\unicode[STIX]{x1D702}}=\frac{1}{\unicode[STIX]{x1D6FC}^{2}\unicode[STIX]{x1D700}^{2}S}\frac{\unicode[STIX]{x2202}^{2}c_{0}}{\unicode[STIX]{x2202}\unicode[STIX]{x1D702}^{2}},\end{eqnarray}$$
obtained by writing (3.9) for a concentric canal.
The reduced transport equations (B 3) (for
 $S\sim 1$
) and (B 4) (for
 $S\sim \unicode[STIX]{x1D700}^{-2}$
) involve different transport mechanisms, namely, Taylor dispersion for
 $S\sim 1$
and convection driven by steady streaming and Stokes drift for
 $S\sim \unicode[STIX]{x1D700}^{-2}$
. Since the Taylor diffusivity
 $D_{xx}$
vanishes for
 $S\gg 1$
whereas convection becomes ineffective as the concentration becomes uniform across the canal for
 $S\ll \unicode[STIX]{x1D700}^{-2}$
, neither transport mechanism can operate efficiently for values of
 $S$
in the intermediate range
 $1\ll S\ll \unicode[STIX]{x1D700}^{-2}$
. This reasoning seems to suggest that in concentric canals the dispersion rate must exhibit a non-monotonic behaviour as the Schmidt number increases from that of gases
 $S\sim 1$
to that of liquids
 $S\sim \unicode[STIX]{x1D700}^{-2}$
, with a minimum in the dispersion rate reached for an intermediate value of
 $S$
in the range
 $1\ll S\ll \unicode[STIX]{x1D700}^{-2}$
.
This paradoxical behaviour is illustrated in figure 9(a) by representing instantaneous distributions of
 $c(x,\unicode[STIX]{x1D702},t)$
obtained after 125 integration cycles (i.e. at
 $t/(2\unicode[STIX]{x03C0})=125$
) by integration of (B 2) for
 $\unicode[STIX]{x1D700}=0.02$
and different values of
 $S$
. In agreement with the reduced transport equation (B 3), for Schmidt numbers
 $S\sim 1$
the plots in figure 9(a) reveal that dispersion is seen to proceed as a nearly one-dimensional diffusion process, with the diffusion rate decreasing for increasing values of
 $S$
as a result of the decreasing Taylor diffusivity
 $D_{xx}$
. On the other hand, convection is seen to dominate the solute transport in the limit
 $S\sim \unicode[STIX]{x1D700}^{-2}$
, as is apparent for
 $S=2500$
, where the axial velocity, positive in the central region and negative near the walls, is responsible for the resulting spreading pattern. Neither of these mechanisms is effective at intermediate values of
 $S$
, where the dispersion rate is seen to be much more limited.
The differences in dispersion rate observed in figure 9(a) can be quantified by evaluating
 $\unicode[STIX]{x0394}c=\int _{0}^{1}\int _{0}^{1}(c-c_{i})^{2}\,\text{d}\unicode[STIX]{x1D702}\,\text{d}x/\!\int _{0}^{1}\int _{0}^{1}(c_{i})^{2}\,\text{d}\unicode[STIX]{x1D702}\,\text{d}x$
as a global measure of the dispersion. The value of
 $\unicode[STIX]{x0394}c$
is normalized to be
 $\unicode[STIX]{x0394}c=0$
at
 $t=0$
and
 $\unicode[STIX]{x0394}c=1$
as the solute abandons the canal for
 $t\rightarrow \infty$
. The evolution of
 $\unicode[STIX]{x0394}c(t)$
obtained from the results of integrations of the transport equation (B 2) is shown in figure 9(b). As can be seen, since
 $\unicode[STIX]{x0394}c$
is subject to short-time fluctuations, when represented over many cycles the resulting curves appear as bands that evolve slowly in the long time scale
 $\unicode[STIX]{x1D700}^{2}t$
.
The results for increasing
 $S$
appear to be in agreement with the previous discussion of the two different transport mechanisms. Thus the slope of the resulting bands, measuring the rate of dispersion, is seen to decrease initially as the Schmidt number increases from
 $S=1$
, a result that can be attributed to the diminished effect of Taylor dispersion. The slope is very small in the intermediate cases
 $S=50$
and
 $S=250$
, but increases substantially for
 $S=1000$
and
 $S=2500$
, as convection driven by the mean Lagrangian motion becomes effective.
The plots clearly support the existence of an intermediate range of values of
 $S$
where neither Taylor dispersion nor Lagrangian convection are very effective, a distinctive feature of solute transport in perfectly axisymmetric canals. As shown in figures 6 and 7, corresponding to a canal defined between two eccentric cylinders, in the presence of asymmetries convection driven by the time-averaged Lagrangian motion remains the dominant transport mechanism regardless of the Schmidt number. An important conclusions of those results is that, with the exception of axisymmetric canals, the simplified equation (3.13) provides a reasonably accurate model for the description of solute transport.



