I. INTRODUCTION
The discovery of multiwalled carbon nanotubes (MWNTs) in 1991, followed by the discovery of single walled carbon nanotubes (SWNTs) in 1993 by Sumio Ilijima,Reference Iijima1,Reference Iijima and Ichihashi2 has led to a breadth of research due to the interesting electrical properties these materials exhibit. SWNTs can behave as semiconductors or metals depending upon the length and chirality of the nanotubes, whereas MWNTs behave similar to the metallic SWNTs, which allow for currents of up to 109 A/cm2 to be carried.Reference Zhang, Zhu, Wang, Wang, Sun and Wang3,Reference Wei, Vajtai and Ajayan4
Because of the high current that can potentially be carried, 2D networks of carbon nanotubes (CNTs) are often studied for electrical applications including transistors, transparent electrodes, and nanoporous electrodes.Reference Hu, Hecht and Gruner5–Reference Zhu, Wei, Wang and Wu7 There are many methods to deposit CNT films from dilute dispersions, which include dropcasting among others. In dropcasting, the CNT dispersion is put onto a substrate and dried in a variety of manners, including vacuum filtration and evaporation techniques.Reference Muhlbauer and Gerhardt8
In this paper, we report on the surface electrical properties of 2D networks made by depositing a MWNT dispersion with the same formulation onto filter papers with different pore sizes. The main goal is to evaluate what effect the paper substrate structure has on the resultant in-plane electrical properties of the carbon nanotube thin films (CNT-TFs). Previous studies on CNTs and paper have focused on either making the paper itself conductiveReference Yang, He, Puneet, Su, Skove, Gaillard, Tritt and Rao9,Reference Huang, Chen, Peng and Gerhardt10 or using paper as a substrate for fabricating conductive thin filmsReference Hu, Choi, Yang, Jeong, La Mantia, Cui and Cui11–Reference Kordas, Mustonen, Toth, Jantunen, Lajunen, Soldano, Talapatra, Kar, Vajtai and Ajayan15 useful for flexible electronics. Paper is a desirable substrate due to its lightweight and bendable nature, as compared to other commonly used substrates (PET, SiO2, etc.).
Hu et al. reported on highly conductive paper (10 Ω/sq), which was made by depositing CNT dispersions using the Meyer rod method. However, to have a sheet resistance of that level, the authors reported that the thickness of the films they made was near 10 µm.Reference Hu, Choi, Yang, Jeong, La Mantia, Cui and Cui11 In contrast, much thinner layers were necessary to achieve similar properties when MWNT films were made using a unidirectional drying method by Huang et al.Reference Huang, Chen, Peng and Gerhardt10. It has also been shown how an increase in the surface roughness of MWNTs on paper decreases the threshold field in field effect transistor technologies.Reference Lyth and Silva14 Many other useful applications of conductive paper and related materials, too numerous to mention, have been reported in the literature. However, most of the articles only mention that the paper substrate used is “commercially available” without identifying any other trait of the filter paper being used. Thus, when other researchers attempt to obtain similar results, they find that many times, it is not possible to reproduce the results quoted.
This paper was written with the goal of providing a systematic methodology to determine the resultant in-plane properties of MWNT thin films deposited on paper substrates. To ensure that only the underlying substrate structure was a variable, the MWNT dispersion concentration used to deposit the films was kept a constant. It will be shown that having a constant chemistry does not guarantee a constant in-plane microstructure, especially when the microstructure of the substrates used to deposit the particulate films, i.e., the pore size of the filter papers used, is varied.
II. EXPERIMENTAL METHODS
A. Chemicals and materials used
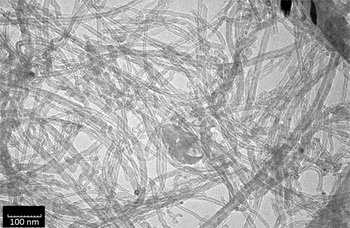
MWNTs were obtained from cheaptubes.com with the following specifications: 0.5–2.0 µm in length, 8–15 nm in diameter, >95 wt% purity with <1.5 wt% ash. Sodium dodecylbenzenesulfonate (SDBS) was purchased from Sigma-Aldrich (St. Louis, MO). Cellulose-based qualitative filter papers of 1, 5, 25, and 40 µm pore sizes (labeled 410, 413, 415, and 417, respectively) with a 90 mm diameter were obtained from VWR.com. Figure 1 displays a transmission electron microscopy image (TEM) of the MWNTs used in this study. The image was taken using a JEOL 100CX transmission electron microscope (Tokyo, Japan) at an accelerating voltage of 100 kV.
Transmission electron microscopy image of MWNTs used in this study. The scale bar reads 100 nm.

B. MWNT dispersion and film preparation
Using the same procedure described by Huang et al.,Reference Huang, Chen, Peng and Gerhardt10 1 mg/mL MWNTs were added to 15 mL of distilled water with 10 mg/mL SDBS. In short, the MWNT dispersion was ultrasonicated for 10 min. After the first 10 min, the SDBS surfactant was added in small quantities over another 10 min period of time, while the dispersion continued being ultrasonicated. Following the addition of the whole of the surfactant, the dispersion was magnetically mixed for 12 h.Reference Huang, Chen, Peng and Gerhardt10 All MWNT films reported in this paper were made using the same dispersion concentration.
For film deposition, 150 µL of dispersion was dropped onto the filter paper using a mechanical pipette from a height of about 13 mm above the filter paper. Once each layer dried, the next layer was deposited using the same technique until 4 layers were obtained. Four-layer films were chosen as they were sufficiently thick to give measurable electrical properties in-plane for all networks discussed. The effect of the number of deposited layers as well as the effect of the substrate architecture on the through-plane properties of these films will be reported in a forthcoming paper.Reference Muhlbauer and Gerhardt16 Since the films were dried using three different methods onto the four different pore size paper substrates, these experiments resulted in 12 different types of MWNT network films.
The first drying method used was standard vacuum filtration of the MWNT dispersion through the filter papers (referred to as vacuum filtration).Reference de Heer, Bacsa, Chatelain, Gerfin, Humphrey-Baker, Forro and Ugarte17 The next drying method involved placing the MWNT dispersion onto the filter paper and holding it in a 65 °C heater for 10 min (65 °C dry). Finally, the last drying method is an adapted version of the one described by Huang et al.Reference Huang, Chen, Peng and Gerhardt10 (called enhanced dry in this paper). In this method, a ceramic heating board was heated to 90 °C and the filter paper was placed on top of it. The film was deposited on top of the paper and placed in a 65 °C heater for 5 min per layer to induce unidirectional drying without allowing for too much penetration of the MWNT film into the paper. Between each deposition layer, the ceramic heating board was reheated to 90 °C. All MWNT films were <100 nm thick.
C. Characterization techniques
Although DC electrical techniques are the most common techniques for obtaining electrical properties, they are limited in that they can only determine the total film properties. Conversely, AC electrical techniques, such as impedance spectroscopy, are more sensitive to different electrical processes present in the films, resulting in the ability to separate the contribution of each process from the overall electronic behavior of the film.Reference Macdonald18,Reference Gerhardt19 Combining this knowledge with microscopy allows for the determination of the electrical properties due to the different microstructural components of CNT-TFs. In-lens SEM images of the detailed CNT-TF networks were taken with a Zeiss SEM Ultra60 (Oberkochen, Germany) at 1–2 kV.
Impedance spectroscopy was carried out using two setups: Solartron 1260 alone for the more conducting samples and Solartron 1296 connected to the Solartron 1260 for the more insulating samples (Hampshire, UK). For both setups, a four-point probe stage with a probe spacing of 1.5875 mm was used, where the high current and high voltage cables were shorted together and the low current and low voltage cables were shorted together, to use only two probes for the measurement of in-plane electrical properties.Reference Joshi and Gerhardt20 Different combinations of the probes (1 and 2, 2 and 3, and 3 and 4) were used to find electrical responses in the same small region of the film. The measurements were carried out by scanning the frequencies from 21 MHz to 1 Hz using an AC voltage of 0.1 V. The equivalent circuit values determined for all impedance data were found using ZView Software.
DC electrical characterization was done with a Keithley 6430 Sub-Femtoamp Remote SourceMeter (Solon, OH) in the auto ohms measurements setup and connected to a four-point probe stage with a probe spacing of 1.016 mm to confirm the results obtained using AC techniques. In all cases, the measured overall AC and DC resistances overlapped within the experimental error.
III. RESULTS AND DISCUSSION
A. Effect of the drying technique on film evolution on the 410 (1 µm pore size) paper
As a means to validate the choice of 4 layers as the film parameter used in this study, the DC electrical resistances of 1–4-layer films were elucidated for films deposited on the 410 filter paper (1 µm pore size) and are shown in Table I. An extensive study was done with the 410 filter paper because its pore size is similar to the length of the MWNTs used in this study resulting mostly in the occurrence of surface deposition. The resistance of the films made of 1 layer of MWNTs varies widely by using the drying method. The drying methods, which force the MWNTs downward into the substrate (vacuum filtration and enhanced dry), have resistances two orders of magnitude lower than the 65 °C dry method suggesting that the lack of orientation in drying inhibits the bridging across the pores and, therefore, the formation of a fully connected network.
Average DC resistance values and standard deviation for 1- to 4-layer MWNT films deposited on the 410 filter paper and dried using three different methods.

For the second layer, the resistance continues to drop for all drying methods, although the resistance of the 65 °C dry-deposited film is still much larger (but on the same order of magnitude as the resistances of the other drying methods). By the third deposited layer, the resistance determined for all three drying methods overlap within the experimental error, suggesting that at this point, the pores in the substrate have been filled, and the film being formed is completely interconnected on the surface of the substrate. The addition of the fourth layer serves only to increase the interconnection of the MWNTs on the surface resulting in the decreased resistance presented. It can also be seen in Table I that in addition to the decreased resistance values, the standard deviation of the DC resistance has also decreased dramatically for all drying methods suggesting a greater uniformity in the film structure at this point.
B. Effect of substrate pore size for 4-layer films made with different drying methods
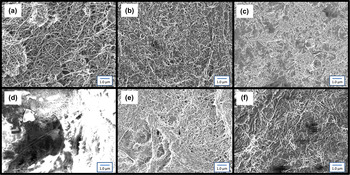
Figure 2(a) through Fig. 2(f) displays SEM images of 4-layer films deposited on two pore size papers: 413 (5 μm) and 415 (25 μm), prepared using vacuum filtration, enhanced drying, and drying at 65 °C. The effect of pore size during vacuum filtration can be seen visually by the difference in the MWNT networks displayed in Figs. 2(a) and 2(d). On the 413 filter paper, a highly dense MWNT network is formed, which completely covers the underlying structure of the substrate. Conversely, Fig. 2(d) shows a scattered network deposited on the 415 paper. The surface network formed by the films deposited on the 415 paper shows regions of MWNTs, with localized high density, separated by large regions, where MWNTs are not deposited.
SEM micrographs for 4-layer films deposited using the different drying techniques on the 413 and 415 papers. (a) Vacuum filtration on the 413 paper; (b) enhanced dry on the 413 paper; (c) 65 °C dry on the 413 paper; (d) vacuum filtration on the 415 paper; (e) enhanced dry on the 415 paper; (f) 65 °C dry on the 415 paper. The scale bars read 1 µm in all cases.

The pore size of the paper substrate has less effect when drying methods that do not force the solution all the way through the paper are utilized. Figures 2(b) and 2(e) show the difference in the surface coverage of enhanced dry films, whereas Figs. 2(c) and 2(f) show the difference for films made with 65 °C dry on the 413 and 415 papers, respectively. Although the paper backbone can be seen in both sets of images, these images also show a completely interconnected surface network of MWNTs.
C. Effect of substrate pore size on the electrical response of films made by vacuum filtration
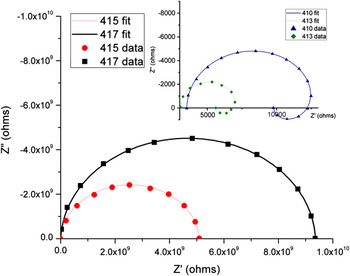
The vastly different surface characteristics of the vacuum-filtered MWNT films deposited onto the different pore size paper substrates result in very different electrical responses, as shown in the Nyquist plots in Fig. 3. The pore size of the substrate influences both the magnitude of the impedance response and the shape of the measured response. Since vacuum filtration forces the solution in a downward direction under constant vacuum, pore size should have a large effect on the formation of films on the surface of the paper substrate, as deposition will be occurring both on the surface and within the thickness of the paper. When pore sizes are much larger than the size of the MWNTs, it can be expected that a large number of the nanotubes will not be deposited on the surface on the paper [see Fig. 2(d)]. Conversely, when pore sizes are similar to the size of the MWNTs, a much smaller number of MWNTs will be pulled through the paper network as the pores will be bridged by the nanotubes. A much more complete network will be formed on the surface of small pore-sized papers [see Fig. 2(a)].
Nyquist plots calculated using MATLAB for the vacuum-filtered samples on all filter papers. The inset shows the corresponding Nyquist plots for vacuum-filtered films on the 410 and 413 filter papers, which are orders of magnitude smaller than the plots for the films deposited onto 415 and 417 filter papers shown in the main image.

As shown in Fig. 3, for the 415 and the 417 papers, the impedance response shows a single depressed semicircle in the first quadrant, with a magnitude between 5 and 10 GΩ, respectively. Because of the very high impedance response found, it is likely that the paper fibers control the MWNT electrical pathway on the surface of the paper. The inset of Fig. 3 shows the impedance response for the 410 and 413 papers. The magnitude of the response is much smaller in this case (in the kΩ range), and the shape of the curve is much more complicated, indicating multiple electrical pathways in the films, which are not overshadowed by the paper electrical properties.
D. Effect of substrate pore size on the electrical response of films made by the heat drying methods
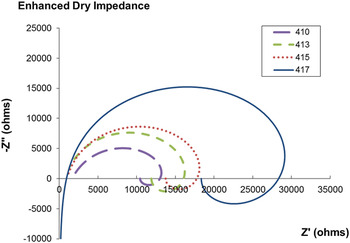
A summary of the impedance results for the enhanced dry deposited films on different pore-sized substrates is shown in Fig. 4. The impedance graph shape matches that found for films made using vacuum filtration on the small pore size papers, suggesting that the film is the dominating electrical pathway. Unlike the trend found for films deposited using vacuum filtration, as the pore size of the substrate increases, the magnitude of the impedance in the first quadrant increases along with it without any variation in the shape of the curves. The 65 °C dry-deposited films behave in the same manner as the enhanced dry films (not shown), varying only in the magnitude of the impedance response determined for the films.
Representative Nyquist plots determined using MATLAB showing the trend for the enhanced dry samples. As the pore size increases, the magnitude of the graph increases as well. Data taken for the CNT-TFs made by 65 °C dry showed the same trends for all of the filter papers (not shown).

When the paper pore size is held constant, the enhanced dry films have a smaller impedance response than the 65 °C dry films of the same paper backbone (not shown). In the enhanced dry films, the majority of drying happens in the direction of the heating board (unidirectionally below the sampleReference Huang, Chen, Peng and Gerhardt10), which pulls the films together on the surface [see Figs. 2(b) and 2(e)]. Conversely, the 65 °C drying technique subjects the film to drying evenly in all directions resulting in a more randomly spaced network. This can lead to areas that are more dense than other regions of the film [see Figs. 2(c) and 2(f)], resulting in a larger separation distance between CNTs and larger resistances. In these cases, there isn’t as drastic a change in the impedance properties; however, the variation in the size of the graphs allows for the determination of the change in properties due to the different film microstructures by using the same MWNT colloidal dispersion with the same filter paper.
E. Discussion of equivalent circuit element assignments
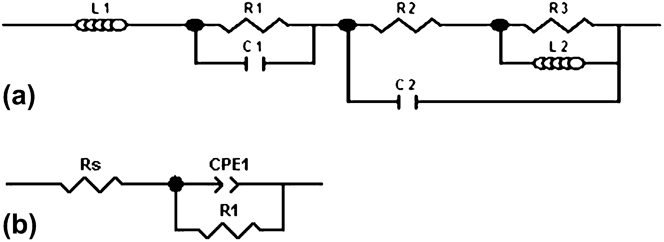
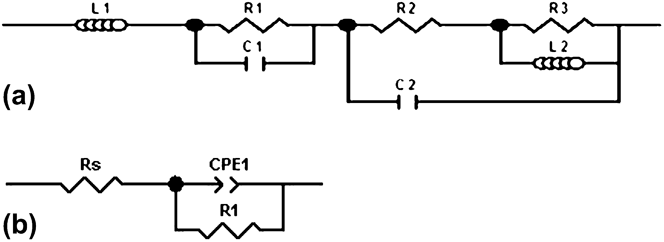
With the exception of the vacuum-filtered films formed on the 415 and 417 papers, which are the most insulating samples, the impedance results for the 4-layer films given in the inset of Fig. 3 and in Fig. 4 all show the same behavior and can be modeled with the same circuit. Figure 5(a) shows the equivalent circuit for the more conducting samples, whereas Fig. 5(b) shows the equivalent circuit for the less conducting or more insulating samples.
Equivalent circuits used to fit all of the impedance data: (a) the “nested-RL” circuit for all enhanced dry samples, 65 °C dry samples, and the films deposited through vacuum filtration on the 410 and 413 papers. (b) The CPE-containing circuit, which fits the impedance data found for vacuum-filtered films on the 415 and 417 papers.
1. Physical meaning of the circuit elements present for the more conducting films
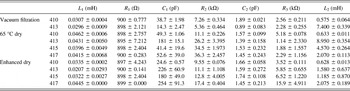
The “nested-RL” equivalent circuit, displayed in Fig. 5(a), is used to fit the measured impedance for the films that are the most conducting. The circuit elements present correspond to four graphical characteristics from high frequency to low frequency: (i) a high frequency inductance, (ii) a small parallel R–C semicircle that is constant throughout all graphs, (iii) a larger parallel R–C semicircle, and (iv) a low frequency parallel R–L semicircle. The nesting of the parallel R–L within the second parallel R–C is due to the need for fitting the curvature present when the curve passes between quadrants. The average values of the circuit elements and their standard deviations, obtained by fitting the data for all films measured that can be fitted by the nested-RL circuit, are presented in Table II.

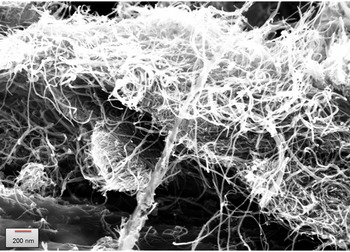
The high frequency inductive response (L 1) is believed to be related to the equipment response, which results in a very similar small inductance for all samples. However, the low frequency inductive response (L 2) of these CNTs is believed to be related to the CNTs wrapping around the paper fibersReference Kordas, Mustonen, Toth, Jantunen, Lajunen, Soldano, Talapatra, Kar, Vajtai and Ajayan15 as they show different values for films deposited on the different papers. Such a low frequency inductance has been reported previously for MWNT thin films created via inkjet printing on paperReference Kordas, Mustonen, Toth, Jantunen, Lajunen, Soldano, Talapatra, Kar, Vajtai and Ajayan15 and has been shown to be characteristic of the impedance of highly conducting samples such as metallic alloysReference Kumar, Kelekanjeri and Gerhardt21 and other highly conducting materials.Reference Gerhardt19 The low frequency resistance (R 3) is likely the resistance of the coiled tubes. With the exception of one outlier (enhanced dry sample on 417 paper), the R 3 values for all of the samples are in the same order of magnitude (2–6 kΩ), suggesting that the resistance of coiled CNTs on paper is an inherent property of these films. R 3 is larger than R 1 (resistance of uncoiled CNT bundles, ∼900 Ω) for all of the samples indicating that the coiled resistance is greater than the resistance of uncoiled CNTs of the same type. Figure 6 shows a high magnification SEM image that displays how the CNTs form a film by wrapping around a paper fiber.
SEM image of the coiled CNTs wrapping around a paper fiber from the 413 vacuum-filtered sample. The scale bar reads 200 nm.

The two R–C parallel semicircles (R 1C 1 and R 2C 2) in the middle frequencies are likely due to the different CNT bundles and junction behaviors in the material. Previous studies have found two separate semicircles with the higher frequency semicircle corresponding to bundle transport, whereas the lower frequency semicircle corresponded to transport through the junctions.Reference Garrett, Ivanov, Gerhardt, Puretsky and Geohegan22 The values for R 1 and R 2 reported in Table II are also in accordance with previous studies, where the resistances of the bundles and the junctions were measured separatelyReference Louie23–Reference Nirmalraj, Lyons, De, Coleman and Boland25 and are also comparable in value to those reported by Garrett et al.Reference Garrett, Ivanov, Gerhardt, Puretsky and Geohegan22
However, in our studies where we have fairly dense CNT networks, we found that the resistance of the semicircle corresponding to the bundles stayed relatively constant (∼900 Ω) for all samples (see R 1 in Table II), whereas that corresponding to R 2 (the junctions) varied with pore size and deposition technique. Therefore, R 1 seems to be a bulk material property of the MWNTs when deposited on paper substrates, whereas R 2 is dependent upon the quality of the interfaces between bundles, which is determined by the parameters under which the films were processed and the pore size of the underlying paper substrate. It should not be surprising that for CNT percolating networks, there is a difference in the measured response within bundles as compared to where the conducting bundles connect. By choosing to use paper substrates with different pore sizes, we have managed to vary this parameter more strongly and allow the impedance measurements to detect the differences. It should be added that the quality of contact between individual conducting fillers has also previously been detected by impedance measurements in both polymer and ceramic composites containing conducting fillers that form percolating networks.Reference Capozzi and Gerhardt26,Reference Bertram, Gerhardt and Schultz27
C 1 (the capacitance of the bundles) and C 2 (the capacitance of the junctions) describe the amount of charge capable of being stored in the CNT networks. In all cases, the capacitance for the bundles is higher than that for the junctions. This means that the bundles are able to store more charge than the junctions. This makes sense since capacitance is generally inversely proportional to the distance between charged species. It is reasonable to assume that the distance between concentric nanotubes in a bundle is much smaller than that between different bundles that would make up the junctions.
2. Physical meaning of the circuit elements for the more insulating films
For the more resistive CNT films prepared by vacuum filtration, when using the larger pore size papers (415 and 417), the equivalent circuit in Fig. 5(b) consisted of a semicircle in the first quadrant (parallel R 1-CPE) as well as a large series resistance R s. The mathematical form of the constant phase element, or CPE, is given in Eq. (1):
 $$Z_{{\rm{CPE}}} = {{R_1 } \over {1 + (j{\rm{\omega \tau )}}^{\rm{\beta }} }}\quad ,$$
where β corresponds to the angle of depression below the x-axis of the semicircle and τ is the RC time constant.Reference Louie23 The CPE is generally used to describe a distribution of current density on an inhomogeneous electrode surface,Reference Brug, van den Eeden, Sluyters-Rehbach and Sluyters28 but it is also used to represent a distribution of relaxation times.Reference Macdonald18,Reference Gerhardt19 As shown in Fig. 2(d), the structure of the films created via vacuum filtration on the 415 filter papers (and also 417, not shown) have a dual nature resulting from regions of relatively dense CNT networks separated by large pores. This inhomogeneous surface would result in a distribution of current density leading to much higher values of R s and R 1. Although bundle and junction resistances can be measured for the other films, which have dense networks that stretch across the entire film area, the films deposited via vacuum filtration on the 415 and 417 filter papers are only locally dense. The bundle and junction resistance values are overshadowed by the large disconnections in the network, leading to film resistance, which is dominated by the pores and the uncoated paper fibers. The determined circuit values from films whose electrical response can be fitted by this equivalent circuit can be found in Table III. It can be seen that R s, representing the combined response of the nanotubes and the paper fibers in dense areas, remains relatively constant, whereas R 1 does increase for films deposited onto 417 paper, which has larger pores than films deposited onto 415 filter papers.
Equivalent circuit values for the more insulating films whose response can be fitted to the CPE-containing circuit (e.g., data displayed in main part of Fig. 3).

IV. CONCLUSIONS
We systematically studied the AC in-plane electrical properties of 4-layer thin MWNT films made from the same MWNT/SDBS dispersions using various drying methods deposited onto filter papers of various pore sizes. We determined that even though the chemistry across all of the films is the same, the electrical and structural properties of the films are widely different due to the nature of the MWNT networks formed on the surface as a result of different pore sizes of the substrates used and the drying method utilized.
The electrical resistances of the films, as well as the corresponding equivalent circuits for CNT-TFs on paper substrates, were determined in detail, and two equivalent circuits were found: (i) one which can be used to fit the more conducting films that are not dominated by the pore size of the underlying substrate and (ii) a second equivalent circuit for the more insulating films, which is highly affected by the structure of the film i.e., dominated by the open pore areas of the large pore-sized substrates. The equivalent circuit assignments were aided by imaging the MWNT networks by SEM.
When the film formed a complete network on the surface, it was possible to determine the individual contributions to the electrical response due to different components of the film structure: coiled bundles, stretched bundles, and junctions between bundles. The magnitude of the resistances between bundles was found to be a function of the pore size of these films. Conversely, when network formation is inhibited by the pore structure of the paper substrate, the insulating nature of the paper and pores overwhelms the electrical properties of the MWNT film, even if there are highly dense CNT regions within the structure. In this case, the contribution to the electrical properties of the individual MWNT film components cannot be determined separately.
Although drying methods do not tend to change the equivalent circuit, except in the case of large pores during vacuum filtration, each drying method corresponding to the nested-RL circuit leads to a different electrical resistance at low frequencies. This occurs because the resistance at low frequencies is dominated by the resistance of the junctions, which change as a function of the paper substrate pore size and the film drying method. An additional high frequency semicircle is found for the more conducting samples, described by the nested-RL circuit, which remains relatively constant for all samples and is interpreted as the resistance of the uncoiled CNT bundles, a material property of the MWNTs used.
ACKNOWLEDGMENTS
The authors would like to acknowledge the Boeing Fellowship and Georgia Tech IGERT: Nanomaterials for Energy Storage and Conversion for RLM’s support and the Institute for Paper Science and Technology Alumni Association Scholarship Fund for SMJ’s support in completing this project. RAG further acknowledges the US Department of Energy Basic Energy Sciences Program under DE-FG02ER46035 for additional support of this work.