Introduction
Does being in chronic pain preclude the enjoyment of rewards? There are several routes through which pain could inhibit reward processing (Schwartz et al., Reference Schwartz, Temkin, Jurado, Lim, Heifets, Polepalli and Malenka2014). For example, pain's attention-grabbing quality could distract from rewards (Eccleston and Crombez, Reference Eccleston and Crombez1999). Also, the stress caused by enduring pain could inhibit reward processing (Porcelli and Delgado, Reference Porcelli and Delgado2017). The high comorbidity between chronic pain and depression could be another cause. Anhedonia, defined as the impaired capacity to experience pleasure from naturally rewarding objects and events, is one key symptom of depression.
Surprisingly little data on anhedonia in chronic pain is available in the literature. Nearly four decades ago, Marbach and colleagues (Marbach and Lund, Reference Marbach and Lund1981, Marbach et al., Reference Marbach, Richlin and Lipton1983) found significantly more physical anhedonia in arthritic but not facial pain patients. Depression scores showed only a modest relationship with anhedonia across arthritic and facial pain patients. Two recent studies of chronic pain reported elevated scores on anhedonia-related items of depression questionnaires (Elvemo et al., Reference Elvemo, Landrø, Borchgrevink and Håberg2015), which were partly related to the presence of breakthrough pain (Narayana et al., Reference Narayana, Katz, Shillington, Stephenson, Harshaw, Frye and Portenoy2015). However, a new study using a validated anhedonia questionnaire found that only a small proportion of abdominal pain patients exhibited anhedonia above the validated cutoff (Carpinelli et al., Reference Carpinelli, Bucci, Santonicola, Zingone, Ciacci and Iovino2019). In summary, the extant literature, though limited, suggests that depression may not be the primary mechanism linking chronic pain to anhedonia.
Another potential route through which chronic pain could cause anhedonia is via disrupted opioidergic signaling in the brain. Several molecular imaging studies indicate alterations in endogenous opioid tone in chronic pain samples (Harris et al., Reference Harris, Clauw, Scott, McLean, Gracely and Zubieta2007, Martikainen et al., Reference Martikainen, Peciña, Love, Nuechterlein, Cummiford, Green, Harris, Stohler and Zubieta2013). These changes are believed to result from pain-induced reductions in mu-opioid receptor expression and have been linked to anhedonia (2018). Mu-opioid receptor signaling in humans is thought to downregulate pain (Zubieta et al., Reference Zubieta, Smith, Bueller, Xu, Kilbourn, Jewett, Meyer, Koeppe and Stohler2001; Sprenger et al., Reference Sprenger, Valet, Boecker, Henriksen, Spilker, Willoch, Wagner, Wester and Tolle2006) and upregulate pleasure (Chelnokova et al., Reference Chelnokova, Laeng, Eikemo, Riegels, Løseth, Maurud, Willoch and Leknes2014; Eikemo et al., Reference Eikemo, Løseth, Johnstone, Gjerstad, Willoch and Leknes2016; Price et al., Reference Price, Christou, Backman, Stone and Schweinhardt2016; Buchel et al., Reference Buchel, Miedl and Sprenger2018). Moreover, many patients receive prescription opioid treatment for chronic pain. Indeed, extended opioid therapy is theorized to cause anhedonia via dopaminergic and opioidergic mechanisms integral to hedonic function (Volkow and McLellan, Reference Volkow and McLellan2016, but see Eikemo et al., Reference Eikemo, Lobmaier, Pedersen, Kunoe, Matziorinis, Leknes and Sarfi2019).
Furthermore, misuse of opioids occurs with some frequency in opioid-treated chronic pain patients (Vowles et al., Reference Vowles, McEntee, Julnes, Frohe, Ney and van der Goes2015). Prescription opioid misuse is theorized to further exacerbate hedonic deficits in chronic pain populations (Garland et al., Reference Garland, Froeliger, Zeidan, Partin and Howard2013), consistent with the role of anhedonia in other substance dependence (Franken et al., Reference Franken, Rassin and Muris2007; Stevens et al., Reference Stevens, Peschk and Schwarz2007; Huhn et al., Reference Huhn, Meyer, Harris, Ayaz, Deneke, Stankoski and Bunce2016; Garfield et al., Reference Garfield, Cotton, Allen, Cheetham, Kras, Yücel and Lubman2017). According to the allostatic model (Koob and Moal, Reference Koob and Moal1997; Koob and Le Moal, Reference Koob and Le Moal2001), opioid misuse causes neuroadaptations in cortico-limbic-striatal stress and reward systems in the brain, resulting in hedonic dysregulation. In support of this notion, opioid misusing chronic pain patients showed significantly reduced autonomic and attentional responses to naturally rewarding stimuli relative to medication-adherent chronic pain patients (Garland et al., Reference Garland, Froeliger and Howard2015a; Garland et al., Reference Garland, Bryan, Nakamura, Froeliger and Howard2017). However, whether opioid misusing chronic pain patients report reduced ability to experience pleasure from everyday rewards have yet to be determined.
Indeed, the field lacks up-to-date knowledge on the extent of anhedonia in chronic pain populations. Here, we administered a frequently used anhedonia questionnaire (Snaith et al., Reference Snaith, Hamilton, Morley, Humayan, Hargreaves and Trigwell1995) in four separate samples of chronic pain patients (total N = 488), and compared anhedonia scores in these samples to a meta-analytically derived reference value from 2664 healthy controls. Further, participants in each of the three opioid-treated chronic pain samples were classified as opioid misusers or non-misusers (i.e. medication adherent) according to a validated cut-point for opioid misuse. We hypothesized that chronic pain patients would display greater anhedonia than psychiatrically healthy controls, and that patients who misused opioids would have more severe anhedonia. We further hypothesized that anhedonia in these chronic pain samples would be partially independent of depression scores.
Methods
Overview of data collection
We administered the Snaith–Hamilton Pleasure Scale (SHAPS) (Snaith et al., Reference Snaith, Hamilton, Morley, Humayan, Hargreaves and Trigwell1995) and the Current Opioid Misuse Measure (COMM) (Butler et al., Reference Butler, Budman, Fernandez, Houle, Benoit, Katz and Jamison2007) to independent samples of chronic pain patients. Data were collected in three separate research projects assessing emotional and cognitive factors implicated in opioid misuse among individuals with chronic pain who had received prescription opioid analgesics for >90 days, and in a fourth project assessing anhedonia in non-opioid treated chronic pain patients. Sample one consisted of civilian patients (N = 115) recruited between 2011–2012 from primary care and pain clinics in the Southeastern U.S. Sample two consisted of military personnel (N = 35) recruited between 2013–2015 via provider referral from primary care, an interdisciplinary pain program, and a substance abuse program on an Army base in the U.S. Intermountain West. Sample three consisted of civilian patients (N = 282) recruited between 2015–2018 from primary care and pain clinics in the U.S. Intermountain West. Data for a fourth sample (N = 56) referred for hip or knee-joint replacement was collected in 2019 at a Norwegian hospital. These patients reported comparable chronic pain intensity to the opioid-treated samples but were not treated with opioid analgesics (seven patients reported intermittent codeine intake).
Participants
For the chronic pain samples, inclusion criteria were: being at least 18 years old; having chronic non-cancer-related pain (self-reported and confirmed through medical chart review or clinical interview). Opioid-treated samples were additionally required to have used prescription opioid analgesics for ⩾ five days a week for the past 90 days or more (Chou et al., Reference Chou, Fanciullo, Fine, Adler, Ballantyne, Davies, Donovan, Fishbain, Foley, Fudin, Gilson, Kelter, Mauskop, O'Connor, Passik, Pasternak, Portenoy, Rich, Roberts, Todd and Miaskowski2009). Daily use of opioids was an exclusion criterion for the sample of non-opioid-using patients. Participants were excluded if they were actively suicidal or psychotic according to the Mini-International Neuropsychiatric Interview 6.0 (MINI) (Sheehan et al., Reference Sheehan, Lecrubier, Sheehan, Amorim, Janavs, Weiller, Hergueta, Baker and Dunbar1998).
Measures
Anhedonia: The SHAPS consists of 14 items tapping the pleasure experienced from a variety of natural rewards (e.g. being with family, a warm bath, smiling faces, a beautiful landscape, receiving praise), rated on a Likert-type scale (1 = strongly agree, 4 = strongly disagree). Using this scoring rubric, SHAPS total scores can range from 14 to 56, with higher scores indicating higher levels of anhedonia (Snaith et al., Reference Snaith, Hamilton, Morley, Humayan, Hargreaves and Trigwell1995; Franken et al., Reference Franken, Rassin and Muris2007). Internal reliability across all four samples was adequate, with alpha coefficients from 0.78. to 0.92. To determine the proportion of each sample exceeding Snaith's suggested cutoff for clinical anhedonia (disagreeing with three or more out of the 14 items) and to facilitate comparison with data analyzed other scoring methods, we also used the 0–1 scoring system employed by Snaith et al. (Reference Snaith, Hamilton, Morley, Humayan, Hargreaves and Trigwell1995). The original and Norwegian (Eikemo et al., Reference Eikemo, Løseth, Johnstone, Gjerstad, Willoch and Leknes2016) versions of the SHAPS were used.
Pain: Pain was measured using the original and Norwegian (Klepstad et al., Reference Klepstad, Loge, Borchgrevink, Mendoza, Cleeland and Kaasa2002) versions of the Brief Pain Inventory.
Opioid misuse: On the COMM (Butler et al., Reference Butler, Budman, Fernandez, Houle, Benoit, Katz and Jamison2007), opioid-treated participants responded to 17 items rated on a Likert-type scale (0 = never, 4 = very often) regarding how often in the past 30 days they had engaged in behaviors linked with opioid misuse (e.g. took opioid medication in excessive doses, took medication in ways other than how it was prescribed). Internal reliability across all three samples was adequate, with alpha coefficients from 0.79 to 0.85. A study of a broad sample of opioid-treated chronic pain patients found via receiver–operator characteristic curve analyses that a score of 13 or higher on the COMM had maximum sensitivity and specificity to identify high risk for opioid misuse consistent with opioid use disorder (Meltzer et al., Reference Meltzer, Rybin, Saitz, Samet, Schwartz, Butler and Liebschutz2011). We used this COMM threshold value to minimize false positives and define groups because our recruited samples were similar to those of Meltzer et al. (Reference Meltzer, Rybin, Saitz, Samet, Schwartz, Butler and Liebschutz2011).
Opioid dose and duration of opioid use were obtained via self-report and corroborated by medical chart review. In sample 4, opioid use was additionally cross-checked by the Norwegian Prescription Database, where prescription drugs of every Norwegian patient are documented. Opioid doses were converted to morphine milligram equivalents using equianalgesic dose ratios established by guidelines from the Centers for Disease Control (CDC).
Presence of major depressive disorder and major depressive disorder severity (total depression symptom count for current and past episodes) were established during psychiatric screening by trained clinical staff (e.g. psychologists, social workers, nurses) via the Structured Clinical Interview for DSM (SCID; sample 2) and MINI (samples 1 and 3). Beck's Depression Inventory (BDI) scores were collected from sample 4; scores were supplemented by a clinical interview.
The University of Utah institutional review board (IRB) approved data collection for samples 2 and 3. Florida State University IRB approved data collection for sample 1, whereas data collection for sample 4 was approved by the Regional Ethics Committee (2018/1016 REK Sør-Øst) of Norway.
Data analysis
Meta-analysis
The first aim of our meta-analysis was to establish a reference value on the SHAPS (a general mean and confidence interval) for psychiatric healthy samples based on the existing literature, and to compare this value to that of the chronic pain samples. A second objective was to compare the anhedonia symptoms across the opioid-treated patient subgroups with and without symptoms of opioid misuse. Studies citing the original SHAPS publication (Snaith et al., Reference Snaith, Hamilton, Morley, Humayan, Hargreaves and Trigwell1995) were identified with SCOPUS, Web of Science and PubMed through April 2018. We included studies in all languages that:
(1) Included original data
(2) Used the complete SHAPS with four-point scoring of items
(3) Included at least one sample of participants described as having no current or recent psychiatric conditions.
(4) Assessed SHAPS at baseline or in a no-treatment condition
(5) Did not perform selective recruitment of participants based on SHAPS score
(6) Reported SHAPS data from analyses performed without adjusting for covariates.
Data were extracted from 58 studies. When necessary, we e-mailed corresponding authors (k = 36) to obtain missing data. To enable comparison, SHAPS scores from studies using 0–3, 4–1 or other variants of 4-point scoring of the SHAPS were recalculated to conform to a 1–4 scoring method in which 1 represents ‘strongly agree’ and 4 represents ‘strongly disagree’ (Franken et al., Reference Franken, Rassin and Muris2007). Descriptive statistics from these studies were entered in a meta-analysis together with the data from the patient samples.
For the meta-analysis of SHAPS scores, we used random-effects models implemented in the ‘metafor’ package (Viechtbauer, Reference Viechtbauer2010) in R statistical software (R Core Team, 2018). Random-effects models were chosen due to the assumed heterogeneity in SHAPS scores across patient and healthy samples. Sample means, standard deviations and number of participants in each sample were used as input data. We computed separate random-effects models for the healthy samples and for each of the patient samples. We also computed random-effects models for the subsamples of pain patients whose COMM scores indicated the presence or absence of opioid misuse. The DerSimonian and Laird (Reference DerSimonian and Laird1986) method was used to estimate the between-studies variance for each random-effects model.
Confidence intervals (CI; 95%) for the summary effects were calculated using critical z-values. We calculated a 95% prediction interval (PI) for the summary effect of each group using a bootstrapping procedure introduced by Nagashima et al. (Reference Misaki, Suzuki, Savitz, Drevets and Bodurka2019) and implemented in the ‘pimeta’ package in R. The PI accounts for heterogeneity and predicts the true effect of a new study given past studies. This method for calculating PI has good coverage probability even when the number of studies is small. 100 000 bootstrap samples were used to estimate the 95% prediction interval for each summary effect.
Comparisons of groups
We compared the summary SHAPS scores of the different groups and subgroups using Z tests.
Control analysis
To control for any differences in age and percentage of women between healthy and patient samples, we performed a meta-regression using the ‘metafor’ package and used Z-tests to test for significant group differences.
Analysis of individual SHAPS items
To address the question of whether anhedonia in chronic pain is driven by a specific subset of everyday rewards, we calculated mean scores and 95% CIs for each of the 14 SHAPS items across the four patient samples using random-effects models. The DerSimonian and Laird (Reference DerSimonian and Laird1986) method was used to estimate the between-studies variance.
Analysis of variance within the chronic pain samples
We computed zero-order correlations between primary study variables (pain severity, depression, opioid dose and duration of opioid medication) across all opioid-treated samples. To assess the extent to which the association between opioid misuse (dichotomous: misuser yes/no) and SHAPS scores were independent of these variables, we ran a series of mixed models to control for clustering by sample (via SPSS 22.0). Sample number was specified as a clustering variable by including a random intercept for sample number. Including random slopes resulted in lack of model convergence due to random slope variance estimates being zero. Hence, following a forward stepping model building approach (Raudenbush and Bryk, 2002; Snijders and Boskers, 1999), variables with zero estimates were removed as random slope effects from the final model, but were retained as fixed effects. Thus, the equation for the final model with random intercept and fixed slopes is as follows:
Level 1
 $$\eqalign{& y_{{\rm ij}}\; = \; \beta _{00}\; + \; \beta _{{\rm 1}0}{\rm X}_{ij}\; + \; \beta _{{\rm 2}0}{\rm X}_{ij}\; + \; \beta _{{\rm 3}0}{\rm X}_{ij}\; + \; \beta _{{\rm 4}0}{\rm X}_{ij}\; + \; \varepsilon _{ij} \cr & y_{{\rm ij}}\; = \; \beta _{00}\; + \; \beta _{{\rm 1}0}\left( {{\rm opioid misuse}} \right)_{ij}\; + \; \beta _{{\rm 2}0}\left( {{\rm depression symptom severity}} \right)_{ij}\; + \; \beta _{{\rm 3}0}\left( {{\rm opioid dose}} \right)_{ij}\; + \; \beta _{{\rm 4}0}\left( {{\rm pain severity}} \right)_{ij}\; + \; \varepsilon _{ij}} $$
Level 2
 $$\eqalign{& \beta _{0j}\; = \; \Upsilon _{00}\; + \; u_{0j} \cr & \beta _{{\rm 1}j}\; = \; \Upsilon _{{\rm 1}0} \cr & \beta _{{\rm 2}j}\; = \; \Upsilon _{{\rm 2}0} \cr & \beta _{{\rm 3}j}\; = \; \Upsilon _{{\rm 3}0} \cr & \beta _{{\rm 4}j}\; = \; \Upsilon _{{\rm 4}0}} $$
We then conducted a sensitivity analysis in which opioid use duration and depression symptom count were included in the model as covariates. We also examined the covariance between SHAPS scores and opioid misuse as a continuous variable (total COMM score).
Results
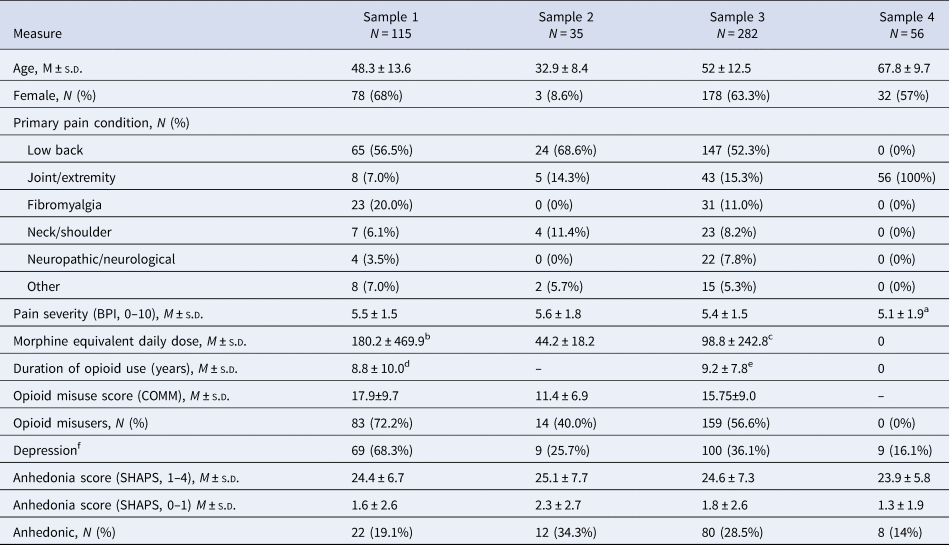
A total of 488 chronic pain patients were included across the four study samples (Table 1). The majority of patients were Caucasian; 60% (291) of patients were women. Across the three opioid-treated samples, the most commonly reported primary pain condition was low back pain (54.7%), followed by joint/extremity pain (12.9%), fibromyalgia pain (12.5%), neck/shoulder pain (10.2%), neuropathic/neurological (6.0%), and other (5.8%). The mean pain severity was 5.48 (s.d. = 1.51) out of 10, for which patients had taken opioids for an average of 9.10 (s.d. = 8.34) years. The average morphine equivalent daily dose was 100.14 (s.d. = 242.89) mg. The fourth, non-opioid treated sample consisted of patients referred for hip or knee replacement with mean pain severity of 5.1 ± 1.9. Approximately one in four of the chronic pain participants included were anhedonic according to Snaith et al.'s suggested cutoff for clinical anhedonia (reporting no projected enjoyment of three or more of the 14 items; sample 1: 19.1%; sample 2: 34.3%; sample 3: 28.5%, sample 4: 14%) (Snaith et al., Reference Snaith, Hamilton, Morley, Humayan, Hargreaves and Trigwell1995).
Demographic and clinical characteristics
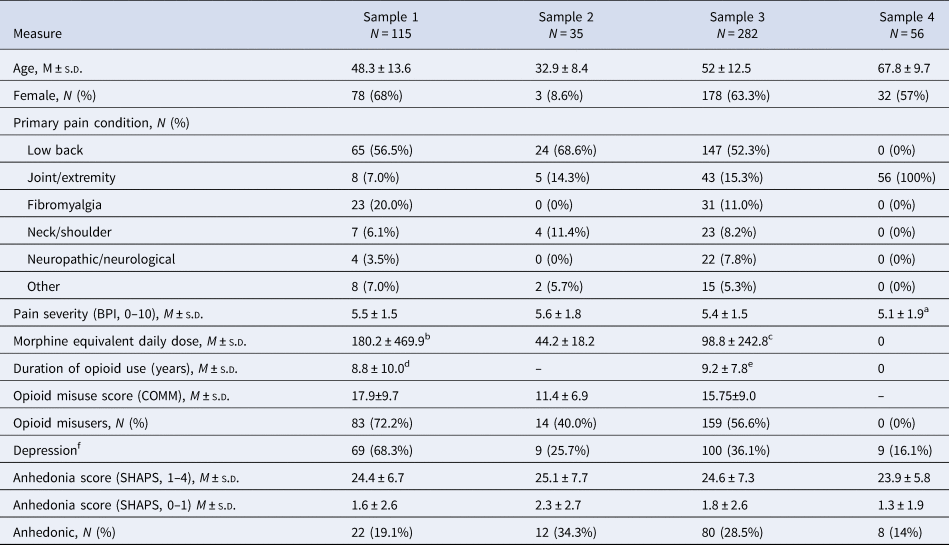
– = data missing;
a = due to missing data, n = 55;
b = due to missing data, n = 69;
c = due to missing data, n = 269;
d = due to missing data, n = 74;
e = due to missing data, n = 227;
f = N (%) major depressive disorder (sample 1−3); Beck depression inventory >13 (sample 4).
The 58 healthy samples included in the meta-analysis consisted of 2664 participants, 1484 (56%) of whom were women (Table 2). The mean ages of the healthy samples ranged from 13.04 to 70.60 with a weighted mean age of 31.4 (s.d. = 9.3). Compared to the healthy samples, the patient samples covered a considerably narrower mean age range (32.9–67.8) and consisted of older participants (M = 52.0, s.d. = 12.1, z = 35.0, p < 0.001, two-tailed). The proportion of female participants did not differ significantly between the patient group and the healthy group (z = 1.6, p = 0.11, two-tailed). To exclude any effects of age or gender differences on SHAPS scores, we performed additional meta-regressions to control for mean age and gender proportions.
Characteristics of healthy and patient groups

a Mean weighted by individual study Ns, pooled s.d..
Meta-analyses
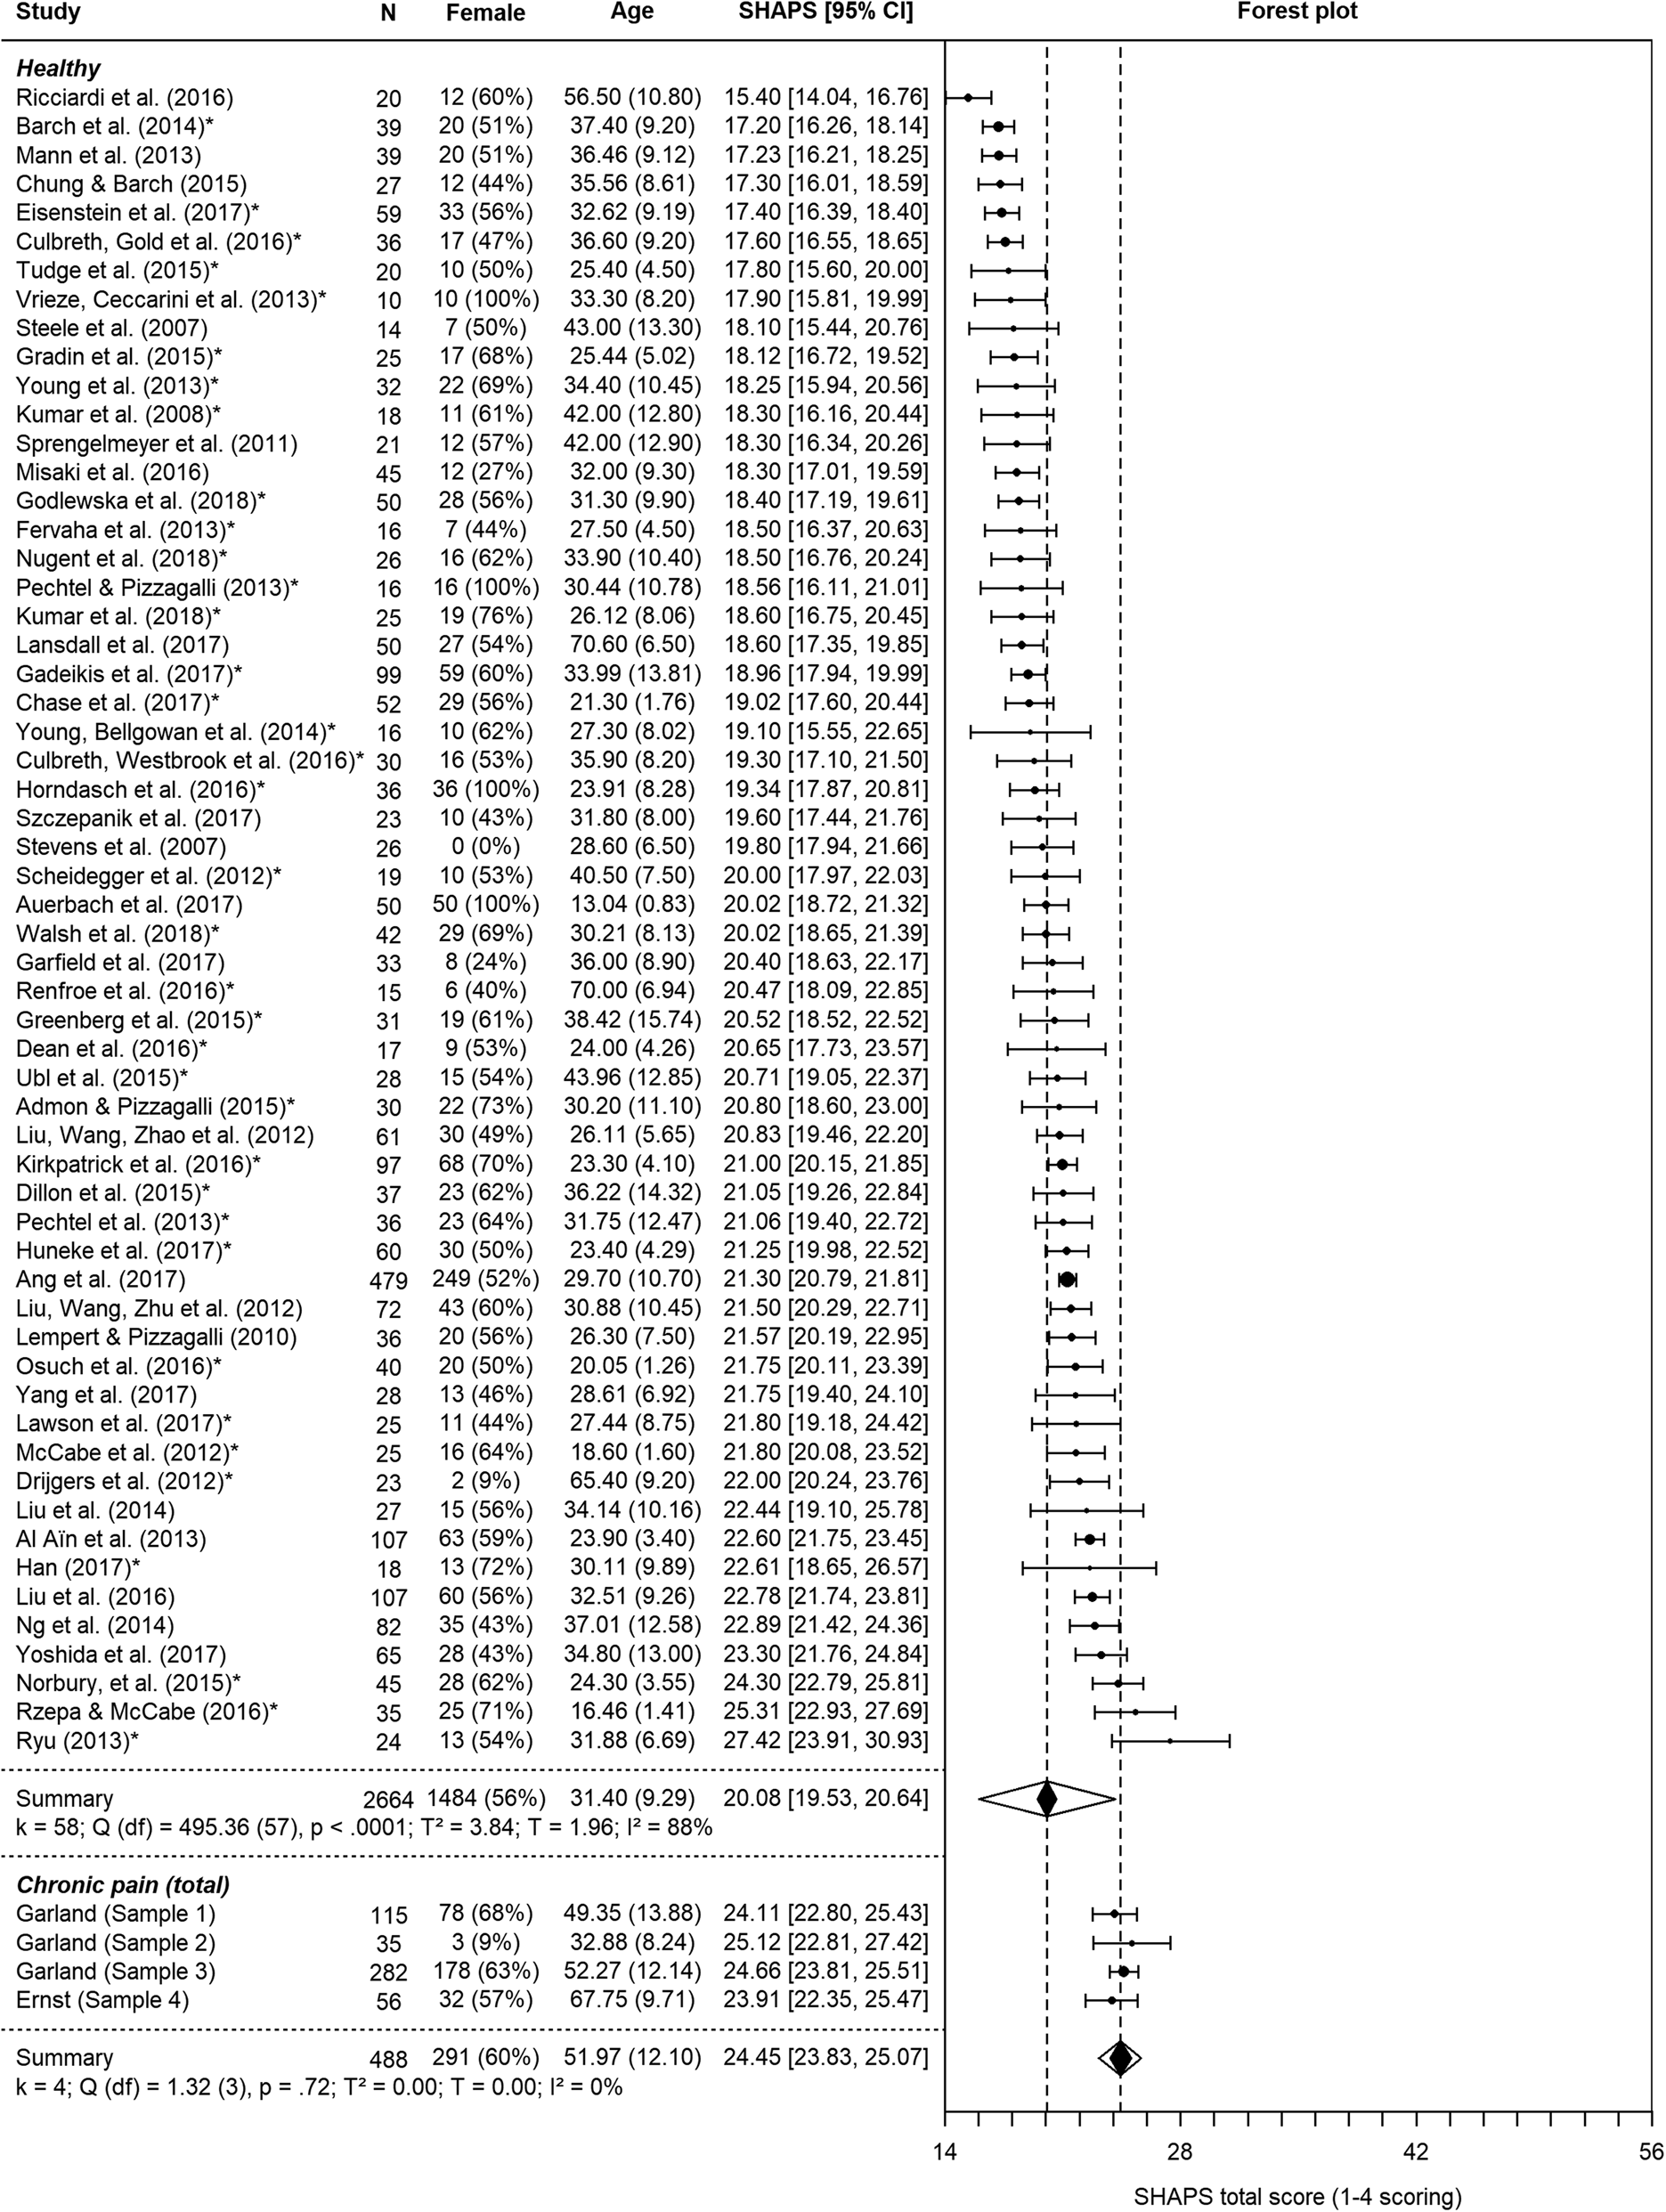
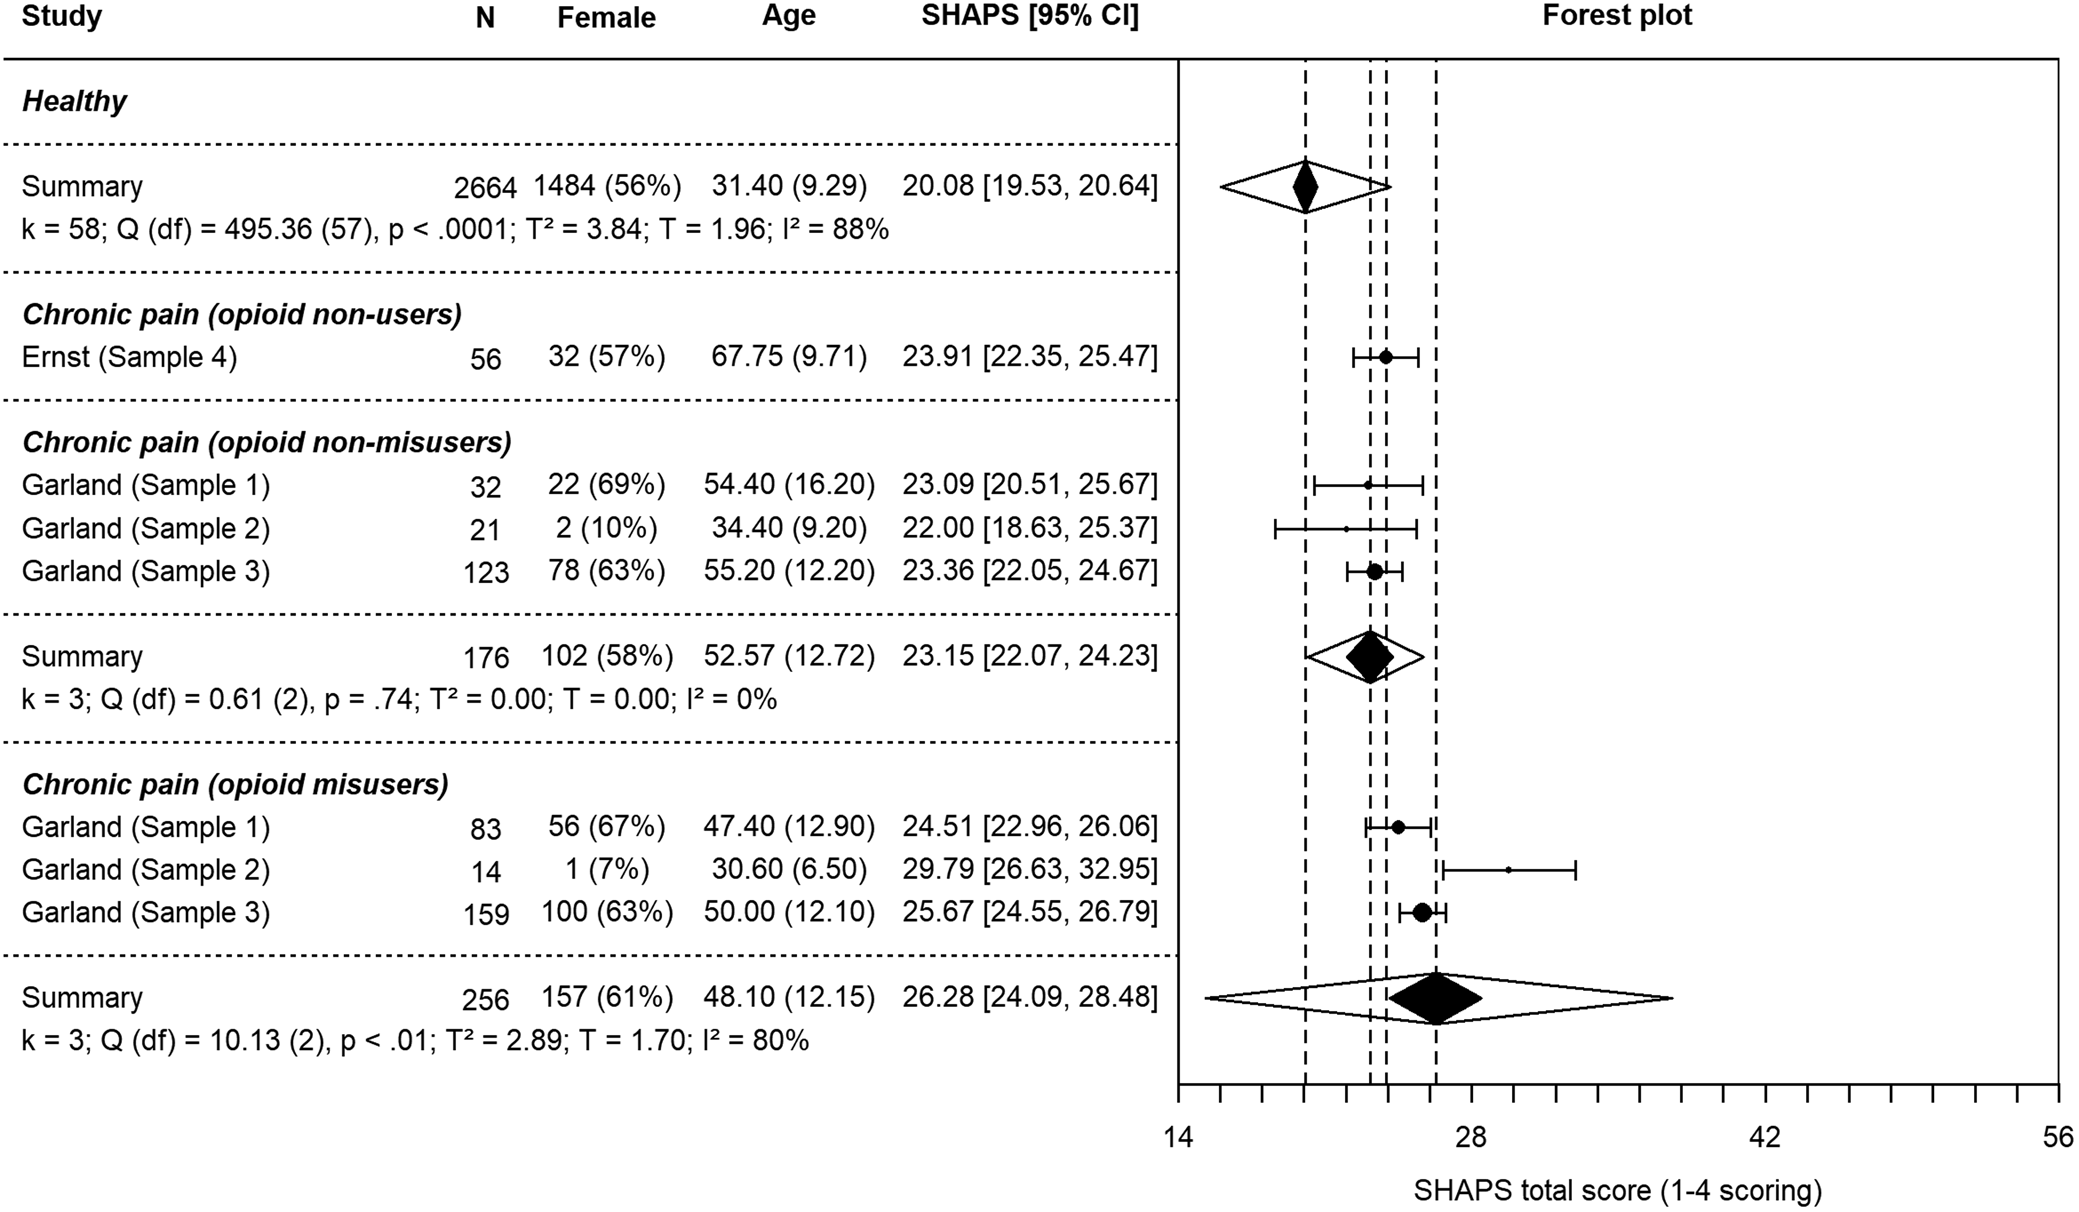
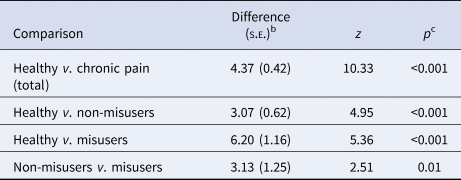
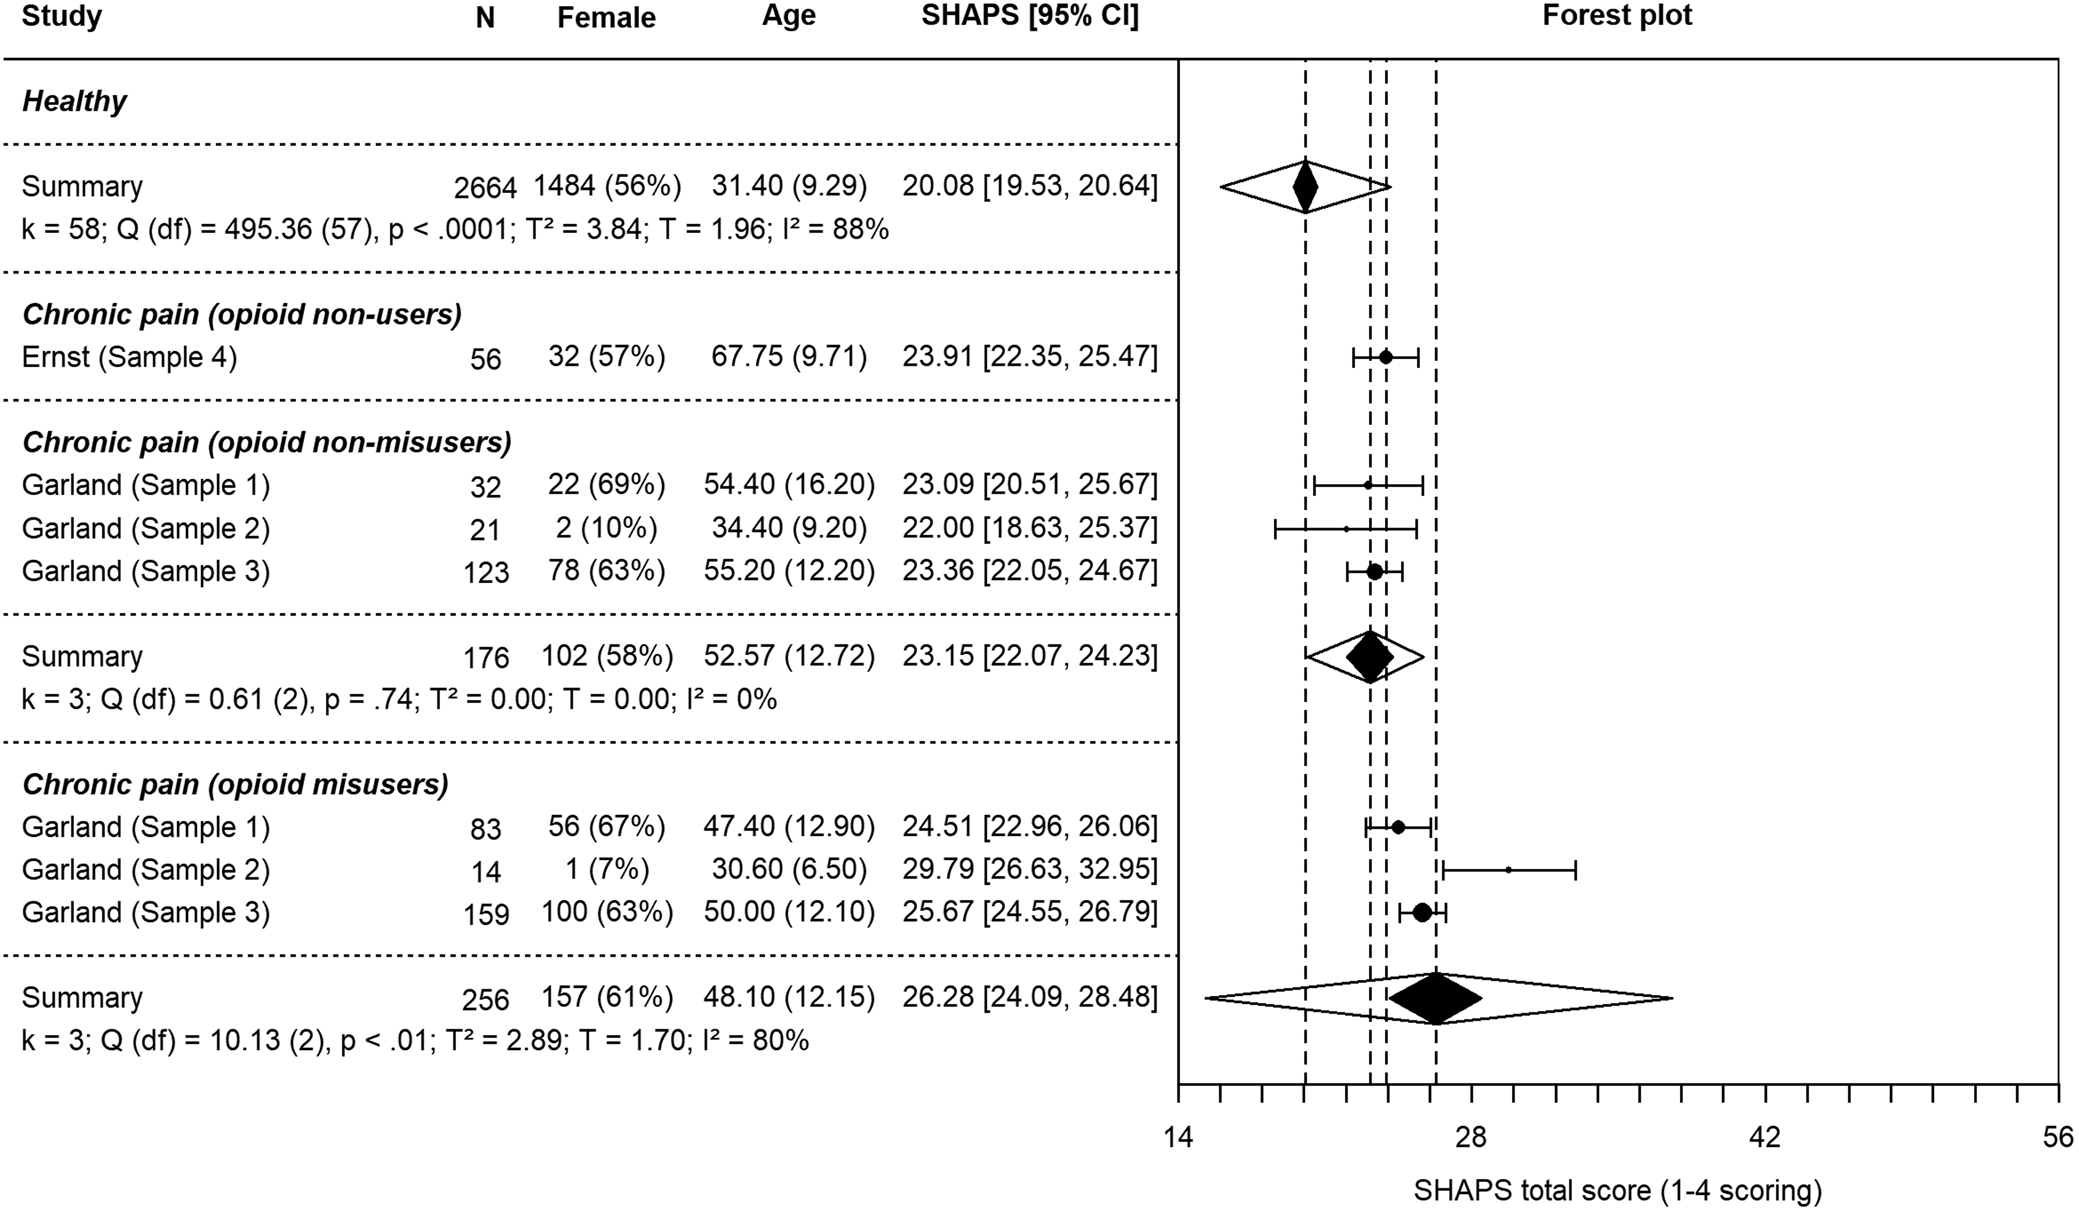
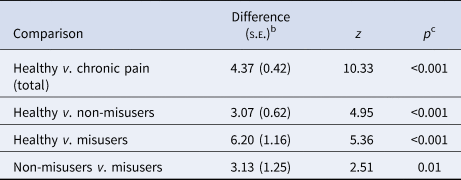
Random-effects models for each group and subgroup are presented in Table 3 (see also Fig. 1 and Fig. 2). Results from z-tests of difference in meta-analytic means are available in Table 4. Healthy participants yielded an average score of 20.08 (s.e. = 0.28) on the SHAPS. Pain patients' scores were significantly higher at 24.46 (s.e. = 0.32, p < 0.001, two-tailed). Opioid-treated, non-misusing pain patients displayed significantly higher anhedonia scores (M = 23.15, s.e. = 0.55) than healthy controls (p < 0.001, two-tailed). Patients who misused opioids showed the highest anhedonia scores (M = 26.28, s.e. = 1.12), which were significantly higher than those of non-misusers (p = 0.01, two-tailed).
Forest plot of individual study SHAPS scores and summary SHAPS scores based on separate random-effects models for healthy samples and patient samples. The dotted lines indicate the summary SHAPS score of each group. The black polygons indicate the summary SHAPS score and 95% confidence intervals (CIs) of each group while the transparent overlapping polygons indicate 95% prediction intervals (PIs) of each group. 95% CIs were calculated using critical t-values for individual studies and critical z-values for summary effects. The lack of overlap between CIs for healthy and pain groups indicate significant differences. T 2 is the estimate of the between-studies variance based on the DerSimonian and Laird (Reference DerSimonian and Laird1986) method. I 2 indicates the percentage of total variation in SHAPS scores across studies that is due to heterogeneity rather than chance (Higgins et al., Reference Higgins, Thompson, Deeks and Altman2003). Cochran's Q is used to test if there is variation in the observed study effects that cannot be explained by sampling error. Note. *Received missing data. Ricciardi et al. (Reference Ricciardi, Ferrazzano, Demartini, Morgante, Erro, Ganos, Bhatia, Berardelli and Edwards2016) used the SHAPS-C (modified for clinician administration; Ameli et al., Reference Ameli, Luckenbaugh, Gould, Holmes, Lally, Ballard and Zarate2014).

Forest plot of individual study SHAPS scores and summary SHAPS scores based on separate random-effects models for subsamples of chronic pain patients with and without opioid misuse. The summary SHAPS score for healthy samples is the same as in Fig. 1. The dotted lines indicate the summary SHAPS score of each group. The black polygons indicate the summary SHAPS score and 95% confidence intervals (CIs) of each group while the transparent overlapping polygons indicate 95% prediction intervals (PIs) of each group. 95% CIs were calculated using critical t-values for individual studies and critical z-values for summary effects. The lack of overlap between CIs for healthy and pain groups indicate significant differences. T 2 is the estimate of the between-studies variance based on the DerSimonian and Laird (Reference DerSimonian and Laird1986) method. I 2 indicates the percentage of total variation in SHAPS scores across studies that is due to heterogeneity rather than chance (Higgins et al., Reference Higgins, Thompson, Deeks and Altman2003). Cochran's Q is used to test if there is variation in the observed study effects that cannot be explained by sampling error.
Separate random-effects models for each group

a DerSimonian and Laird (Reference DerSimonian and Laird1986) estimator of between-studies variance. **p < 0.01, ***p < 0.001
Comparisons of SHAPS total scores under separate random-effects modelsa for each group
a DerSimonian andLaird (Reference DerSimonian and Laird1986) estimator of between-studies variance.
b On the same scale as the SHAPS.
c Two-tailed.
Prediction intervals
The range of the 95% prediction intervals (PIs) for the healthy group was 16.03–24.12, overlapping somewhat with the PI of the opioid-treated chronic pain patients (23.15–25.68). The non-misuser subgroup's 95% PI was 20.20–25.70, overlapping substantially with the misuser subgroup's PI which was 15.31–37.58.
Control analysis
Even when adjusting for age and gender, group type remained a significant predictor of SHAPS scores in the meta-regression (B Group = 5.28, s.e. = 1.09, z = 4.86, p < 0.001; B Age = −0.06, s.e. = 0.02, z = −2.39, p = 0.02; B % female = −0.02, s.e. = 0.01, z = −1.29, p = 0.20). This indicates that whereas the chronic pain samples on average have SHAPS scores 5.28 points higher than healthy samples, an increase in average sample age of one year corresponds to a 0.06-point decrease in SHAPS scores, i.e. a negligible effect of age and gender distribution.
Sensitivity analysis of meta-analysis
To assess whether the results were dependent on our choice of the DerSimonian–Laird method for estimating the between-studies variance (i.e. T 2), we repeated all the above meta-analyses using other recommended τ 2 estimators for continuous data, including the restricted maximum likelihood (REML) and Paule–Mandel (PM) methods (Veroniki et al., Reference Veroniki, Jackson, Viechtbauer, Bender, Bowden, Knapp, Kuss, Higgins, Langan and Salanti2016). The results from these analyses were fully consistent with those reported above.
Analysis of individual SHAPS items
Mean item-level scores ranged from 1.44 to 2.2 (online Supplementary Fig. 1 and Supplementary Table 1). This constricted range indicated comparable levels of anhedonia across different types of rewards (i.e. generalized anhedonia), rather than anhedonia in response to a specific type of reward.
Analysis of variance within chronic pain samples
Sample 1–3
In zero-order correlations, anhedonia scores were positively correlated with depression symptom count (r = 0.26, p < 0.001) and shared ~7% of common variance, but were not significantly associated with opioid use duration (r = 0.05, p = 0.44; sample 3 only), opioid dose (r = 0.09, p = 0.13), or pain severity (r = 0.09, p = 0.08).
To assess whether anhedonic symptoms are greater in opioid-treated patients classified as misusers compared to those classified as non-misusers after controlling for individual differences in pain severity, MDD diagnosis, and opioid dose, we computed a mixed model (online Supplementary Table 2). As an estimate of clustering by sample study, in the unconditioned model, the ICC was <0.00001. Although we specified a random intercept for sample number, model convergence criteria were not met because random intercept covariance estimates were zero, indicating that the model was unable to uniquely estimate any variation from sample to sample above and beyond the residual variance from individual to individual. Thus, the random intercept was dropped from the model. In this model (model 1), neither pain severity, MDD diagnosis, nor opioid dose significantly predicted anhedonia, whereas opioid misuse status remained a significant predictor of anhedonia (B = 3.12, s.e. = 0.88, p < 0.001). The final model indicated that after controlling for pain severity, MDD diagnosis, and opioid dose, misusers continued to exhibit significantly higher anhedonia (M = 26.29, s.e. = 0.56) than non-misusers (M = 23.17, s.e. = 0.65).
We next computed a mixed model in which COMM opioid misuse scores were entered as a continuous independent variable. In this model, the covariance parameter of the sample as random intercept was nonzero, and so the random intercept was retained to account for clustering. This model (model 2) indicated that after controlling for pain severity, MDD diagnosis, and opioid dose, higher COMM scores predicted greater anhedonia, B = 0.15, s.e. = 0.05, p < 0.001. We then computed the same model using a continuous measure of depression symptom count (current and worst episode) instead of MDD diagnosis. In this model (model 3), depression symptom count (B = 0.20, s.e. = 0.08, p = 0.02) and opioid misuse scores (B = 0.11, s.e. = 0.05, p = 0.03) also significantly predicted anhedonia, whereas pain severity and opioid dose did not. As a final sensitivity analysis (model 4), we added opioid use duration to the set of covariates above. In this model, depression symptom count was the strongest predictor (B = 0.37, s.e. = 0.09, p < 0.001), but opioid use duration (B = 0.01, s.e. = 0.004, p = 0.036) and opioid misuse status (B = 2.14, s.e. = 1.00, p = 0.034) also significantly predicted anhedonia, whereas pain severity and opioid dose did not. Also, we examined whether anhedonia levels differed by primary pain condition, but neither the omnibus F-test nor any of the uncorrected pairwise contrasts were significant.
Sample 4
In sample 4, anhedonia correlated significantly with depression severity as measured by BDI scores (r = 0.50, p < 0.01) but not with pain severity (BPI; r = 0.07, p = 0.61).
Discussion
Here we demonstrate that individuals with chronic pain report significantly greater levels of anhedonia than a meta-analytically derived large sample of healthy controls. Moreover, across three opioid-treated chronic pain samples, anhedonic symptoms were significantly greater in patients classified as opioid misusers compared to those classified as non-misusers. The association between opioid misuse and anhedonia remained significant after controlling for individual differences in pain severity, depression, opioid dose and duration of opioid treatment. To our knowledge, this is the first report in the scientific literature to document that opioid misusers with chronic pain exhibit elevated symptoms of anhedonia. Although opioid misusers demonstrated the highest levels of anhedonia, scores in opioid users with chronic pain were not higher than anhedonia scores in a fourth chronic pain sample without regular opioid use, consistent with the view that anhedonia may stem from chronic pain and opioid misuse, but not from regulated use of opioid analgesics, per se.
Chronic pain has been linked to disrupted reward processing in both humans (Baliki et al., Reference Baliki, Geha, Fields and Apkarian2010, Geha et al., Reference Geha, deAraujo, Green and Small2014, Loggia et al., Reference Loggia, Berna, Kim, Cahalan, Gollub, Wasan, Harris, Edwards and Napadow2014) and rodents (Schwartz et al., Reference Schwartz, Temkin, Jurado, Lim, Heifets, Polepalli and Malenka2014, Thompson et al., Reference Thompson, Pitcher, Stone, Tarum, Niu, Chen, Kiesewetter, Schweinhardt and Bushnell2018). Despite this evidence and the high comorbidity between chronic pain and depression, little data exists on the hedonic capacity of chronic pain patients. Initial findings indicated modestly increased physical anhedonia symptoms for arthritic pain patients (Marbach and Lund, Reference Marbach and Lund1981, Marbach et al., Reference Marbach, Richlin and Lipton1983). Here, we extend these findings and show modest, but significant increases in anhedonia scores in four diverse chronic pain samples. Though presence v. absence of major depressive disorder diagnosis was not significantly associated with anhedonia, depression symptom severity (measured continuously) was a significant yet modest contributor to the relationship between chronic pain and anhedonia, replicating Marbach et al.'s results across chronic pain groups. Thus, anhedonia in chronic pain cannot be explained by comorbid depression only. Other mechanisms linking chronic pain and anhedonia include disrupted endogenous opioid signaling (Harris et al., Reference Harris, Clauw, Scott, McLean, Gracely and Zubieta2007, Martikainen et al., Reference Martikainen, Peciña, Love, Nuechterlein, Cummiford, Green, Harris, Stohler and Zubieta2013, Thompson et al., Reference Thompson, Pitcher, Stone, Tarum, Niu, Chen, Kiesewetter, Schweinhardt and Bushnell2018), changes to mesolimbic signaling (Baliki et al., Reference Baliki, Geha, Fields and Apkarian2010; Loggia et al., Reference Loggia, Berna, Kim, Cahalan, Gollub, Wasan, Harris, Edwards and Napadow2014; Reference Schwartz, Miller and FieldsSchwartz et al., Schwartz et al. Reference Schwartz, Temkin, Jurado, Lim, Heifets, Polepalli and Malenka2014), prefrontal areas (Rodriguez-Raecke et al., Reference Rodriguez-Raecke, Niemeier, Ihle, Ruether and May2009, Seminowicz et al., Reference Seminowicz, Wideman, Naso, Hatami-Khoroushahi, Fallatah, Ware, Jarzem, Bushnell, Shir, Ouellet and Stone2011), or the interaction between these circuits (Lee et al., Reference Lee, Manders, Eberle, Su, D'amour, Yang, Lin, Deisseroth, Froemke and Wang2015), and changes in attention (Crombez et al., Reference Crombez, Eccleston, Baeyens and Eelen1996, Stefaan Van et al., Reference Stefaan Van, Geert and Jürgen2007).
A majority of the chronic pain samples included in this study were treated with opioids. Pain conditions like neuropathic pain and fibromyalgia have been associated with reduced opioid receptor availability in the absence of opioid pharmacotherapy, however (Harris et al., Reference Harris, Clauw, Scott, McLean, Gracely and Zubieta2007, Martikainen et al., Reference Martikainen, Peciña, Love, Nuechterlein, Cummiford, Green, Harris, Stohler and Zubieta2013, Thompson et al., Reference Thompson, Pitcher, Stone, Tarum, Niu, Chen, Kiesewetter, Schweinhardt and Bushnell2018). Accordingly, it is likely that chronic pain can cause anhedonia symptoms independently of opioid medication. Indeed, anhedonia scores were comparable between opioid treated samples and our non-user sample. Also, in the opioid-treated samples we found no significant association between opioid dose and anhedonia scores. Similarly, duration of opioid treatment, although a significant predictor, did not explain much variance in the data. Meeting criteria for opioid misuse, on the other hand, was associated with significantly greater anhedonia than healthy samples and non-misusing chronic pain patients. These findings are consistent with psychophysiological data from experiments involving opioid-treated chronic pain samples, showing reduced attentional and autonomic responses to rewarding stimuli in opioid misusers compared to non-misusers (Garland et al., Reference Garland, Froeliger and Howard2015a; Garland et al., Reference Garland, Bryan, Nakamura, Froeliger and Howard2017).
Interestingly, the mean anhedonia scores of opioid misusing pain patients were comparable with the scores reported for patients with opioid use disorder (Stevens et al., Reference Stevens, Peschk and Schwarz2007; Zijlstra et al., Reference Zijlstra, Veltman, Booij, van den Brink and Franken2009; Garfield et al., Reference Garfield, Cotton, Allen, Cheetham, Kras, Yücel and Lubman2017) and other substance use disorders (Franken et al., Reference Franken, Rassin and Muris2007). While anhedonia symptoms in SUD and chronic pain samples are substantially lower than those observed in patients with current MDD, the standardized effect sizes in these previous studies have been large (Franken et al., Reference Franken, Rassin and Muris2007; Stevens et al., Reference Stevens, Peschk and Schwarz2007; Garfield et al., Reference Garfield, Cotton, Allen, Cheetham, Kras, Yücel and Lubman2017). Chronic opioid misuse is hypothesized to increase neurobiological sensitization to aversive stimuli (i.e. stress and pain) coupled with decreased neural responsiveness to non-drug rewards (Shurman et al., Reference Shurman, Koob and Gutstein2010). This allostatic shift in reward set points is thought to result in anhedonia and a dwindling sense of subjective well-being that in turn compel dose escalation as a means of preserving hedonic equilibrium (Koob and Le Moal, Reference Koob and Le Moal2001, Koob and Le Moal, Reference Koob and Le Moal2008). Ironically, by virtue of the allostatic process increased consumption of opioids may lead to hyperalgesia (Arout et al., Reference Arout, Edens, Petrakis and Sofuoglu2015), tolerance (Christie, Reference Christie2008), and emotion regulation deficits (Garland et al., Reference Garland, Bryan, Nakamura, Froeliger and Howard2017). These changes could, in turn, exacerbate anhedonia and drive the downward spiral of behavioral escalation linking chronic pain to prescription opioid misuse (Garland et al., Reference Garland, Froeliger, Zeidan, Partin and Howard2013).
To be clear, cross-sectional studies cannot determine whether anhedonia is the result of long-term opioid misuse and/or chronic pain. Alternatively, premorbid depression and hedonic dysfunction might increase the risk for developing chronic pain and/or opioid misuse by compelling use of opioids for relief of negative affect. A recent study in college students reported significantly higher SHAPS scores in non-medical opioid users compared to non-drug using students which was unchanged at 1 year follow-up (Meshesha et al., Reference Meshesha, Pickover, Teeters and Murphy2017). If anhedonia is a risk mechanism undergirding the comorbidity of chronic pain opioid misuse, then interventions that aim to remediate anhedonia may be especially therapeutic for opioid misusing chronic pain patients. In that regard, a behavioral intervention that integrates mindfulness with training in savoring hedonic pleasure from natural reinforcers, Mindfulness-Oriented Recovery Enhancement (MORE), has decreased chronic pain severity and opioid misuse in two RCTs (Garland et al., Reference Garland, Manusov, Froeliger, Kelly, Williams and Howard2014b; Garland et al., Reference Garland, Hanley, Riquino, Reese, Baker, Salas, Yack, Bedford, Bryan, Atchley, Nakamura, Froeliger and Howard2019) – effects associated with increased autonomic and neurophysiological responsiveness to natural rewards (Garland et al., Reference Garland, Froeliger and Howard2014a, Reference Garland, Froeliger and Howard2015b). It remains to be seen if MORE or other (behavioral or pharmacological) interventions can modulate subjective symptoms of anhedonia in this population.
Some methodological aspects warrant consideration. The present study compared pain samples with meta-analytically derived data from more than 2600 healthy participants tested previously in a variety of settings, countries and spanning diverse age groups. This approach is arguably better suited to generate generalizable results than the inclusion of a single control group. Importantly, the meta-analytical approach also allowed us to calculate prediction intervals (PIs) for each group. The 58 healthy samples exhibited considerable heterogeneity, as reflected in the PI, which showed overlap with the chronic pain PI. This overlap indicates that some inconsistent results can be expected in future studies comparing anhedonia in chronic pain to healthy samples. Also, the chronic pain samples included here may have differed from the healthy control samples on unmeasured psychosocial variables plausibly linked with anhedonia like socioeconomic status, marital status, and urbanity v. rurality. Future studies should attempt to control for a broader range of potential confounders. Whilst there were systematic differences between our chronic pain samples and healthy samples in terms of age distribution, control meta-regressions showed that age and gender could not explain the reported differences in anhedonia between groups.
Study results were based on self-report of agreement with a series of hypothetical everyday rewards. Though anhedonia questionnaires tap into respondents' capacity for pleasure, responses may also be shaped by their ability to remember and/or predict pleasure. A benefit of questionnaires compared to laboratory reward tests is the ability to assess a large range of rewards and contexts. A promising avenue for future, ecologically-valid research on anhedonia is to combine questionnaires and lab tests with experience sampling.
Ultimately, an intact hedonic function is fundamental to the preservation of subjective well-being. Insofar as hedonic experience reflects optimization of internal homeostatic balance, it is sensitive to perturbations to bodily integrity. Classical philosophical accounts have posed pain in contradistinction to pleasure. Nevertheless, these two opposing phenomena are modulated by similar neurochemical processes, notably mu-opioids (Leknes and Tracey, Reference Leknes and Tracey2008). Here, we show that chronic pain patients exhibit higher symptoms of anhedonia than healthy people. Reduced hedonic capacity was most pronounced in pain patients also reporting misuse of opioid medications. In sum, our data are consistent with the interpretation that both chronic pain and opioid misuse contribute to anhedonia.
Supplementary material
The supplementary material for this article can be found at https://doi.org/10.1017/S0033291719002010
Acknowledgements
This work was supported by supported by R01DA042033, R34DA037005, and R03DA032517 (PI: Garland) from the National Institute on Drug Abuse. The content is solely the responsibility of the authors and does not necessarily represent the official views of the National Institutes of Health. The authors declare no conflicts of interest with respect to the research contained herein. We are thankful to Kongsberg hospital's orthopedic ward nurses for data collection.
Conflict of interest
None.