


Introduction
Titanium oxide (TiO2) is a widely used semiconductor presenting some advantages because of its optical and electrical properties, non-toxicity, chemical stability, and low production cost. Fujishima and Honda[Reference Fujishima and Honda1] proposed its usage as a photocatalyst using ultraviolet (UV) irradiation but its application has been limited due to its wide band gap (E g: 3.0–3.2 eV). Moreover, TiO2 has a very low photo-quantum yield due to the easy recombination of excited electrons. However, it is possible to decrease the value of its E g and increase its photo-quantum yield by doping it with appropriate elements.
The doping of TiO2 with vanadium (V) increases its photocatalytic efficiency and makes it more active in the visible light spectrum.[Reference Wu and Chen2, Reference Klosek and Raftery3] Different methods have already been used to synthesize V-doped TiO2 catalysts: immersion in an NH4VO3 solution,[Reference Zhou, Liu, Zhu and Zhang4] sol–gel[Reference Wu and Chen2, Reference Sene, Zeltner and Anderson5], and controlled hydrolysis of tetrabutyl titanate in a V ion solution.[Reference Gu, Yang and Hu6] These techniques are all relatively complex and not appropriate for industrial applications.
In this paper, we report on a novel and much simpler method to synthesize V-doped TiO2 nanoparticles (NPs) for its usage as a visible light-driven semiconductor. In a first step, a vanadyl oxalate solution (VOC2O4) was prepared from oxalic acid (H2C2O4) and vanadium pentoxide (V2O5). In a second step, the products were annealed at 400 °C in ambient air. The E g for TiO2 was red-shifted by about 0.5 eV, which is encouraging.
Materials and methods
Commercial V2O5 microparticles were dissolved in H2C2O4 to produce a 0.10 M VOC2O4 solution. All chemicals were purchased from Sigma-Aldrich Company. This solution was kept at a temperature of 50 °C and stirred for 24 h. A clear blue VOC2O4 solution (the color is due to the presence of V4+ ions) was obtained according to the reaction
 $${\rm V}_ 2 {\rm O}_ 5 +3\, {\rm H}_ 2 {\rm C}_ 2 {\rm O}_ 4 \to 2\, {\rm VOC}_ 2 {\rm O}_ 4 +2\, {\rm CO}_ 2 +3\, {\rm H}_ 2 {\rm O}$$
0.080 g (0.001 mole) of TiO2 NPs (purchased from Degussa-Evonik; P25) were added to 10 mL of the VOC2O4 solution. The Ti:V ratio was varied, 1:1, 2:1, and 8:1, using VOC2O4 solutions 0.1, 0.05, and 0.0125 M, to produce three samples: TV11, TV21, and TV81, respectively. All samples were dried in air in an oven at 60 °C after a 10 min ultrasonication. A 90 min annealing at 400 °C was applied to the powders using a tube furnace (Lindberg/Blue M Mini-Mite™) under atmospheric condition. The ramp rate was set at 10 °C/min. The annealed samples were ultrasonicated, washed with water, and centrifuged several times with warm (50 °C) water. The water used was pure and deionized.
The samples were examined using a field-emission scanning electron microscope (SEM, JEOL JSM-7500F) and a high-resolution transmission electron microscope (HRTEM, JEOL JEM-2200FS, operated at 200 kV) by placing the materials onto ultra-thin carbon support TEM copper grids. X-ray energy-dispersive spectrometry (XEDS) in the HRTEM was used to determine the elemental compositions of the samples. Selected area electron diffraction (SAED) and powder x-ray diffraction (XRD) were employed to determine the phase(s) present. Electron energy-loss spectra (EELS) were recorded in the TEM using the in-column energy filter.
Results and discussion
One x-ray diffractogram recorded from sample TV21 is shown in Fig. 1. All peaks were indexed to the rutile and anatase phases of TiO2 according to the JCPDS card numbers 89-4920 and 89-4203, respectively. The major phase was anatase. This commercial P25 TiO2 powder consists of about 73–85% anatase, 14–17% rutile, and 0–18% amorphous TiO2.[Reference Ohtani, Prieto-Mahaney, Li and Abe7] XRD recorded from samples TV11 and TV81 were the same. No V peaks were observed.
XRD recorded from sample TV21 after annealing at 400 °C. It is indexed to anatase (red) and rutile (black).

One HRTEM and one TEM images recorded from sample TV21 are displayed in Figs. 2(a) and 2(b). Particles were about 10–30 nm. XEDS recorded in the TEM [Fig. 2(b)] showed the materials to be composed of only elements Ti, O, and V. The copper (Cu) and carbon (C) peaks were generated by the TEM support grid. Figure 2(a) shows one HRTEM image recorded from sample TV21. The lattice planes of two adjacent particles corresponding to the anatase and rutile phases of TiO2 are labeled: {101}anatase and {111}rutile with spacings of 0.35 and 0.22 nm, respectively. In Figs. 2(c) and 2(d), two EEL spectra recorded from few particles of sample TV21 around the Ti L2,3, O K, and V L2,3 edges are shown. The presence of V in the structure of TiO2 was confirmed, in agreement with XEDS. The Energy-Loss Near-Edge Structure (ELNES) at the O K-edge in transition metal oxides is due to the crystal-field splitting of the Ti 3d orbital into e g and t 2g components, creating a double-peak signature.[Reference McComb8] The two peaks in the O K-edge (1.2 and 3.4 eV) were separated (Δ1–2) by 2.3 eV. The observations were similar for non-doped TiO2 NPs.
Data recorded from V-doped NPs (sample TV21). (a) HRTEM image. Several particles are seen in the image and the {101} and {111} lattice planes corresponding to anatase and rutile are indicated. (b) XEDS confirmed the presence of V. A low magnification TEM image is displayed. (c and d) EEL spectra recorded around the Ti L2,3, O K, and V L2,3 edges.
V2O5 NPs can also be obtained by heating VOC2O4 to temperatures higher than 353 °C in ambient air.[Reference Pan, Zhang, Nie, Cao, Arey, Li, Liang and Liu9] Annealing at 400 °C produced V2O5 NPs. TEM, HRTEM images, and the corresponding SAED pattern along with one EEL spectrum are displayed in ESI (supplementary Figure S1).
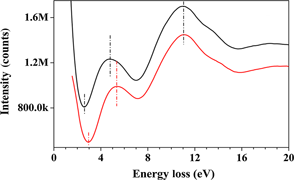
EEL spectra were also recorded in the low-loss region, from the zero-loss peak up to including the Ti M2,3 edge. Peaks above 20.0 eV are not assigned to valence bands spectra.[Reference Fischer10]Figure 3 shows two spectra recorded from few non-doped and few V-doped TiO2 NPs (same sample TV21). Six peaks for non-doped TiO2 were identified at positions: 5.4, 11.1, 13.8, 18.6, 25.2, and 39.9 eV. The peaks prior the Ti M2,3 edge are primarily associated with collective excitations from the valence bands to the conduction bands. The peak at ~26.0 eV was due to the presence of carbon (the 3–5 nm ultra-thin carbon support of the TEM grid). The V M2,3 edge (~50 eV) and low-energy loss peaks of V (~20 eV) had too small signal-to-noise ratios to be visible (background and very low concentration of V). Spectra were similar for doped and non-doped TiO2, with the exception of a shift to lower energy for the first peak (4.8 eV). The measured E g for pure TiO2 NPs was ~3.1 eV using the McComb's extrapolation method, which is in good agreement with the reported values of 3.06 and 3.20 eV for rutile and anatase, respectively.[Reference Pascual, Camassel and Mathieu11, Reference Sanjines, Tang, Berger, Gozzo, Margaritondo and Levy12] Note that the TiO2 powder used in this study contained both phases, the major phase being anatase. Following the same methodology, the E g for sample TV21 was measured to ~2.6 eV. Therefore, the V-doping was responsible for a reduction of approximately 0.5 eV which is significant (about 20%). The reduction we achieved is 2.5 times greater than previously reported (0.19 eV).[Reference Sene, Zeltner and Anderson5]
(a) EEL spectra recorded from few non-doped and few V-doped TiO2 NPs (sample TV21) near the zero loss peak. (b) Higher resolution spectra.
UV/Vis absorption spectra recorded from pure TiO2 and sample TV21 (both with the same concentration of TiO2 particles) are shown in Figure 4. The UV/Vis spectrum obtained from pure P25 NPs had lower intensity than that of sample TV21. Sample TV21 displayed a sharp absorbance peak about 350 nm (corresponding to 3.54 eV) and a visible light absorption shoulder. This peak can be assigned to the 2t*2g orbital components. By ignoring the electron correlation effects and assuming that the transition from g to g orbital components is forbidden, the observed peak is the result of the electron excitation from 2t 2u occupied orbitals to the unoccupied anti-bonding components 2t*2g corresponding to 350 nm photons. A red shift to the visible light (λ > 390 nm) was observed (absorption threshold is about 700 nm) when the NPs were V-doped (e.g., sample TV21) which is in agreement with EELS observations. Our results show that a relatively high absorption was achieved when compared with already published data; e.g., using the sol–gel technique.[Reference Zhou, Liu, Zhu and Zhang4]
UV/Vis absorption spectra recorded from pure TiO2 and V-doped TiO2 (TV21) NPs (same concentration and same scale).
Conclusions
V-doped TiO2 NPs were successfully synthesized using a simple, inexpensive, and facile method. XEDS and EELS confirmed the presence of V in the TiO2. The E g was decreased by about 0.5 eV. UV/Vis showed an increase in photon absorption in the visible light region. This catalyst can therefore be used in the visible light spectral range. Future work will focus on testing this material as a photocatalyst in the visible light.
Supplementary materials
For supplementary material for this article, please visit http://dx.doi.org/10.1557/mrc.2014.15
Acknowledgments
The partial support from the NSEC Center for Hierarchical Manufacturing at the University of Massachusetts (National Science Foundation award no. 1025020) is gratefully acknowledged. We also acknowledge the NSF for its support (award no. 0701525) to the Nanoscopy Facility, an electron microscopy facility at UPR.



