Introduction
Nearly one in ten infants in the US is born prematurely (Matthews, MacDorman, & Thoma, Reference Matthews, MacDorman and Thoma2015; Purisch & Gyamfi-Bannerman, Reference Purisch and Gyamfi-Bannerman2017), a rate that has not improved since the early 1990s. Neonates born at extremely low birth weight (ELBW; ≤1000 g) are the smallest and most at risk. For infants born preterm, early postnatal life entails profound duress in the form of ongoing separation from the mother, the loss of protection from physical injury and pathogens, and the administration of life-saving but stressful medical procedures. During childhood, individuals born at ELBW are significantly more likely than their peers born at normal birth weight (NBW; ≥ 2500 g) to exhibit physical disabilities (Behrman & Butler, Reference Behrman and Butler2007; Frey & Klebanoff, Reference Frey and Klebanoff2016), motor coordination problems (e.g., Saigal et al., Reference Saigal, Stoskopf, Boyle, Paneth, Pinelli, Streiner and Goddeeris2007), attention deficits (e.g., Anderson et al., Reference Anderson, De Luca, Hutchinson, Spencer-Smith, Roberts and Doyle2011), low cognitive scores (e.g., Twilhaar, de Kieviet, Aarnoudse-Moens, van Elburg, & Oosterlaan, Reference Twilhaar, de Kieviet, Aarnoudse-Moens, van Elburg and Oosterlaan2018), and socio-communicative and emotional difficulties (e.g., Hack et al., Reference Hack, Taylor, Schluchter, Andreias, Drotar and Klein2009; Johnson et al., Reference Johnson, Hollis, Kochhar, Hennessy, Wolke and Marlow2010). In adulthood, ELBW survivors remain at higher risk than term-born adults for attention problems (Halmøy, Klungsøyr, Skjærven, & Haavik, Reference Halmøy, Klungsøyr, Skjærven and Haavik2012), cognitive limitations (Lefebvre, Mazurier, & Tessier, Reference Lefebvre, Mazurier and Tessier2005), some forms of psychopathology (e.g., anxiety/depression; Boyle et al., Reference Boyle, Miskovic, Van Lieshout, Duncan, Schmidt, Hoult and Saigal2011; Johnson & Marlow, Reference Johnson and Marlow2014; Mathewson et al., Reference Mathewson, Chow, Dobson, Pope, Schmidt and Van Lieshout2017; Van Lieshout, Boyle, Saigal, Morrison, & Schmidt, Reference Van Lieshout, Boyle, Saigal, Morrison and Schmidt2015), and early development of chronic health conditions (e.g., Luu, Katz, Leeson, Thébaud, & Nuyt, Reference Luu, Katz, Leeson, Thébaud and Nuyt2016; Saigal et al., Reference Saigal, Day, Van Lieshout, Schmidt, Morrison and Boyle2016). While small size at birth may not cause these problems, birth size reflects the interaction of the fetal genome with the fetal environment and is considered a rough proxy for the quality of intrauterine conditions (Gluckman & Hanson, Reference Gluckman and Hanson2004a, Reference Gluckman and Hanson2004b; Lester, Marsit, Conradt, Bromer, & Padbury, Reference Lester, Marsit, Conradt, Bromer and Padbury2012).
Developmental programming: Effects of early adversity
Fetal programming theories, such as the developmental origins of health and disease hypothesis (DOHaD; Gluckman & Hanson, Reference Gluckman and Hanson2004a, Reference Gluckman and Hanson2004b), have been proposed to account for associations between environmental conditions in very early life and later life health outcomes. Specifically, environmental factors present during the periconceptual and perinatal periods are thought to influence an individual's long-term developmental trajectory (Gluckman & Hanson, Reference Gluckman and Hanson2004a, Reference Gluckman and Hanson2004b; Gluckman, Hanson, & Buklijas, Reference Gluckman, Hanson and Buklijas2010). The conceptual basis for such adaptation is developmental plasticity, defined as the ability of an organism to develop in different ways, depending on environmental conditions (Gluckman, Hanson, Cooper, & Thornburg, Reference Gluckman, Hanson, Cooper and Thornburg2008). Adaptations create a biological “record” of the quality of the perinatal environment, in the form of stable changes in physiology and gene expression (Shonkoff, Boyce, & McEwen, Reference Shonkoff, Boyce and McEwen2009; Szyf & Bick, Reference Szyf and Bick2013; Thompson & Einstein, Reference Thompson and Einstein2010). Fetal adaptations to poorer intrauterine conditions affect morphology (e.g., reduced numbers of nephrons in the fetal kidney; Black et al., Reference Black, Sutherland, Gubhaju, Kent, Dahlstrom and Moore2013), endocrine (e.g., Moisiadis & Matthews, Reference Moisiadis and Matthews2014) and autonomic (e.g., Zeskind & Gingras, Reference Zeskind and Gingras2006) regulatory systems, and fetal (e.g., Murgatroyd & Spengler, Reference Murgatroyd and Spengler2011) and placental (e.g., Jansson & Powell, Reference Jansson and Powell2007) epigenetic gene regulatory mechanisms. While these changes may ensure the immediate survival of the fetus, they may simultaneously increase its long-term physiological and psychological vulnerability (Liyanage et al., Reference Liyanage, Jarmasz, Murugeshan, Del Bigio, Rastegar and Davie2014; Petronis, Reference Petronis2010; Shonkoff et al., Reference Shonkoff, Boyce and McEwen2009).
Evidence from human and nonhuman animal studies suggests that epigenetic modifications of the genome (DNA methylation (DNAm), chromatin remodeling, and histone modification) constitute a primary mechanism by which environmental and stochastic factors may influence genetically defined developmental processes (Massart et al., Reference Massart, Nemoda, Suderman, Sutti, Ruggiero, Dettmer and Szyf2016; Meaney & Szyf, Reference Meaney and Szyf2005; McGowan et al., Reference McGowan, Sasaki, D'alessio, Dymov, Labonté, Szyf and Meaney2009; Szyf & Bick, Reference Szyf and Bick2013; Thompson & Einstein, Reference Thompson and Einstein2010; Tobi et al., Reference Tobi, Slieker, Luijk, Dekkers, Stein and Xu2018). DNAm—the addition of a methyl group at the 5-carbon position of cytosine in millions of cytosine–phosphate–guanine (CpG) dinucleotides distributed throughout the mammalian genome—is the most widely studied epigenetic modification (Petronis, Reference Petronis2010). If the biological record of adaptation to adverse intrauterine conditions and maternal risk factors is sufficiently stable, alterations in DNAm profiles may be detectable in adult survivors of extremely preterm birth (Hertzman, Reference Hertzman2012; Meaney & Szyf, Reference Meaney and Szyf2005).
Sex differences in vulnerability to early adversity
According to recent studies, exposure to prenatal adversity disproportionately disadvantages males. Male infants are more likely than females to experience obstetric complications (Ingemarsson, Reference Ingemarsson2003), preterm birth (Brettell, Yeh, & Impey, Reference Brettell, Yeh and Impey2008; Challis, Newnham, Petraglia, Yeganegi, & Bocking, Reference Challis, Newnham, Petraglia, Yeganegi and Bocking2013), perinatal morbidities, and mortality (Bale, Reference Bale2011; Di Renzo, Rosati, Sarti, Cruciani, & Cutuli, Reference Di Renzo, Rosati, Sarti, Cruciani and Cutuli2007; Vatten & Skjærven, Reference Vatten and Skjærven2004). When they survive, males born preterm are at greater risk than females for poor neurological outcomes (Hintz, Kendrick, Vohr, Poole, & Higgins, Reference Hintz, Kendrick, Vohr, Poole and Higgins2006; Kent, Wright, & Abdel-Latif, Reference Kent, Wright and Abdel-Latif2012; Peacock, Marston, Marlow, Calvert, & Greenough, Reference Peacock, Marston, Marlow, Calvert and Greenough2012), and long-term physical (Wilson-Costello, Friedman, Minich, Fanaroff, & Hack, Reference Wilson-Costello, Friedman, Minich, Fanaroff and Hack2005) and cognitive (Hack et al., Reference Hack, Flannery, Schluchter, Cartar, Borawski and Klein2002) disability.
It has been proposed that fetal responses to adverse intrauterine conditions are sexually dimorphic, and that females may be able to withstand the detrimental effects of poor environments to a greater degree than males (Clifton, Reference Clifton2010; Sandman, Glynn, & Davis, Reference Sandman, Glynn and Davis2013). In chronically poor conditions, female fetuses appear to adapt by reducing their overall growth, whereas male fetuses tend to grow to their expected size—potentially at a cost to their viability or later health (Clifton, Reference Clifton2010; Murphy et al., Reference Murphy, Gibson, Giles, Zakar, Smith, Bisits and Clifton2003; Sandman et al., Reference Sandman, Glynn and Davis2013). Both sex and early nutrition have been identified as significant predictors of DNAm profiles in neonates (Sparrow et al., Reference Sparrow, Manning, Cartier, Anblagan, Bastin, Piyasena and Evans2016) and mature adults (Tobi et al., Reference Tobi, Slieker, Luijk, Dekkers, Stein and Xu2018). Sex differences in DNAm have been found across the gestational period in human fetal brain samples (Spiers et al., Reference Spiers, Hannon, Schalkwyk, Smith, Wong, O'Donovan and Mill2015), and some of these differences are present at many of the same CpG sites in adults (cf. Xu et al., Reference Xu, Wang, Liu, Yu, Gelernter and Zhang2014). Changes in DNAm are also common in adults exposed prenatally to war-time famine, depending on the gestational timing of the exposure and the individual's sex (Tobi et al., Reference Tobi, Slieker, Luijk, Dekkers, Stein and Xu2018). Together, these studies suggest that sex-specific adaptation to severe early adversity may be detectable in the adult methylome.
The present study
The primary aim of this study was to compare DNAm profiles in adults who were exposed to extremely preterm birth and adults who were not exposed. If epigenetic modifications reflect stable adaptations to adverse intrauterine and perinatal conditions, then genomic DNAm profiles may be altered in adult ELBW survivors relative to NBW control adults. Additionally, if males are differentially vulnerable to perinatal adversity, then genomic DNAm profiles may also diverge between male and female ELBW survivors. To test these hypotheses, we examined DNAm profiles in buccal epithelial cells from adult ELBW survivors and NBW control adults when both groups were in their early thirties. Derived from the same ectodermal germ layer as the central nervous system, buccal epithelial samples may be particularly informative in epigenome-wide association studies of nonblood-based phenotypes (Lowe et al., Reference Lowe, Gemma, Beyan, Hawa, Bazeos, Leslie and Ramagopalan2013; see also Smith et al., Reference Smith, Kilaru, Klengel, Mercer, Bradley, Conneely and Binder2015).
A second aim was to understand the nature of any putative long-term effects of fetal exposure to extreme early adversity, by identifying biological themes or pathways in adult DNAm profiles that may have been influenced by extremely preterm birth. These pathways are defined by genes that are enriched for CpG loci with differential levels of methylation in ELBW adults relative to NBW adults. Gene ontology (GO) analyses of functionally annotated genes (Huang, Sherman, & Lempicki, Reference Huang, Sherman and Lempicki2009b) were planned in order to examine sample-wide differences in DNAm profiles by birth weight, by sex, and in four pairs of subgroups: ELBW men relative to ELBW women, NBW men relative to NBW women, ELBW men versus NBW men, ELBW women versus NBW women.
Materials and Methods
Ethics statement
The study was approved by the Hamilton Integrated Research Ethics Board, and informed consent was obtained from all participants.
Participants
ELBW group
Out of 397 infants born at ELBW between 1977 and 1982 to parents living in south western Ontario, Canada (Saigal, Rosenbaum, Hattersley, & Milner, Reference Saigal, Rosenbaum, Hattersley and Milner1989) 179 survived to hospital discharge (45%). At birth, these infants had completed 23–36 weeks’ gestation (median = 27 weeks) and weighed 500–1000 g (M = 837 g). Some children died subsequently, leaving 166 who survived to young adulthood. Of these survivors, 142 participated in an assessment at age 22–26 years old. One hundred and two ELBW survivors were located and participated in the most recent assessment at age 29–36 years old (61% of 166). Of these, 30 ELBW survivors with birth weight <10th percentile for gestational age were classified as small for gestational age at birth (SGA; Kramer et al., Reference Kramer, Platt, Wen, Joseph, Allen and Abrahamowicz2001). The remaining 72 were born at an appropriate weight for gestational age at birth (AGA). Twenty-seven ELBW participants had neurosensory impairments (NSI), defined as cerebral palsy, blindness, deafness, and/or mental retardation. All but five of the 102 ELBW participants were of Caucasian ethnicity.
NBW group
A group of 145 participants born at NBW (M = 3,373 g) was added to the cohort when children in both birth weight groups were 8 years old (Saigal, Szatmari, Rosenbaum, Campbell, & King, Reference Saigal, Szatmari, Rosenbaum, Campbell and King1991). These children were randomly selected from local school boards and group-matched with the surviving ELBW children on age, sex, ethnicity, and familial socioeconomic status (SES) (Hollingshead, Reference Hollingshead1969). From these, 133 participated in the assessment at age 22–26 years old. Ninety-four NBW adults were located and participated in the most recent assessment at age 29–36 years old (65% of 145). None of them were born SGA, and only one had NSI.
At the last assessment (age 29–36 years), samples of buccal epithelial cells were collected from 92 ELBW participants and 89 NBW participants. These samples were initially genotyped for candidate genes in relation to mental health (Lahat et al., Reference Lahat, Van Lieshout, Mathewson, Mackillop, Saigal, Morrison and Schmidt2016). After genotyping, sufficient usable buccal material remained to permit DNAm analyses for 45 ELBW and 49 NBW participants. Among the 45 ELBW participants, 17 (38%; three male) were SGA at birth, and eight (18%; five male) had NSI. All but one of these 45 ELBW participants were Caucasian; one male was south Asian. Quality control led to the exclusion of two NBW samples, leaving data from 47 NBW participants, all of whom were Caucasian, AGA at birth, and free of NSI.
Demographic data for the 45 ELBW and 47 NBW participants and 134 and 98 nonparticipants, respectively, are presented in Table 1. ELBW participants did not differ from ELBW nonparticipants in mean birth weight, current age, sex distribution, ethnicity, childhood SES, prevalence of NSI, educational attainment, current yearly income, or self-reported chronic conditions (all ps > .06). However, the mean gestation period of ELBW participants (M = 27.8 (2.4) weeks) was a week longer than that of nonparticipants (M = 26.7 (2.2) weeks), t(43) = 2.74, p < .01, and ELBW participants were less likely than nonparticipants to have been born SGA, χ2(45) = 6.23, p < .02, OR = 2.52, (95% CI 1.20–5.28).
Demographic characteristics by birth weight group and study participation.

Notes: SGA = small for gestational age; NSI = neurosensory impairment, determined at birth; SES = socioeconomic status, where category 1 is high.
For extremely low birth weight (ELBW) participants: familial SES: n = 44; education: n = 30; income: n = 39; chronic conditions: n = 43.
For ELBW non-participants: familial SES: n = 112; education: n = 73; income: n = 48; current age: n = 57; chronic conditions: n = 53.
For normal birth weight (NBW) participants: education: n = 28; income: n = 40; age: n = 46; chronic conditions: n = 43.
For NBW non-participants: education: n = 54; income: n = 40; age: n = 47; chronic conditions: n = 42.
The 47 NBW participants did not differ from NBW nonparticipants in birth weight, current age, sex distribution, childhood SES, educational attainment, or current yearly income (all ps > .15). NBW participants (M = 2.3 (2.0)) reported more chronic health conditions than did nonparticipants (M = 1.3 (1.5)), t(45) = 2.56, p < .02.
In group-wise comparisons, ELBW and NBW participants did not differ in current age, t(90) = 2.56, p > .75, sex distribution, χ2(92) = 0.22, p > .60, OR = 1.22, (95% CI 0.53–2.81), or the number of self-reported chronic conditions, p > .20. As expected, SGA status, χ2(92) = 21.78, p < .001, OR = 2.68, (95% CI 2.00–3.59), and NSI, χ2(92) = 9.15, p < .01, OR = 2.27, (95% CI 1.78–2.89), were more prevalent among ELBW survivors than NBW controls. Current yearly income (in Canadian dollars) was significantly lower in the ELBW group, (M = $26,688 ($20,729)) as compared to the NBW group (M = $43,264 ($28,942)), p < .01, although familial (childhood) SES and educational attainment did not differ between groups, ps > .25.
Sample preparation, methylation analyses and measures
Genomic DNA extraction and purification
Buccal epithelial cells were collected using sterile OmniSwabs (G.E. Whatman Microbiology Products, www.sigmaaldrich.com), and stored at −80°C prior to DNA extraction. The Omega EZNA Tissue DNA kit (Omega Bio-Tek, cat. no. D3396) was used to obtain purified genomic DNA. DNA was eluted in a Tris-EDTA buffer (10 mM Tris-CL, pH 8.5, 1 mM EDTA). Its concentration and purity were quantified using a NanoDrop 2000c Spectrophotometer (Thermo Scientific, Waltham, MA, USA). Elutions were further purified using the Qiagen MinElute Reaction Cleanup Kit (Qiagen Canada, cat. no. 28204) when DNA purity did not meet standard absorbance criteria; that is, A260/A280 = 1.8–2.0, and A260/A230 > 2.0. The purified DNA was diluted to a final concentration of approximately100 ng/μl.
DNA methylome arrays
The Illumina Infinium Human Methylation EPIC 850 BeadChip microarray was used to obtain genomic DNA methylome profiles (processed at Genome Québec, Montréal, QC, Canada). Approximately 1.5 μg of purified genomic DNA from each individual was bisulfite converted using the EZ DNAm Kit (Zymo Research) and hybridized following standard Illumina protocols for the 850 K platform. The EPIC array interrogates methylation levels at more than 850,000 CpG loci, covering 94% of the CpG sites represented in the previous Illumina platform (Illumina HumanMethylation 450), plus an additional 413,743 CpG sites (Pidsley et al., Reference Pidsley, Zotenko, Peters, Lawrence, Risbridger, Molloy and Clark2016). The loci assessed by the EPIC array represent the vast majority of promoters, untranslated regions (UTRs), 1st exons, gene bodies, and CpG islands in the human genome (Heiss et al., Reference Heiss, Brennan, Baccarelli, Téllez-Rojo, Estrada-Gutiérrez, Wright and Just2019). The raw data will be deposited in Gene Expression Omnibus (GEO) at NCBI (www.ncbi.nlm.nih.gov/geo/).
DNA methylome data normalization and cellular deconvolution
Data from each 850 K microarray were annotated according to Human Genome Build 37, available at the UCSC Genome Browser (http://genome.ucsc.edu/). DNA methylome analyses were performed in R, using the Minfi package (Aryee et al., Reference Aryee, Jaffe, Corrada-Bravo, Ladd-Acosta, Feinberg, Hansen and Irizarry2014). Raw probe fluorescence intensities were normalized by Subsetquantile Within Array Normalization (SWAN; Maksimovic, Gordon, & Oshlack, Reference Maksimovic, Gordon and Oshlack2012). Methylation values for each of the probes on the 850 K microarray were produced as beta values for each probe. Beta value estimates of methylation levels for each CpG site were defined as the ratio of methylated probe fluorescence intensity over total intensity (methylated plus unmethylated probe intensities). Ranging from 0 (completely unmethylated) to 1 (fully methylated), beta values are roughly equivalent to the percentage of methylation of the CpG site (Bibikova et al., Reference Bibikova, Barnes, Tsan, Ho, Klotzle, Le and Fan2011; Sandoval et al., Reference Sandoval, Heyn, Moran, Serra-Musach, Pujana, Bibikova and Esteller2011).
Because DNAm levels are tissue-specific (Liu et al., Reference Liu, Aryee, Padyukov, Fallin, Hesselberg, Runarsson and Shchetynsky2013), it is possible for variation in cell types to account for observed group differences in DNAm. To examine this possibility, proportions of epithelial, fibroblast, and immune cells in the buccal samples were estimated using the Epigenetic Dissection of Intra-Sample Heterogeneity algorithm (EpiDISH; Zheng et al., Reference Zheng, Webster, Dong, Feber, Graham, Sullivan and Teschendorff2018). Across the cohort, median proportions were 90.6%, < 0.001%, and 9.4%, for epithelial, fibroblast, and total immune cells, respectively. Cell-type proportions (i.e., epithelial, fibroblast, and total immune cells) also did not differ between ELBW (88.3%, 0.0%, and 11.7%) and NBW (92.2%, 0.0%, and 7.8%) participants, ps > .05, nor between men (90.1%, 0.0%, and 9.9%) and women (91.1%, 0.0% and 8.9%), all ps > .22, in non-parametric tests (Supplementary Figure 1).
DNA methylome analysis
To avoid confounds due to genetic polymorphisms and to increase analytic power (Chen et al., Reference Chen, Lemire, Choufani, Butcher, Grafodatskaya, Zanke and Weksberg2013; Herrera, de Vega, Ashbrook, Vernon, & McGowan, Reference Herrera, de Vega, Ashbrook, Vernon and McGowan2018; Lam et al., Reference Lam, Emberly, Fraser, Neumann, Chen, Miller and Kobor2012), 30,507 low-quality probes (detection p value ≥ 0.01) were removed prior to analysis, including those overlapping single-nucleotide polymorphisms (SNPs) either at or within 10 bp of the targeted CpG site (according to dbSNP versions 132, 135, and 137), and any invariable probes with a mean beta value ≥ 0.95 or ≤ 0.05 across case and control samples. Obtained beta values were corrected for microarray run, while counterbalancing the batches by birth weight group (Johnson, Li, & Rabinovic, Reference Johnson, Li and Rabinovic2007). Differentially methylated sites (mean beta difference of ≥ 0.05) were identified using the Wilcoxon-rank sum test. The Benjamini–Hochberg procedure/false discovery rate (FDR) was applied to correct for multiple testing (Benjamini & Hochberg, Reference Benjamini and Hochberg1995), following methods used in previous epigenomic studies (e.g., de la Rica et al., Reference de la Rica, Urquiza, Gómez-Cabrero, Islam, López-Bigas, Tegnér and Ballestar2013; de Vega, Herrera, Vernon, & McGowan, Reference de Vega, Herrera, Vernon and McGowan2017; Herrera et al., Reference Herrera, de Vega, Ashbrook, Vernon and McGowan2018; FDR p value < .05). Lists of differentially methylated probes, regions, and their annotations were generated using the dmpFinder function. Annotations in relation to genic regions were based on nomenclature available from the UCSC Genome Browser (http://genome.ucsc.edu/).
Three approaches were used to statistically compare DNAm profiles among subgroups. First, average differences in DNAm levels were compared among the four subgroups via a Kruskal–Wallis test with pairwise follow-up tests. Second, mean methylation levels at each probe for each individual within a subgroup were classified as low (β < 0.3), moderate (0.3 < β < 0.8) or high (> 0.8). Differences in the relative proportions of low, moderate, and high levels of methylation were tested for each pair of subgroups with Pearson chi square tests (Davies et al., Reference Davies, Volta, Pidsley, Lunnon, Dixit, Lovestone and Al-Sarraj2012; Smith et al., Reference Smith, Kilaru, Klengel, Mercer, Bradley, Conneely and Binder2015). Third, DNAm levels were compared by computing Euclidian distances between subgroups. For each pair of subgroups, we squared the beta difference in DNAm levels for each CpG site that was identified as significant and took the square root of the sum of the squared differences. The square root (Euclidian distance) reflects the overall similarity between two subgroups, where smaller distances indicate greater similarity.
Gene annotation and gene ontology (GO) analysis
Gene lists and their associated biological terms may be analyzed for over-represented terms by functional annotation algorithms that condense the many terms associated with a list of genes into organized classes or biological modules. To interpret the functional significance of genes that were differentially methylated in a given subgroup, we used the functional annotation tool from DAVID (Database for Annotation, Visualization, and Integrated Discovery, v 6.8), an integrated bioinformatics knowledgebase that identifies common biological processes and pathways, molecular functions, and cellular components that are defined by GO criteria (http://david.abcc.ncifcrf.gov/). For comparisons, GO analysis was also performed using g:Profiler (https://biit.cs.ut.ee/gprofiler/gost), and the Kyoto Encyclopedia of Genes and Genomes (KEGG, https://www.genome.jp/kegg/), using default parameters. Statistical associations between GO terms and genes in the provided gene list were analyzed in DAVID to determine the enrichment of GO terms related to biological processes relative to the background gene set. The default medium stringency level was used. The differentially methylated gene list was visualized in EnrichmentMap to generate a network map of clustered GO terms (Merico, Isserlin, Stueker, Emili, & Bader, Reference Merico, Isserlin, Stueker, Emili and Bader2010). In the network map, GO terms are represented as nodes, where node size reflects the number of genes that co-occur in each GO term. Links between nodes represent genes in common, where link thickness is proportional to the degree of overlap between gene sets. Overlap between GO terms is calculated by the overlap coefficient, which handles hierarchically organized gene set collections (Merico et al., Reference Merico, Isserlin, Stueker, Emili and Bader2010). For network maps, DAVID GO results were clustered using default settings of the EnrichmentMap plugin (Merico et al., Reference Merico, Isserlin, Stueker, Emili and Bader2010) in Cytoscape 2.8.2, namely, p value cutoff = 0.005, FDR q value cutoff = 0.1, overlap coefficient cutoff = 0.5, and combined constant = 0.5. Clusters of related gene-sets within the network define major biological or molecular themes in the GO results. Clusters were arranged using the yFiles Organic algorithm and named using the WordCloud plugin (http://baderlab.org/Software/WordCloudPlugin).
Results
Identification of differentially methylated CpG sites in ELBW versus NBW adults
After microarray normalization of the raw DNAm data, 836,329 probes remained for analysis. Surprisingly, applying the probe selection criteria yielded only three CpG sites that distinguished between ELBW survivors and NBW control participants (cg05900538, cg15087178, cg17419818), associated with the master-mind like transcriptional coactivator 2 (MAML2), ankyrin 3 (ANK3), and neurocalan delta (NCALD) genes, respectively. However, the contrast between men and women (across birth weight groups) yielded 9,182 differentially methylated CpG sites, with significant sex differences on 3,642 unique coding and non-coding genes, excluding the sex chromosomes (Supplementary Table 1). DNAm levels were then compared between sexes for each birth weight group, and between birth weight groups separately for each sex. Lists of differentially methylated positions (DMPs at CpG sites) for these subgroup comparisons may be found in Supplementary Tables 2 to 5.
Sex differences: ELBW men versus ELBW women
A total of 77,895 CpG sites were differentially methylated in ELBW men relative to ELBW women. A region-level analysis identified 49,990 DMPs within or proximal to 14,024 unique coding and noncoding genes, excluding the sex chromosomes. When classified by their genic locations, 8,464 of DMPs (16.9%) were located within 1500 bp and 200 bp of transcription start sites (TSS; gene promoters), 31,876 (63.8%) in gene bodies, and 8,264 (16.5%) in 3’ and 5’ UTRs (Supplementary Figure 2). The majority of these differentially methylated regions were hypermethylated in ELBW men (71.3% of DMPs) relative to ELBW women. Only 2.8% of significant DNAm differences were observed within 1st exons or exon boundaries (1,386 sites). A total of 18,219 differentially methylated CpG sites were mapped by their location relative to CpG islands: 10,632 (58.4%) were located within island shores (≤2 kb upstream and downstream of CpG islands), 5,162 (28.3%) in shelves (≤2 kb upstream and downstream of island shores), and 2,425 (13.3%) in CpG islands themselves (Supplementary Figure 3). The 25 probes showing the most significant sex differences in DNAm in ELBW survivors are presented with their genic locations in Table 2, with the complete list of differentially methylated CpG sites in Supplementary Table 6. In contrast to the overall pattern of hypermethylation in ELBW men relative to ELBW women, most of these highly differentiated DMPs (22/25) showed hypomethylation in ELBW men.
Top 25 differentially methylated positions (DMPs) between extremely low birth weight (ELBW) men and ELBW women, and between normal birth weight (NBW) men and NBW women, showing probe names, methylation levels, intergroup methylation differences, adjusted p values, and probe annotations.

Note: p values were adjusted for FDR using the Benjamini–Hochberg procedure. Twenty-three of the top 25 DMPs showing sex differences in ELBW survivors are also in the top 25 DMPs showing sex differences in NBW control participants. Exceptions: cg01966510 and cg10892585 are not in the top 25 DMPs for NBW men and women. cg11643285 and cg14095100 are not in the top 25 DMPs for ELBW men and women.
NBW men versus NBW women
A total of 3,424 CpG sites were differentially methylated in NBW men versus NBW women. A region-level analysis identified 2,184 DMPs annotated to 1,523 unique coding and noncoding genes, excluding the sex chromosomes. When classified by genic location, 419 DMPs (19.2%) were located near promoters, 1,333 (61.0%) were in gene bodies, and 358 sites (16.4%) were in 3’ and 5’ UTRs (Supplementary Figure 2). In contrast to ELBW men, NBW men showed significant hypomethylation (80.4% of DMPs) relative to NBW women. Only 3.4% of significant DNAm differences were observed within 1st exons or exon boundaries (74 sites). A total of 1,018 differentially methylated CpG sites were mapped by their location relative to CpG islands: 522 sites (51.3%) were located within island shores, 204 (20.0%) in shelves, and 292 (28.7%) in CpG islands (Supplementary Figure 3).
The 25 probes that showed the greatest sex differences in NBW controls are presented with their genic locations in Table 2, with the complete list of differentially methylated CpG sites between NBW men and women in Supplementary Table 7. Notably, 23 of the top 25 probes were the same probes that showed significant sex differences in ELBW survivors. The majority of these highly differentiated DMPs showed hypomethylation in men relative to women, in both birth weight groups (ELBW, 22; NBW, 23).
Birth weight group differences: ELBW men versus NBW men
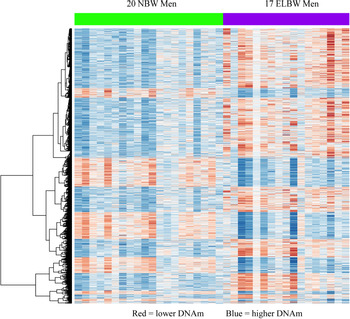
A total of 1,354 CpG sites were differentially methylated in ELBW men relative to NBW control men. These DMPs are presented in a clustered heatmap in Figure 1. A region-level analysis identified 811 DMPs annotated to 694 unique coding and noncoding genes. When these DMPs were classified according to their genic locations, 161 (19.9%) were located near promoters, 499 (61.5%) in gene bodies, and 119 (14.7%) in 3’ and 5’ UTRs. Overall, ELBW men showed relative hypermethylation (57.7% of DMPs) with respect to NBW men (Supplementary Figure 2). Only 3.9% of significant DNAm differences were observed within 1st exons or exon boundaries (32 sites). A total of 284 DMPs were mapped by their location relative to CpG islands: 154 (54.2%) were located within island shores, 83 (29.2%) in island shelves , and 47 (16.5%) in CpG islands (Supplementary Figure 3). The 25 probes showing the most significant differences in DNAm between ELBW and NBW men are presented with their genic locations in Table 3, with the complete list of differentially methylated CpG sites in Supplementary Table 8.
Clustering heatmap for significant differences in DNA methylation (DNAm) at 1354 cytosine–phosphate–guanine (CpG) sites in extremely low birth weight (ELBW) men (purple bar) and normal birth weight (NBW) men (green bar). Color available online.

Top 25 differentially methylated positions (DMPs) between extremely low birth weight (ELBW) men and normal birth weight (NBW) men, showing probe names, methylation levels, intergroup methylation differences, adjusted p values, and probe annotations.

Note: Most of the top 25 DMPs show hypomethylation in ELBW men relative to NBW men.
ELBW women versus NBW women
Only two CpG sites differentiated between ELBW survivors and NBW control women (cg18025793 and cg17660417) on the C3- and PZP-like A2M domain-containing protein 8 (CPAMD8) and tumor necrosis factor alpha induced protein 3 (TNFAIP3) genes, respectively. These two probes were hypomethylated in ELBW women and are presented with their genic locations in Table 4 and Supplementary Table 9.
Two differentially methylated positions (DMPs) between extremely low birth weight (ELBW) women and normal birth weight (NBW) women, showing probe names, methylation levels, intergroup methylation differences, adjusted p values, and probe annotations.

Role of NSI in ELBW men
Eight of the 45 ELBW adults had significant neurosensory impairment, whereas all 47 NBW controls were free of NSI (difference, p < .01). Although ELBW men (n = 5) were not more likely than ELBW women (n = 3) to have NSI, p > .11, and overall health at the time of the assessment was comparable in both birth weight groups (self-reported chronic conditions, p > .20), it was possible that the presence of NSI in five of the 17 ELBW men (29%) may have contributed to the significant birth weight group differences in DNAm in men. An additional analysis was carried out to test this hypothesis. Only four CpG sites (cg05951296, cg20450577, cg08505647, and cg14481604) showed significant differences at > 5% among the three subgroups, ELBW men with NSI (n = 5), ELBW men without NSI (n = 12), and NBW men (n = 20). These data are presented in Table 5 and Supplementary Table 10.
Four cytosine–phosphate–guanine (CpG) sites differentiated among extremely low birth weight (ELBW) men with neurosensory impairment (NSI), ELBW men without NSI, and normal birth weight (NBW) control men. Differentially methylated positions (DMPs) are presented with probe names, methylation levels, intergroup methylation differences, adjusted p values, and probe annotations.

FDR= false discovery rate
Overlap in pair-wise comparisons
Significant DMPs were localized to 694 unique genes in ELBW men versus NBW men, 1,523 unique genes in NBW men versus NBW women, and 14,024 unique genes in ELBW men versus ELBW women. The overlap among probes is presented in a Venn diagram in Figure 2. As indicated in Figure 2, 631 (91%) of the genes showing birth weight group differences in men (694) also showed sex differences in ELBW survivors. Only 136 (9%) of the genes showing sex differences in NBW controls (1,523) also showed birth weight group differences in men. Only 1,379 (10%) of the genes showing sex differences in ELBW survivors (14,024) also showed sex differences in NBW controls. . These findings suggest interactive effects of extremely preterm birth and sex in ELBW survivors.
Venn diagram of overlap among probes that demonstrated significant subgroup differences between normal birth weight (NBW) men and NBW women, extremely low birth weight (ELBW) men and NBW men, and ELBW men and ELBW women. The number of genes that distinguish between two subgroups appear below each comparison named. The number of genes in common between two comparisons are indicated in the intersections of circles. No genes overlap in the comparisons of ELBW women versus NBW women and ELBW men versus NBW men. Color available online.

Statistical comparisons of DNAm distributions by subgroup
Given that effects of sex and birth weight status on DNAm profiles appeared to vary among the four subgroups, we tested for overall differences in the numbers of significantly differing CpG sites for each pair of subgroups using a Kruskal–Wallis test (Kruskal–Wallis H(3) = 3352.36, p < .001). Follow-up pairwise contrasts of subgroups by Mann–Whitney U tests indicated that sex differences in DNAm in the NBW (Z = −24.41, p < .001) and ELBW (Z = −8.07, p < .001) groups ranked significantly higher than birth weight group differences in DNAm between ELBW and NBW men. In addition, sex differences in DNAm in the ELBW group ranked much higher than sex differences in the NBW group (Z = −57.52, p < .001).
Secondly, to test for significant differences in the distributions of DNAm levels by subgroup, separate chi square analyses were performed on the proportions of low, moderate, and high DNAm levels at significant DMPs (β < 0.3, 0.3 < β < 0.8, β > 0.8, respectively) by subgroup pairs. Proportions of low, moderate, and high levels of methylation differed significantly between ELBW men and ELBW women, χ2 (155,790) = 10,623.34, p < .001, between NBW men and NBW women, χ2 (6,848) = 167.56, p < .001, and between ELBW men and NBW men, χ2 (2,708) = 8.86, p < .02.
To further explore effects of birth weight status and sex on the distributions of DMPs, we compared two sets of subgroup differences in DMPs with respect to their “direction,” (hypermethylation or hypomethylation) and genic locations. Proportions of low, moderate, and high DNAm levels in ELBW men and ELBW women (Contrast 1), were compared with the proportions for ELBW men and NBW men (Contrast 2), in separate χ2 analyses by genic location, namely, at (a) transcription start sites, TSS, (b) regulatory elements, (c) gene bodies, and (d) all three of these genic locations (Table 6).
Distributions of hyper- and hypomethylated cytosine–phosphate–guanine (CpG) sites in extremely low birth weight (ELBW) versus normal birth weight (NBW) men, ELBW men versus ELBW women, and NBW men versus NBW women.

Notes: Overall, CpG sites at genic locations in ELBW men were hypermethylated with respect to NBW men and to ELBW women. In contrast, CpG sites in NBW men were hypomethylated with respect to NBW women. Percentages were calculated by dividing the number of differentially methylated positions (DMPs) at each genic location by the total number of DMPs identified for that comparison. (Regulatory Elements include TSS).
The DMPs reflecting significant sex differences in ELBW survivors differed from those reflecting significant birth weight group differences in men at all genic locations—TSS, χ2 (8,626) = 19.63, p < .001, OR = 2.00, 95% CI (1.46, 2.73); regulatory elements, χ2(15,596) = 39.20, p < .001, OR = 2.10, 95% CI (1.66, 2.66), gene bodies, χ2(33,788) = 33.50 p < .001, OR = 1.70, 95% CI (1.42, 2.04)—and total genic locations, χ2(49,384) = 72.60, p < .001, OR = 1.85, 95% CI (1.60, 2.13). Sex differences in the ELBW survivor group were characterized by greater proportions of low-hypermethylated DMPs in ELBW men (relative to ELBW women), whereas birth weight group differences in men were characterized by greater proportions of highly-hypomethylated DMPs in ELBW men (relative to NBW men) (Figure 3).
Relative distributions of hypo- and hypermethylated cytosine-phosphate-guanine (CpG) sites in extremely low birth weight (ELBW) men versus ELBW women (Contrast 1), and ELBW men versus normal birth weight (NBW) men (Contrast 2), by genic location and proportion of low, moderate, or high levels of hypo- and hypermethylation. Distributions related to birth weight group (in men) differed significantly from those related to sex (within the ELBW group) in separate χ2 tests for each location. *** = p < .001.

Thirdly, to compare the magnitude and “direction” of significant differences in DNAm among pairs of subgroups, mean Euclidian distances were calculated for each subgroup pair. Euclidian distance reflects the summed differences in DNAm levels between two groups, and also the total number of sites contributing to net hypermethylation or hypomethylation in one group versus another. The number of CpG sites showing sex differences in DNAm was greatly enhanced among ELBW survivors (Euclidian distance: 23.04) as compared to the number showing sex differences in NBW controls (Euclidian distance: 5.71). Overall DNAm levels differed by birth weight group in men (ELBW men vs. NBW men, Euclidian distance: 3.13), but not women (ELBW women vs. NBW women, Euclidian distance: 0.08) (Figure 4). In sum, statistical tests showed that DNAm profiles were most different between ELBW men and women, then NBW men and women, and then ELBW and NBW men (all significantly), but differed little between NBW and ELBW women.
Subgroup differences in overall methylation levels, based on Euclidian distances. Arrow directions indicate DNA hypermethylation in the darker shaded group relative to the lighter shaded group. Smaller Euclidian distance reflects greater similarity between DNA methylation profiles.

Gene pathway enrichment by differential DNAm
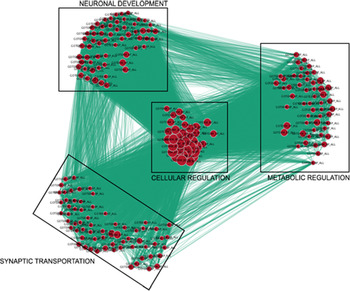
To interpret potential biological functions and interactions between genes, GO analysis was performed (where possible) on genes identified by differentially methylated CpG sites using the DAVID algorithm tool for each pair of subgroups (Huang et al., Reference Huang, Sherman and Lempicki2009b). After grouping functionally related GO terms for the 16,792 tagged background genes known to be associated with these GO terms (Huang, Sherman, & Lempicki, Reference Huang, Sherman and Lempicki2009a) and applying statistical cut-offs, four important pathways and 212 GO terms differentiated between ELBW men and NBW men. These pathways were related to neuronal development (66 terms; 31%), synaptic transportation (59 terms; 28%), metabolic regulation (53 terms; 25%), and cellular regulation (34 terms; 16%). A network map of enriched GO terms in ELBW men compared to NBW control men is presented in Figure 5. The 35 most significant GO terms are presented by their biological pathways in Table 7. Full lists of GO terms are found in Supplementary Tables 11a–c; cf. g:Profiler, 228 GO terms; KEGG, 2 GO terms, FDR < 0.05.
Enriched biological pathways from gene ontology (GO) analysis of differentially methylated sites in extremely low birth weight (ELBW) men versus normal birth weight (NBW) men (boxes). Node size corresponds to the number of genes represented by a given GO term; edge thickness is proportional to the number of genes in common between GO term. Color available online.

Top 35 of 212 GO terms associated with four clusters of genes enriched for differentially methylated cytosine-phosphate-guanine (CpG) sites in extremely low birth weight (ELBW) men versus normal birth weight (NBW) men.

Notes: p values were adjusted for false discovery rate (FDR) using the Benjamini–Hochberg procedure.
Using a similar approach for differences between NBW men and women, gene ontology analysis of the 18,224 tagged background genes identified 403 GO terms that differed significantly between NBW men and women. These terms could not be assigned to specific pathways, but the most significant terms related to cellular development (Supplementary Tables 12a–c; cf. g:Profiler, 286 GO terms; KEGG, 16 GO terms, FDR < 0.05).
The GO algorithm in DAVID is optimized for use with lists of 100–1000 genes (Essex et al., Reference Essex, Boyce, Hertzman, Lam, Armstrong, Neumann and Kobor2013). Given the large number of DMPs associated with unique genes (14,024) in ELBW men versus ELBW women, and the paucity of DMPs (two) that distinguished between ELBW and NBW women, GO analyses were not performed for these comparisons.
Discussion
In this study, we present three main epigenetic findings that are relevant to adults born extremely preterm. First, significant sex differences in the DNAm profiles of adults born at ELBW and at NBW were apparent in the fourth decade of life. Second, sex differences were markedly more numerous in ELBW survivors than in NBW control adults. Third, DMPs clearly distinguished between men born at ELBW versus at NBW. There was scant evidence that the methylomes of women were affected by ELBW status. To our knowledge, this is the first genome-wide study to report sex differences in the methylation profiles of adults who were born at ELBW. It is also the first known study to show that sex differences in DNA methylation levels may interact with ELBW status to generate differing DNAm profiles in ELBW and NBW men.
Sex differences in DNAm
In the present study, sex differences in DNAm appeared to be broadly distributed across autosomal sites (Liu, Morgan, Hutchison, & Calhoun, Reference Liu, Morgan, Hutchison and Calhoun2010), regardless of birth weight status. In both birth weight groups, DNAm levels differed significantly between men and women at loci on genes known to be involved in transcriptional regulation of cell proliferation and apoptosis (transcription factor Dp-1;TFDP1), structural organization of dendritic spines and synaptic junctions (SH3 and multiple ankyrin repeat domains protein 2; SHANK2)), induction of apoptosis following DNA damage (dual-specificity tyrosine-phosphorylation-regulated kinase 2; DYRK2), targeting of abnormal cells for degradation (ubiquitin-conjugating enzyme E2Q family pseudogene 1; UBE2Q2P1), telomere dynamics (family with sequence similarity 35 member A; FAM35A), and gamete production (deleted in AZoospermia1; DAZL1)—cellular and molecular processes that are fundamental to human organismic development (Table 2).
Twenty-one of the top 25 CpG sites showing sex differences in both birth weight groups were hypomethylated in men, including RFTN1, TLE1, and PPP1R12B (Table 2). The raftlin lipid-raft linker 1 (RFTN1) gene is known to have a critical role in the formation of cholesterol-rich lipid rafts in the plasma membrane, and has been reported previously to be hypomethylated in men (Inoshita et al., Reference Inoshita, Numata, Tajima, Kinoshita, Umehara, Yamamori and Ohmori2015; Xu et al., Reference Xu, Wang, Liu, Yu, Gelernter and Zhang2014). The transducin-like enhancer protein 1 (TLE1) gene is a transcriptional repressor that is critical for neuronal differentiation and hematopoiesis (formation of blood cell components), and also is reported to be hypomethylated in men (Inoshita et al., Reference Inoshita, Numata, Tajima, Kinoshita, Umehara, Yamamori and Ohmori2015; Liu et al., Reference Liu, Morgan, Hutchison and Calhoun2010). The protein phosphatase1 regulatory subunit 12B (PPP1R12B) gene is highly expressed in skeletal muscle, heart, kidney, and brain, and is known to participate in muscle contraction kinetics. The PPP1R12B gene is strongly associated with male sex, as it lies in a region that has a homologous sequence on the Y chromosome, causing SNPs near PPP1R12B to be biased by sex (Galichon, Mesnard, Hertig, Stengel, & Rondeau, Reference Galichon, Mesnard, Hertig, Stengel and Rondeau2012). It is noteworthy that sex may influence methylation levels at so many autosomal sites (Liu et al., Reference Liu, Morgan, Hutchison and Calhoun2010).
Birth weight group differences in DNAm
Interest in the epigenetic correlates of early experience has expanded greatly in recent years. Several studies have now reported differential DNAm profiles in infants born preterm versus at full term (e.g., Cruickshank et al., Reference Cruickshank, Oshlack, Theda, Davis, Martino, Sheehan and Craig2013; de Goede, Lavoie, & Robinson, Reference de Goede, Lavoie and Robinson2017; Fernando et al., Reference Fernando, Keijser, Henneman, van der Kevie, Mannens, van der Post and Ris-Stalpers2015; Montirosso et al., Reference Montirosso, Provenzi, Giorda, Fumagalli, Morandi, Sirgiovanni and Borgatti2016). Furthermore, preterm differences in methylation appear to vary with the length of gestation in a dose-like manner, suggesting a functional relation between gestational age and DNAm (e.g., Lee et al., Reference Lee, Jaffe, Feinberg, Tryggvadottir, Brown, Montano and Goldman2012; Parets et al., Reference Parets, Conneely, Kilaru, Fortunato, Syed, Saade and Menon2013). Differences in DNAm may have important consequences for brain structure and behavioral regulation in individuals born preterm (Provenzi, Guida, & Montirosso, Reference Provenzi, Guida and Montirosso2018). For example, variance in methylation levels derived from saliva (e.g., Chau et al., Reference Chau, Ranger, Sulistyoningrum, Devlin, Oberlander and Grunau2014; Sparrow et al., Reference Sparrow, Manning, Cartier, Anblagan, Bastin, Piyasena and Evans2016) and cord blood samples (e.g., Montirosso et al., Reference Montirosso, Provenzi, Giorda, Fumagalli, Morandi, Sirgiovanni and Borgatti2016) has been associated with variation in fetal development of cerebral white matter (Sparrow et al., Reference Sparrow, Manning, Cartier, Anblagan, Bastin, Piyasena and Evans2016), socioemotional stress regulation capacity in infants (Montirosso et al., Reference Montirosso, Provenzi, Giorda, Fumagalli, Morandi, Sirgiovanni and Borgatti2016), and the severity of behavioral problems in children of preschool age (Chau et al., Reference Chau, Ranger, Sulistyoningrum, Devlin, Oberlander and Grunau2014). Finally, some methylation differences observed in preterm neonates remain detectable at 18 years (e.g., Cruickshank et al., Reference Cruickshank, Oshlack, Theda, Davis, Martino, Sheehan and Craig2013), and as late as retirement age (Tan et al., Reference Tan, Li, Frost, Nygaard, Soerensen, Larsen and Christiansen2018), suggesting that modifications to DNAm profiles may persist for decades. The importance of the present study resides in the fact that differential DNAm profiles were evident in adult men so long after their exposure to extreme early adversity, consistent with the notion that adverse early experience may be biologically embedded in the DNAm profiles of adults born extremely preterm (Meaney & Szyf, Reference Meaney and Szyf2005; Szyf & Bick, Reference Szyf and Bick2013).
Sex differences in DNAm and their interaction with birth weight status
Fetal sex is a relatively understudied, potential moderating variable in studies of prenatal stress (Conradt et al., Reference Conradt, Adkins, Crowell, Raby, Diamond and Ellis2018). The site-specific sex differences in DNAm levels reported here are congruent with previous studies of methylation differences in both preterm neonates (e.g., Cruickshank et al., Reference Cruickshank, Oshlack, Theda, Davis, Martino, Sheehan and Craig2013; Fernando et al., Reference Fernando, Keijser, Henneman, van der Kevie, Mannens, van der Post and Ris-Stalpers2015; Spiers et al., Reference Spiers, Hannon, Schalkwyk, Smith, Wong, O'Donovan and Mill2015), and typically developing adult populations (e.g., Inoshita et al., Reference Inoshita, Numata, Tajima, Kinoshita, Umehara, Yamamori and Ohmori2015; Liu et al., Reference Liu, Morgan, Hutchison and Calhoun2010; Xu et al., Reference Xu, Wang, Liu, Yu, Gelernter and Zhang2014). We extend these findings to adults born extremely preterm. Although DNAm profiles distinguished between ELBW and NBW adults poorly on the whole, they clearly distinguished between men by birth weight status. Notably, the number of sex differences in DNAm levels reported for the entire sample (affecting 9,182 CpG sites associated with 3,642 autosomal genes) was an order of magnitude greater than the differences associated with birth weight group status (affecting three CpG sites). Similarly, the number of differentially-methylated CpG sites in ELBW men relative to ELBW women (77,895 sites; 14,024 autosomal genes) was 22 times that of NBW men relative to NBW women (3,424 sites; 1,523 autosomal genes). The augmentation of sex differences in DNAm in the context of extreme early adversity suggests a potentially synergistic relation between effects of sex and birth weight status on adult DNAm profiles. In addition to differences in DNAm levels, the usual direction of the net difference in DNAm (hypermethylation in females: Inoshita et al., Reference Inoshita, Numata, Tajima, Kinoshita, Umehara, Yamamori and Ohmori2015; Xu et al., Reference Xu, Wang, Liu, Yu, Gelernter and Zhang2014; our NBW participants) was reversed in the ELBW group (hypermethylation in males). These findings highlight the need to examine and account for sex differences in studies that relate DNAm to functional psychological or physiological measures (Liu et al., Reference Liu, Morgan, Hutchison and Calhoun2010).
Eight of 45 ELBW adults (five men) had significant NSI, whereas none of the 47 NBW controls had NSI (difference, p < .01). An additional analysis was performed to test whether NSI in the ELBW group could have accounted for the DNAm differences between ELBW and NBW men. If birth weight group differences in men were confounded by NSI, one would expect to see large numbers of sites that distinguished ELBW men with NSI from the other two subgroups (NSI-free ELBW men, and NBW men). However, only four CpG sites differentiated among ELBW men with NSI, ELBW men who were NSI-free, and NBW control men, suggesting that NSI was not likely responsible for the birth weight group differences in men's DNAm profiles. Nonetheless, because of these four significant sites, it would be prudent to account for NSI in future studies.
Biological pathways associated with methylation differences
GO analyses of the differential DNAm patterns in ELBW and NBW men identified 212 significant GO terms that clustered in four major biological pathways: neuronal development, synaptic transportation, metabolic regulation, and cellular regulation (Figure 5). Repeated themes within the clusters included regulation of developmental and organ growth; cell morphogenesis (affecting axons, dendrites, and membrane assembly); cell differentiation and migration; synaptic localization, signaling, and transport; and regulation of cellular metabolic processes—fundamental processes in cellular biology that underpin physiological and psychological functioning.
Of the 80 CpG sites that were hypermethylated at TSS (gene promoters) in ELBW men relative to NBW men, absolute DNAm levels differed most at a CpG site in the promoter region of the leucine-rich repeat and Ig domain-containing protein 1 (LINGO1) gene (cg08128636, chromosome 15, beta difference = 0.14, p = 5.33E-05). The same CpG site was hypermethylated in ELBW men relative to ELBW women (beta difference = 0.12, p = 7.62E-05). An additional site in the LINGO1 promoter (cg11853771,beta difference = 0.09, p = 9.92E-04), and five other LINGO1 sitesin 5’UTR locations (cg03060253, cg07535447, cg11339488, cg11563498, cg15814399, all on chromosome 15, beta differences < 0.10) were also hypermethylated in ELBW men relative to ELBW women. One LINGO1 site (cg05043354) was hypomethylated at 5’UTR (chromosome 15, beta difference = −0.07, p < .012) in ELBW men versus ELBW women. In contrast, no CpG sites were identified as differentially methylated on any LINGO genes in NBW men versus NBW women.
The protein coded by LINGO1 is a functional component of the Nogo receptor signaling complex (RTN4R/NGFR), and an important regulator of multiple aspects of oligodendrocyte differentiation and axonal myelination during cortical development. Expressed exclusively in the central nervous system, it is especially abundant in the amygdala, hippocampus, thalamus, and cerebral cortex, regions intrinsically involved in psychosocial regulation, psychopathology, and cognition. Active myelination of neuronal axons in the brain by oligodendrocytes begins in the third trimester of pregnancy (weeks 28–30; Back et al., Reference Back, Luo, Borenstein, Levine, Volpe and Kinney2001), and extends into the second decade of adulthood. In infants born extremely preterm, oligodendrocyte maturation is impaired, contributing to myelination failure and white matter injury (Back et al., Reference Back, Luo, Borenstein, Levine, Volpe and Kinney2001; Nosarti et al., Reference Nosarti, Nam, Walshe, Murray, Cuddy, Rifkin and Allin2014; van Tilborg et al., Reference van Tilborg, Heijnen, Benders, van Bel, Fleiss, Gressens and Nijboer2016). Consistent with these findings, male preterm infants are reported to be more vulnerable than female preterm infants to both white matter abnormalities (Constable et al., Reference Constable, Ment, Vohr, Kesler, Fulbright, Lacadie and Makuch2008; Reiss et al., Reference Reiss, Kesler, Vohr, Duncan, Katz, Pajot and Ment2004; Skiöld et al., Reference Skiöld, Alexandrou, Padilla, Blennow, Vollmer and Ådén2014), and related cognitive difficulties (e.g., Constable et al., Reference Constable, Ment, Vohr, Kesler, Fulbright, Lacadie and Makuch2008). Intriguingly, most of the ELBW men (12/17) tested here were born at 27 weeks’ gestational age or less (median = 27), before late pre-oligodendrocyte progenitors typically mature and become myelin-producing, while more than half of the women (15/28) were born at 28 weeks’ gestation or more (median = 28)—putatively, after myelination had begun. Although the contrast in gestational age did not reach statistical significance in our sample (p = .19), it is noteworthy that most ELBW men were born before, and most ELBW women, after, the typical onset of this crucial developmental process. Our findings suggest that differential DNAm of CpG sites on LINGO1 genes with potential effects on myelination may be long-term legacies of the early developmental history of men born extremely preterm.
Strengths and limitations
One of the strengths of this study is the uniqueness of the cohort. ELBW neonates are potentially the most vulnerable of preterm survivors, and this cohort of ELBW and NBW control participants, born in the early days of neonatal intensive care, has been prospectively followed into the fourth decade of life. Another is the relative homogeneity of cell types in the tissue samples. Like other accessible human tissues (e.g., whole blood, saliva), buccal swabs may contain immune cells as well as epithelial cells. Here, 90% of the cells in the buccal swabs from adults were epithelial, with no significant differences by sex or birth weight group (cf. Theda et al., Reference Theda, Hwang, Czajko, Loke, Leong and Craig2018, for similar findings). The observed group differences were unlikely to be a consequence of differential cell composition. Additionally, birth weight and sex differences among subgroup DNAm profiles were probed statistically three different ways, yielding similar results. Finally, we investigated the nature of differences in adult DNAm profiles by identifying biological pathways potentially affected by extremely preterm birth using DAVID and two additional platforms (g:Profiler, and KEGG; Supplementary Tables 11, 12) to facilitate comparisons with other studies.
This study also has several limitations that warrant discussion. First, the sample size was restricted by the size of the original cohort, relatively high neonatal mortality within the cohort, and three decades of attrition. Attrition is common in longitudinal studies, particularly ones that span four decades. Despite this limitation, our sample was comparable to or larger than that of other recent studies of DNAm following preterm birth (e.g., de Goede et al., Reference de Goede, Lavoie and Robinson2017; Fernando et al., Reference Fernando, Keijser, Henneman, van der Kevie, Mannens, van der Post and Ris-Stalpers2015; Parets et al., Reference Parets, Conneely, Kilaru, Fortunato, Syed, Saade and Menon2013), including reports of sex differences in DNAm in infants (Sparrow et al., Reference Sparrow, Manning, Cartier, Anblagan, Bastin, Piyasena and Evans2016) and adults followed to age 18 years (Cruickshank et al., Reference Cruickshank, Oshlack, Theda, Davis, Martino, Sheehan and Craig2013). It was also sufficiently large to reveal interactive effects of sex and birth weight status on DNAm patterning.
Second, because extremely small size at birth may reflect one or both of two biological events, namely, truncated gestation (prematurity), and/or intrauterine growth restriction (IUGR) during gestational development, it is conceivable that SGA status, rather than birth weight status, could have accounted for a substantial proportion of the DNAm differences between ELBW and NBW men. An analysis by birth weight subgroups (ELBW-SGA, ELBW-AGA, and NBW) would be useful for testing this hypothesis. Here, because only three (17.6%) of the 17 adults with SGA status were male, and the other 14 were female, any significant results from such an analysis would be inconclusive. In addition, although 50% of the ELBW women were born SGA (n = 14), ELBW and NBW women differed at only two CpG sites, whereas ELBW and NBW men showed multiple differences in DNAm (1,354 sites), suggesting that effects of prematurity and IUGR should be carefully disentangled. In future studies, researchers would do well to analyze these subgroups separately.
Finally, the time span between the exposure of interest (extreme perinatal adversity) and the measurement of DNAm in adulthood was extensive, necessitating careful examination and caution in interpretation of the findings. Although cross-sectional data cannot speak to the timing of the appearance of DNA modifications, persistent changes in DNAm have now been demonstrated in multiple studies of adults who experienced various forms of early adversity (e.g., Heijmans et al., Reference Heijmans, Tobi, Stein, Putter, Blauw, Susser and Lumey2008; Loucks et al., Reference Loucks, Huang, Agha, Chu, Eaton, Gilman and Kelsey2016; McGowan et al., Reference McGowan, Sasaki, D'alessio, Dymov, Labonté, Szyf and Meaney2009; Suderman et al., Reference Suderman, Borghol, Pappas, Pereira, Pembrey, Hertzman and Szyf2014; Tobi et al., Reference Tobi, Slieker, Luijk, Dekkers, Stein and Xu2018; Wehkalampi et al., Reference Wehkalampi, Muurinen, Wirta, Hannula-Jouppi, Hovi, Järvenpää and Kajantie2013), consistent with hypothesized developmental programming.
Conclusions
Extremely small size at birth is thought to reflect the influence of intrauterine stresses that increase allostatic load in the developing fetus and may have implications for health in later life. Our results suggest that sex was associated with robust differences in genomic DNAm profiles in both birth weight groups, but that this effect was greatly magnified in males born extremely small. Within the ELBW group, putative effects of early adaptation to stresses associated with ELBW status were seen primarily in adult DNAm profiles of men, providing conditional support for developmental programming and the DOHaD hypothesis. While adult DNAm profiles suggest that vulnerability to environmental factors is generally enhanced in males, males with a history of extremely preterm birth and ELBW may be particularly sensitive to these factors—more sensitive than either females with similar birth histories, or other males.
It has been proposed that changes in DNAm may actively mediate the effects of adversity on downstream developmental outcomes (McGowan et al., Reference McGowan, Sasaki, D'alessio, Dymov, Labonté, Szyf and Meaney2009; Meaney & Szyf, Reference Meaney and Szyf2005; Tobi et al., Reference Tobi, Slieker, Luijk, Dekkers, Stein and Xu2018), even if they were adaptive in the short term (Matthews & McGowan, Reference Matthews and McGowan2019; Gluckman & Hanson, Reference Gluckman and Hanson2004b; Gluckman et al., Reference Gluckman, Hanson and Buklijas2010). Whether the methylation differences reported here reflect dysregulation in the long term will require additional study and discussion. In addition, practical questions of how differential DNAm patterns develop over time in adults born at ELBW, and whether they are linked to psychological well-being, healthspan, or lifespan, should be followed up in larger samples of this vulnerable population.
Supplementary Material
The supplementary material for this article can be found at https://doi.org/10.1017/S0954579420000899
Acknowledgements
This research was supported by grants from the Canadian Institutes of Health Research (CIHR) awarded to Louis A. Schmidt (CIHR Team Grant: TMH-103145; CIHR Operating Grant: IHDCYH-383548). Wilfred de Vega was supported by an Early Researcher Award from the Ontario Ministry of Innovation awarded to Patrick McGowan. We wish to express our thanks to Aya Sasaki for her assistance with cell deconvolution, to Sue McKee, Jordana Waxman, and Shirien Yunus for their help with data collection, and to the study participants and their families for their continuing participation in this work.