INTRODUCTION
Substantial achievements of breeding for improved grain yield in cereals have been demonstrated to result from marked alterations in plant stand structure, especially increased proportion of grain in the vegetative above ground biomass (Austin et al. Reference Austin, Bingham, Blackwell, Evans, Ford, Morgan and Taylor1980; Riggs et al. Reference Riggs, Hanson, Start, Miles, Morgan and Ford1981; Martiniello et al. Reference Martiniello, Delogu, Odoardi, Boggini and Stance1987; Perry & D'Antuono Reference Perry and D'Antuono1989; Peltonen-Sainio Reference Peltonen-Sainio1990), which is termed harvest index (HI). Improvements in HI of modern cultivars of oat (Avena sativa L.), wheat (Triticum aestivum L.) and barley (Hordeum vulgare L.) result from genetic changes in ability to yield grain at the expense of vegetative above-ground biomass. Shortening of straw, e.g. by introducing dwarfing genes with the aim of increasing lodging resistance, and the consequent reductions in the assimilate demands of an elongating stem, contribute to increase in HI. However, it has been demonstrated that HI has probably reached its optimum in many instances (Riggs et al. Reference Riggs, Hanson, Start, Miles, Morgan and Ford1981; Austin Reference Austin1982; Peltonen-Sainio Reference Peltonen-Sainio1991; Hay Reference Hay1995). Peltonen-Sainio (Reference Peltonen-Sainio1991) indicated that oat cultivars with extremely high HI of about 0·60 were not among the highest yielding ones. This emphasizes the complex nature of HI and its dependence on the balance between its components, vegetative biomass and grains. Furthermore, it can be hypothesized that HI and plant height are now not necessarily associated when only modern cultivars are compared.
Cultivar differences and improvements in HI are demonstrated by growing cultivars next to each other. This is important, as HI is prone to environmentally induced variation (Hay Reference Hay1995). As with grain yield, HI is determined over a long time period. This is likely to be one of the main reasons why HI is influenced by fluctuations in growing conditions and can be characterized as a responsive trait (Hay Reference Hay1995). Both low and high HI may result from either favourable or unfavourable growing conditions: the result is dependent on timing and duration of such periods. For example, high HI is recorded if pre-anthesis vegetative growth occurs in unfavourable conditions, but then grain filling is favoured by good weather, resulting in high grain weight. Such conditions are faced in northern Europe where conditions are often characterized by early summer drought and, as in Finland, only 0·35–0·60 of required precipitation for floret set is reached (Peltonen-Sainio, unpublished data). In contrast to this, low HI results when growing conditions and crop management are favourable prior to anthesis and therefore enhance vegetative growth and floret set, but are not favourable during grain-fill when there is terminal drought or severe pathogen infections as is also typical for Mediterranean-type climates (Sadras Reference Sadras2002).
Differences in tiller performance may contribute to alterations in HI caused by the environment. When tillers increase only vegetative above-ground biomass they evidently reduce HI, while in some cases tiller HI may be equal to that of the main shoot (Hay Reference Hay1995). Although tillering is species and cultivar dependent, the environment plays a profound role in modifying tiller performance (Darwinkel Reference Darwinkel1978; Simmons et al. Reference Simmons, Rasmusson and Wiersma1982). However, in the long days of northern growing conditions, tillers contribute only modestly to grain yield in spring cereals due to hormonal inhibition of tiller bud release (Peltonen-Sainio & Järvinen Reference Peltonen-Sainio and Järvinen1995). This is especially the case with oat and wheat, and to a lesser extent with barley (Mela & Paatela Reference Mela and Paatela1974; Peltonen-Sainio & Järvinen Reference Peltonen-Sainio and Järvinen1995; Rajala & Peltonen-Sainio Reference Rajala and Peltonen-Sainio2002). Any early summer drought is also apt to depress tiller growth in northern Europe. Therefore, tillers might be involved in making HI less stable.
As no comprehensive experiments have been arranged to analyse HI in northern growing conditions of Europe, the aim of the present study was to characterize the genetic variation in HI among spring cereal cultivars relative to that brought about by the northern environment and to evaluate whether HI still explains the differences in grain yield when only modern cultivars, adapted to grow at high latitudes, are compared. An additional aim was to monitor traits associated with or contributing to variation in HI, including the role of tillers.
MATERIALS AND METHODS
Plant material and experimental design
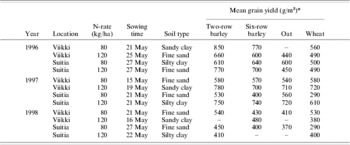
Field experiments were conducted in 1996–98 at two locations in southern Finland: at the Viikki (60°13′N) and Suitia (60°11′N) Experimental Farms of the University of Helsinki. At both locations, two different experimental sites were used in each year, differing in soil type and nitrogen fertilizer application rate (Table 1). At each site, spring cereal species, viz. two-row barley, six-row barley, oat and wheat, were each arranged in a separate sub-experiment, next to each other. A randomized complete block design with three replicates was employed. Plant material comprised 12 two-row barley cultivars (Inari, Kinnan, Kustaa, Kymppi, Mette, Mie, Prisma, SW LH 91355, Saana, Thuringia, Tyra and Viivi), 10 six-row barley cultivars (Arra, Artturi, Arve, Botnia, Erkki, Loviisa, Pohto, Pokko, Rolfi and Thule), 10 oat cultivars (Aarre, Belinda, Freja, Katri, Kolbu, Roope, Salo, Veli, Virma and Yty) and 11 wheat cultivars (Attis, Bastian, Devon, Heta, Kadett, Mahti, Manu, Reno, Runar, Satu and Tjalve) in each experiment.
Year, location, nitrogen fertilizer application rate, sowing time, soil type and mean grain yield for each cereal species in field experiments

* line indicates missing value (the sub-experiment was discontinued due to heavy lodging).
Plots were 10 m2 (8 m×1·25 m) and sowing density was 500 viable grains/m2 for oat and barley and 650 for wheat, as commonly used in Finland. Weeds were controlled with MCPA ((4-chloro-2methylphenoxyl) acetic acid) at a rate of 600 g/ha and dichlorprop at 600 g/ha, and diseases with propiconazole at a rate of 125 g/ha when needed.
Sampling and measurements
Collection of plant samples and measurements taken were standard across all experiments. Completely lodged trials, due to, e.g. heavy rains, were discarded as shown in Table 1. Days to heading were recorded as being when half of the heads on each plot were fully emerged from the leaf sheath. Plant height (mm) and the proportion of the plot area lodged (not included in statistical analyses; completely lodged experiments were discontinued) were recorded close to yellow ripeness. Days to maturity were recorded when plant stands had turned yellow. The length of the grain filling period (d) was measured by deducting days to heading from days to maturity. Prior to harvesting, samples of 40 uprooted plants were collected from each plot and the following yield components were recorded after drying at room temperature to constant moisture content: (1) phytomass per plant (g/plant), per main shoot (g/main shoot) and of tillers (g/tillers), (2) vegetative phytomass per plant (g/plant), per main shoot (g/main shoot) and of tillers (g/tillers), (3) total weight of grains per plant (g/plant), per main shoot (g/main shoot) and of tillers (g/tillers), (4) HI by dividing grain yield per plant by phytomass, (5) number of tillers per main shoot at maturity, (6) number of head-bearing tillers per main shoot at maturity, (7) single grain weight (mg), (8) mean head filling rate (HFR, mg/head/d), obtained by dividing grain yield per head by length of grain filling period, (9) mean grain filling rate (GFR, mg/grain/d), obtained by dividing single grain weight by length of grain filling period and (10) number of grains per main shoot head (only in wheat and oat that produce grain yield almost entirely on the main shoot). The number of plants/m2 were measured at maturity by counting the plants in 0·5 m row three times per plot. Grain yield was measured after harvest (g/m2 at 0·15 grain moisture), and test weight (kg) measured from pre-purified grain material. To study the role of tillers, HI was measured separately for main shoot and tillers by dividing their grain yield by phytomass.
Statistical analyses
For all 12 experiments (3 years, two locations, both with two nitrogen regimes), randomized complete block designs with three blocks were used. The statistical model for each species and for each original variable was:

where y ijk is the observation, μ is the overall mean, Experimentj is the experiment effect, Block(Experiment)jk is the effect of block within experiment, Cultivari is the cultivar effect, (Cultivar×Experiment)ij is the cultivar-by-experiment interaction and εijk is the residual error. Block within experiment and the residual error were assumed to be random in the model. The random effects Block(Experiment)jk and εijk are assumed to be independent and normally distributed with zero means and variances σB2 and σ2, respectively. The parameters of the model were estimated by the residual maximum likelihood (REML) method using the MIXED procedure of the SAS system (version 8.2). The adequacy of the model was checked through graphic analysis: box plot of residuals to test the normality and plots of residuals and fitted values to test the constancy of error variance. Normality was achieved after square root or log-transformation of some variables (e.g. HFR, phytomass, vegetative phytomass and grain yield per tillers and number of tillers per main shoot). In these cases, all presented estimates were transformed to the original scale.
Principal component analysis (PCA) is a multivariate technique which can be used to identify groups of variables that are statistically interrelated and which otherwise might go undetected. Therefore, in the current study PCA with the varimax rotation method was carried out to reduce the number of variables and to detect structure in the relationships between variables. Analysis was carried out separately for each species using the FACTOR procedure of the SAS System. Four factors were selected in each analysis based on the scree-test (Cattell Reference Cattell1966). In order to simplify the methodology, variables were interpreted according to their loadings on these four most important factors: variables having high loadings on the same factor could be grouped. A new score was calculated for each selected variable and multiplied by its coefficient and termed a factor score. Factor scores were calculated for all field plots if the HI had high loading for the principal factor. Subsequently factor scores were analysed using the same statistical model used for the original variables to compare cultivars and experiments.
The results of the analysis of original variables and factor scores included the mean values for all experiments. According to these means, two experiments with the lowest means and two experiments with highest means were selected. These four experiments were analysed using the same model used for all experiments. In addition, the difference between contrasting experiments was calculated for all cultivars and these differences were compared to identify the most stable cultivars.
The experiment type had large influence on the mean level of HI and grain yield. Therefore, relationship between variables will be based on the within-experiment variation. To utilize all the data simultaneously, experiment-free data was created from original data by removing the mean effect of the experiment found at the initial analysis. Association between HI and grain yield was then examined using 95% confidence ellipses of the new data.
RESULTS
Within each cereal species, all cultivars and experiments (environments) differed significantly in HI (P<0·001); significant cultivar×environment interaction was also recorded (P<0·001, except P<0·005 in oat). This was also true, in most cases, for other traits studied. When measuring HI separately for main shoot and tillers, all environments and also cultivars differed, except in tiller HI for six-row barley (P<0·07). Cultivar×environment interaction was also significant, except for main shoot HI in two-row barley (P<0·08) and tiller HI in oat (P<0·07) and wheat (P<0·20).
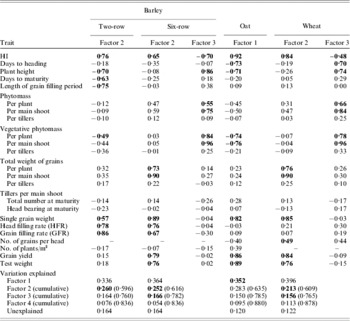
The HI was highest in six-row barley, averaging 0·55 (s.e.=0·002), while the means for two-row barley, oat and wheat were 0·52 (s.e.=0·002), 0·46 (s.e.=0·002) and 0·40 (s.e.=0·001), respectively. The PCA showed that HI had high loadings in one or two first factors depending on cereal species. When 10 oat cultivars were analysed in nine environments, HI was included in factor 1 with the highest loadings of all traits analysed (Table 2). Similarly, the HI of two-row barley got high loadings only for one factor, while in wheat and six-row barley two factors included HI. All the species dependent traits having significant positive or negative association with HI are shown in bold in Table 2. Plant height and vegetative phytomass were negatively associated with HI in all species.
Loadings of traits studied for factors including HI according to PCA and explained variation in spring sown two- and six-row barley, oat and wheat. The highest loadings that were further evaluated are shown in bold

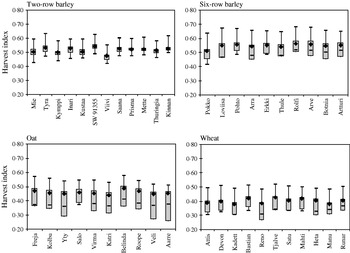
Tiller HI was very close to that of the main shoot especially in two-row barley, which also tillered most (Fig. 1). Comparison of species indicated that tiller heads produced 0·10 (s.e.=0·004), 0·12 (s.e.=0·004), 0·15 (s.e.=0·004) and 0·37 (s.e.=0·003) of total grain yield in oat, wheat, six-row barley and two-row barley, respectively, and the corresponding figures for contribution of tillers to total vegetative phytomass averaged 0·14 (s.e.=0·004), 0·16 (s.e.=0·004), 0·18 (s.e.=0·005) and 0·40 (s.e.=0·003). Ranking of species according to both of these figures were relatively parallel, but nevertheless the ratio between the role of tillers in grain production compared with vegetative phytomass production differed (0·59 (s.e.=0·012), 0·73 (s.e.=0·010), 0·78 (s.e.=0·021) and 0·92 (s.e.=0·005) for oat, wheat, six-row barley and two-row barley, respectively). Therefore, the marked differences in HI among species could have been partly attributable to differences in their tiller performance.
Variation in HI for each species and cultivar, shown as vertical bars, based on comparison of two most contrasting experiments. Vertical bars are shown in order from the most unstable to the most stable two-row barley (s.e.d.=1·10), six-row barley (s.e.d.=1·34), oat (s.e.d.=1·48) and wheat cultivars (s.e.d.=0·99). The boxes indicate difference between main shoot and tiller HI for two-row barley (s.e.d.=1·26), six-row barley (s.e.d.=2·27), oat (s.e.d.=2·15) and wheat (s.e.d.=1·75). Main shoot HI was always higher than that of tillers. Mean HI for each cereal cultivar over all experiments is indicated by a black square.

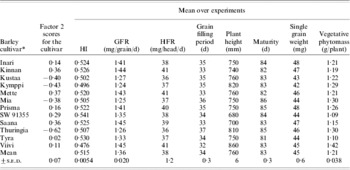
Within each species, factor scores for different cultivars and environments differed. For example, two-row barley cultivars Kustaa, Kymppi, Mia and Thuringia had the lowest factor 2 scores and their relatively low HI associated with low grain and HFR, late maturation with prolonged duration of grain filling and relatively high total vegetative phytomass and plant height (Table 3). Kinnan and Saana were characterized by contrasting trait compositions.
Factor scores for different two-row barley cultivars for factor 2 and means over experiments for traits having with loadings according to PCA

* s.e.d.: standard error of difference.
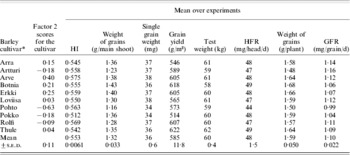
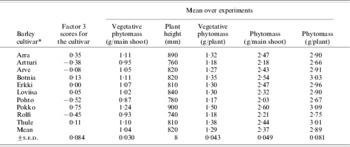
In six-row barley, two factors included HI. Traits that associated positively with HI were grouped for factor 2 and those with a negative association for factor 3. Arve and Pohto were characterized as the most divergent barley cultivars according to traits emphasized in factor 2, but interestingly they both had very high HI (Table 4), while Pokko contrasted with trait means in Pohto for factor 3 (Table 5).
Factor scores for different six-row barley cultivars for factor 2 and means over experiments for traits with highest loadings according to PCA

* s.e.d.: standard error of difference.
Factor scores for different six-row barley cultivars for factor 3 and means over experiments for traits with highest loadings according to PCA

* s.e.d.: standard error of difference.
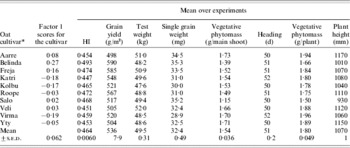
The oat cultivar Belinda was exceptional (Table 6) and it had the highest HI, grain yield and single grain weight, but the lowest test weight and below average vegetative phytomass and plant height. The oat cultivars showing most contrast to Belinda, according to factor 1 scores, were Virma, Katri and Kolbu.
Factor scores for different oat cultivars for factor 1 and means over experiments for traits with highest loadings according to PCA

* s.e.d.: standard error of difference.
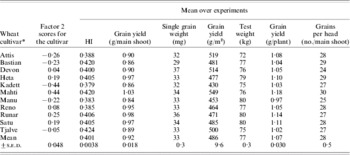
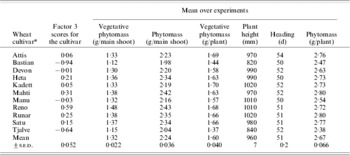
In wheat, two factors had high loadings for HI. As for six-row barley, factor 2 included traits positively associated with HI, while factor 3 emphasized traits having negative associations with HI. Kadett had the most negative and Mahti the most positive score in factor 2 (Table 7). Kadett had exceptionally low HI and other traits were also below average, while in Mahti all traits were above average or maximal except test weight. Bastian and Tjalve had the most negative scores factor 3 scores and Reno the most positive (Table 8). The low HI of Reno was associated with exceptionally high main shoot vegetative and total phytomass as well as above average total and vegetative phytomass per plant and plant height. Bastian and Tjalve, however, exhibited the lowest means for all the traits negatively associated with HI, except days to heading.
Factor scores for different wheat cultivars for factor 2 and means over experiments for traits with highest loadings according to PCA

* s.e.d.: standard error of difference.
Factor scores for different wheat cultivars for factor 3 and means over experiments for traits with highest loadings according to PCA

* s.e.d.: standard error of difference.
The experiments were characterized by significant differences in scores for factors including HI; hence, stability of HI was estimated. For two-row barley, the experiments with the lowest HI means were 0·135 lower than those of the highest, while in six-row barley, oat and wheat the means differed by 0·173, 0·171 and 0·169, respectively. Also main shoot and tiller HI differed least in two-row barley (Fig. 1). In general, mean HI was always closer to main shoot HI than that of tillers, except in two-row barley. In species other than two-row barley, the mean tiller HI of each cultivar was often lower than mean HI for that cultivar in the experiment characterized by the lowest HI. Cultivar mean for main shoot HI correlated positively with that for tiller HI in all species. The slope was 0·95 for two-row barley (R 2=0·79), 0·77 for six-row barley (R 2=0·39), 2·18 for oat (R 2=0·55) and 1·26 for wheat (R 2=0·60).
From two-row cultivars, difference in HI between tillers and main shoots was especially high in Mie and Tyra (Fig. 1). These two cultivars contrasted, however, in the sense that Mie had the lowest and Tyra the highest HI in the two environments that differed most with respect to HI. Tyra was also characterized as a cultivar with one of the largest differences in HI when measured on main shoot and tillers separately. Regarding six-row barley, HI of Pokko and Loviisa differed most, while Artturi was a cultivar exhibiting the least difference in HI when the two most contrasting experiments were compared. Pohto differed from Arve and Botnia by having tiller HI closest to that of the main shoot. In oat, HI of Freja differed most and HI of Aarre least in contrasting environments. Aarre had the lowest HI of all in growing conditions that favoured high HI. Aarre and Veli were characterized by main shoot HI differing most from that of tillers in contrast to Salo. In wheat, Attis had the greatest and Runar least difference in HI when compared in contrasting experiments (Fig. 1). These results were consistent with those from a Finlay–Wilkinson stability analysis. For example, the slope was highest for Mie (1·15) and Tyra (1·22) in the analysis of two-row barley. Regarding six-row barley, Pokko (1·22) and Loviisa (1·15) were sensitive, while Artturi (0·84) was stable. In oat, Freja (1·14) proved to be sensitive, while Veli (0·84) and Aarre (0·85) were stable. In wheat, Attis (1·16) and Kadett (1·13) had the greatest slope, while the lowest (0·92) were found for Runar and Satu.
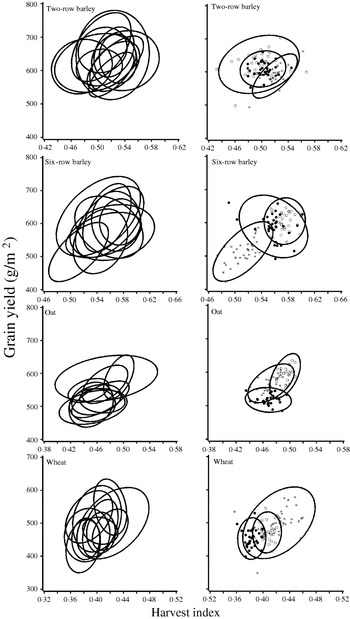
Grain yield and HI were closely associated in the PCA for all cereals except two-row barley. To further characterize this association, 95% confidence ellipses were drawn for each cultivar to show the variation among experiments. In all cereal species, very different combinations of HI and grain yield were found in the cultivars studied, as indicated by differences in size, shape and angle of the ellipses (Fig. 2). For example, the degree of variation in HI was substantial in two-row barley, but ellipses were frequently horizontal. Mette was an example of a barley cultivar that differed from the general tendency, as an increase in HI resulted in increased grain yield. Contrary to this, grain yield in Kustaa and Kymppi was independent of HI. The size, shape and angle of the ellipses for six-row barley cultivars were even more divergent than for two-rowed cultivars. Pokko combined low HI and grain yield, but exhibited strong positive association between them (similar to Botnia, Erkki, Loviisa and Thule). In contrast, even major changes in HI did not contribute to grain yield in Arve. Artturi was, however, an exception among all the other six-row cultivars through an association of higher HI with lower grain yield. Oat cultivars responded differently (Fig. 2). The cultivars Salo and Belinda were very contrasting. Ellipses of different wheat cultivars varied substantially. Many of them were upright, as for Manu and Runar. In contrast, values for Tjalve were exceptionally scattered and indicated a positive association between HI and grain yield.
Phenotypic variation in and association between HI and grain yield shown with 95% confidence ellipses. All associations within each cereal species are indicated on the left-hand side and three differently performing example cultivars with scatter values are shown on the right-hand side. For two-row barley the closed symbol is Kustaa, the open Kymppi and the asterisk Mette. For six-row barley they represent Artturi, Arve and Pokko, for oat Salo, Belinda and Freja and for wheat Manu, Runar and Tjalve, respectively.

DISCUSSION
Comparison among species and cultivars
The present study included only modern spring cereal cultivars and, therefore, HI was relatively high overall. When comparing the means of different cereal species, results indicated that modern six-row barley cultivars had the highest mean HI (0·55), which exceeded that of two-row barley by about 0·04, oat by 0·09 and wheat by even 0·15 (Tables 3, 4, 6 and 7). Therefore, especially in wheat, some additional genetic gains in grain yield are likely to be possible through continued selection for higher HI.
Variation in tillering performance is evidently one of the most striking differences in plant stand structure among the studied spring cereal species grown at high latitudes (Mela & Paatela Reference Mela and Paatela1974; Peltonen-Sainio & Järvinen Reference Peltonen-Sainio and Järvinen1995; Rajala & Peltonen-Sainio Reference Rajala and Peltonen-Sainio2002). Differences in tiller number and tiller yield are also likely to be emphasized at high latitudes, as long days inhibit tillering, favour main shoot dominance and uniculm growth performance (Michael & Beringer Reference Michael and Beringer1980). For oat, every fourth, and for wheat and six-row barley, every third, plant carried one tiller head, while in two-row barley almost one tiller head was produced on each main shoot. Hence, when comparing cereal species, differences in HI and tiller productivity were quite parallel. Further analyses indicated that, tiller HI was very close to that of the main shoot especially in two-row barley, which also tillered most (Fig. 1). However, the ratio between tiller role in total grain production compared with that in vegetative phytomass differed among species. Hence, it was concluded that marked differences among species in HI were possibly only partly attributable to differences in their tiller performance.
The traits contributing to or associated with HI according to PCA were similar, but also partly species dependent. Results from PCA also supported the conclusion of a negligible contribution of tillers to HI, as none of the traits characterizing tiller performance associated HI in any of the cereal species (Table 2). Despite only modern cultivars being investigated (the oldest was released in the 1980s), plant height still contributed negatively to HI and grain yield in species. This was also evident when comparing trait composition of cultivars that had opposite loadings, as shown in Tables 3, 5, 6 and 8.
Vegetative phytomass per plant and single grain weight were also traits that were associated with HI in all species, the former negatively and the latter positively (Table 2). The association between vegetative phytomass and HI appears obvious. However, grain yield had high, contrasting loadings with phytomass only for oat. This might indicate that breeders have not increased grain yield at the expense of vegetative above-ground biomass, but have managed to combine these, while keeping HI at an adequate level (Riggs Reference Riggs, Needham, Archer, Sylvester-Bradley and Goodlass1984; Peltonen-Sainio Reference Peltonen-Sainio1990). The positive association of single grain weight with HI and grain yield (except in two-row barley, Table 2) demonstrated that even though grain number is the major determinant of grain yield (Fischer Reference Fischer1985; Slafer & Andrade Reference Slafer and Andrade1989, Reference Slafer and Andrade1991; Garcia del Moral et al. Reference Garcia del Moral, Garcia del Moral, Molina-Cano and Slafer2003) also in northern growing conditions (Peltonen-Sainio et al. Reference Peltonen-Sainio, Kangas, Salo and Jauhiainen2007), grain weight also plays an important, though often secondary, role in yield formation in the spring cereal species studied. It is also an essential trait for the cereal processing industry for malting, milling and flaking. When comparing cultivars with different scores for factors exhibiting high HI loadings (Tables 3, 4, 6 and 7), cultivars with high factor scores invariably tended to have above average single grain weight in contrast to cultivars with low factor scores.
When number of grains per main shoot head was monitored in wheat and oat, PCA resulted in weaker association between grain number and HI than single grain weight and HI. Possibly the role of grain weight was emphasized more compared with grain number in the present study, as only modern, high-yielding cultivars were included that derived from breeding programmes which aimed at selecting high grain number to enhance yield potential (Table 2). It also appears that increase in head grain number in oat was associated with reduced single grain weight, while for wheat cultivars the increase in one yield component did not necessarily cause reduction in another. This may partly result from the oat panicle being very responsive to favourable conditions at floret set (Peltonen-Sainio Reference Peltonen-Sainio, Hamel and Smith1999). On the other hand, Calderini et al. (Reference Calderini, Dreccer and Slafer1995) showed that wheat cultivars released after 1987 had a similar number of grains/m2 with a higher single grain weight than their predecessors. The head grain number in wheat, however, seemed to be of a more complex nature according to the results of these experiments, as it is associated with grain yield, but not when combined with traits characterizing high vegetative growth.
In barley, mean grain and HFR was associated with high HI, but not in oat and wheat (Table 2). Possibly these traits were emphasized in barley and especially six-rowed barley, as it matures relatively early under northern growing conditions. In two-row barley, grain and HFR were in negative relationship with days to maturity and length of grain filling period, which indicated that cultivars with high HI tended to be early maturing, but they exhibited high rates of grain and head filling. This is supported by the finding that trait composition for two-row barley cultivar Thuringia contrasted with that of Kinnan and Saana (Table 3).
Phenotypic comparison and stability
Although genotypic comparisons using PCA indicated that HI was associated with grain yield, except in two-row barley, phenotypic analysis revealed that increase in HI due to growing conditions favouring high HI did not necessarily contribute positively to grain yield. Figure 2 shows surprisingly large variation in size, shape and angle of the 95% confidence ellipses drawn for each cultivar on the basis of variation recorded in the field experiments.
The degree of variation in HI and grain yield was great among cultivars of different species as illustrated in Fig. 2. Ellipses often were near horizontal, indicating that grain yield was quite independent of variation in HI caused by environment. However, in some wheat cultivars (Manu and Runar) they were exceptionally upright. In all cereal species several cultivars with quite narrow ellipses and angles of about 45° were detected, indicating positive phenotypic correlation between HI and grain yield (e.g. for Mette, Pokko, Belinda and Satu). Contrary to this, ellipses indicating a negative association between HI and grain yield, were detected (e.g. for Artturi, Fig. 2). All these examples indicate that environments favouring high HI do not necessarily result in increased grain yield and thereby, high HI does not always reflect yield formation favouring growing conditions.
As shown with many examples in Fig. 2, scattered values for HI and grain yield varied substantially depending on cultivar (compare e.g. Tjalve to Manu and Runar, and Kymppi to Mette and Kustaa). This can be regarded as an approximate demonstration of differences in stability in these traits as all cultivars within each species were grown in the same experiments. Differences among cultivars in stability of HI were also further analysed. Two-row barley exhibited somewhat less variation in HI than the other species (Fig. 1). Within all cultivars statistically significant differences in stability of HI were recorded when comparing the most contrasting environments. These results were very consistent with those from a Finlay–Wilkinson stability analysis (Finlay & Wilkinson Reference Finlay and Wilkinson1963). Despite this, differences among cultivars were rather small and none of the cultivars studied were exceptionally stable or unstable regarding HI. The difference between the most contrasting cultivars was less than 0·10 at most, with the more stable cultivars tended to have higher values under conditions of low HI compared with less stable cultivars. Oat was the only exception to this tendency, as the more stable cultivars tended to have somewhat lower HI compared with less stable ones. For six-row barley, more stable cultivars seemed to have even higher mean HI, when the means over all experiments were compared (Fig. 1). Differences in stability in HI seemed to be independent of tillering performance in the cultivars studied. Oat was the only exception, as the most stable cultivars, Aarre and Veli, showed significantly higher difference between main shoot and tiller HI, when compared with the significantly less stable Freja and Kolbu.
The main conclusion from the present work was that even among relatively modern, short-strawed cereal cultivars, HI still associated negatively with plant height. It is likely that, contrary to other cereals, still exceptionally low HI of wheat cultivars adapted to northern growing conditions can be further increased to enhance productivity. However, selection for high HI is challenging as additional shortening of straw is not necessarily profitable and direct selection for HI hindered by environmental effects masking the potential genotypic superiority.
We are grateful to Markku Tykkyläinen, University of Helsinki, Department of Applied Biology for his help in organizing all the field experiments. Raili Harlin and Sinikka Vainio-Haapala are acknowledged for their assistance in analysing yield components.