I. INTRODUCTION
As the lightest of the commercially available structural metals, magnesium (Mg) alloys have increasingly attracted scientific interest for potential applications in automotive and aerospace applications to reduce the weight associated with conventional aluminum (Al) or steel components. Reference Mordike and Ebert1,Reference Park and You2 Currently, alloys based on the Mg–Al system, especially AZ31, are the most widely used wrought alloys in commercial applications due to its excellent combination of strength and ductility at ambient temperature. However, the AZ31 alloys exhibit poor microstructural stability and low strength retention characteristics at elevated temperatures. Reference Vogel, Kraft and Arzt3,Reference Gao, Zhu, Muddle and Nie4 Therefore, there is clearly a need to further improve the mechanical properties through the development of new Mg alloys. Reference Park, Jung, Kim and You5,Reference Estrin, Nene, Kashyap, Prabhu and Al-Samman6
Among many possibilities, alloying is considered as an effective method to further modify the properties. Rare-earth elements (REs) are usually a pervasive choice under many circumstances for their unique roles in alloys. It has been recently reported that extruded Mg–Gd–Y based alloys Reference Homma, Kunito and Kamado7,Reference Jian, Cheng, Xu, Yuan, Tsai, Wang, Koch, Zhu and Mathaudhu8 exhibit a yield strength of 473–575 MPa, an ultimate strength of 542–600 MPa, and an elongation of 5.2–8.0% in tension. However, the necessary addition of more than 10 wt% of Gd and Y inevitably leads to a high cost, which has so far restricted their wide-spread application. To address the deficiency, efforts have been put to replace REs by (with) other elements. In recent years, the effect of Ag on Mg-based alloys has been widely investigated. Trace addition of Ag is well known to accelerate the aging hardening response, and the resulting precipitation hardening is one mechanism of strengthening that may be utilized in both cast and wrought alloys to further improve the strength of the alloys. Nie et al. Reference Gao and Nie9,Reference Zhu, Morton and Nie10 indicated that additions of certain amount of Ag to Mg–Gd and Mg–Y–Zn alloys could further result in a remarkable mechanical properties increase during isothermal aging, because of the dense distribution of fine basal and/or prismatic precipitate plates in the microstructure that are not observed in the Ag-free alloys. Park et al. Reference Park, Lim, Eliezer and Shin11 suggested that the addition of Ag into Mg–Zn alloys could increase the tensile strength in a double aging treatment. Trace Ag addition not only contributes to age-hardening process, but also significantly enhances the grain refinement and obtains superior mechanical properties at elevated temperatures. Movahedi-Rad et al. Reference Movahedi-Rad and Mahmudi12 proved trace addition of Ag could retain the strength of extruded Mg–Gd–Y–Zr alloy at high temperatures. Ben-Hamu et al. Reference Ben-Hamu, Eliezer, Kaya, Na and Shin13 found that addition of Ag (about 1–2 at.%) led to better grain refining. In contrast to the mean grain size of 8 μm in the alloy without Ag, the mean grain size decreased to 5 μm with 1 at.% Ag addition, and to 2 μm with 2 at.% Ag addition.
Furthermore, solute can affect interfacial mobility through grain boundary segregation and the formation of atomic clusters. Reference Humphreys and Hatherly14,Reference Grey and Higgins15 When the atomic size of solute is much larger than Mg (more than 10% in diameter), the solute strongly tends to aggregate at grain boundaries and (or) any other defect sites to reduce the size misfit energy in the Mg matrix. During hot deformation, the dynamic recrystallization (DRX) mechanism can be changed by sufficient grain boundary drag, which may finally change the final wrought texture. Reference Hadorn, Hantzsche, Yi, Bohlen, Letzig, Wollmershauser and Agnew16 DRX mechanisms can be commonly distinguished as either continuous or discontinuous. A number of workers Reference Galiyev, Kaibyshev and Gottstein17–Reference Cram, Fang, Zurob, Bréchet and Hutchinson19 have identified the behavior of conventional discontinuous DRX (DDRX) in Mg alloys, which involves the development of high-angle grain boundaries (HAGBs) through the formation of nuclei and growth of new grains. In contrast, the continuous DRX (CDRX) is partly a dynamic recovery process, which is based on continuous absorption of dislocations in sub-grain boundaries followed by the formation of new grains separated by HAGBs. Reference Sakai, Belyakov, Kaibyshev, Miura and Jonas20,Reference Beer and Barnett21 It has been suggested that the solute segregation at grain boundaries is responsible for the strong suppression of DRX in Mg–Y alloys. Reference Farzadfar, Martin, Sanjari, Essadiqi and Yue22 Apart from grain boundary drag, second-phase particles can more or less affect the deformation behavior of Mg alloys, according to different particle sizes, spacings and mass fractions. For example, coarse particles are adopted to promote DRX and change texture via particle stimulated nucleation of DRX (PSN) on purpose. Reference Humphreys and Hatherly14 On contrary, finely distributed stable particles are adopted to prevent DRX or grain growth via the Smith–Zener pinning effect. Reference Smith23
While previously reported Mg alloy systems with trace Ag addition have mainly addressed the effects of Ag addition on microstructural variations and aging hardening behaviors, few works have been done to study the effects of trace Ag addition on DRX, texture, and mechanical properties in Mg–3Al–1Zn alloy. In this study, ultrafine-grained Mg–3Al–1Zn alloys with different Ag content in the range of 0–2 wt% are successfully fabricated by mechanical milling, hot-press consolidation followed by extrusion. The effects of Ag variations on DRX, texture and mechanical properties of as-extruded Mg–3Al–1Zn alloys are discussed.
II. EXPERIMENTAL PROCEDURES
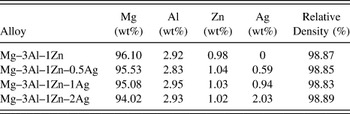
Commercially available powders of Mg (99% purity, ∼74 μm), Al (99.8% purity, ∼40 μm), Zn (99.7% purity, ∼45 μm), and Ag (99.9%, 3 μm) were used as the raw materials. Elemental powders were blended to formulate a composition of Mg–3Al–1Zn–xAg (x = 0, 0.5, 1 and 2 wt%). The blended powder was mechanically milled for 30 h under an inert gas atmosphere (argon) in a planetary ball mill (QM-2SP12, Nanjing NanDa Instrument Plant, Nanjing, China) at room temperature, using a rotational speed of 360 rpm. Hardened stainless steel balls (6 mm/10 mm/20 mm diameter) were used as milling media at a ball-to-charge ratio of 30:1. After milling, the powder was shielded using an Al container of 52 mm in outer diameter and about 63 mm in length, which was mainly used to improve the hydrostatic pressure and further increase the density of as-extruded samples. To prevent the powder from oxidation, these experimental materials were always kept in a glove box filled with pure argon (99.9%). The cans were then sintered for 30 min at 573 K and then pressed under the load of 225 MPa in a sintering furnace under vacuum better than 1 × 10⁻³ Pa. The sintered compacts were extruded at 473 K, under an extrusion ratio 8.35 and an extrusion rate 17 mm/s using graphite as lubricant. The as-extruded Mg–3Al–1Zn–xAg (x = 0–2 wt%) samples, 18 mm in diameter, were ultimately obtained. The detailed schematic diagram of fabrication was illuminated elsewhere. Reference Feng, Sun, Li, Li, Zhang, Fang and Fang24 The relative density of as-extruded alloys was measured based on Archimedes' principle. Three randomly selected samples were tested for each test and the average density was calculated. The real compositions of the investigated alloys were determined by inductively coupled plasma-optical emission spectrometry (ICP-OES). For convenience, the real compositions and relative densities of as-extruded samples were listed in Table I.
The real compositions and relative densities of as-extruded Mg–3Al–1Zn–xAg (x = 0–2 wt%) alloys.

The phase identification of the investigated alloys was carried out using x-ray diffraction (XRD) with Cu Kα radiation, and each XRD experiment was carried out three times. The microstructures of the samples were observed using a field emission scanning electron microscope (FESEM; Quanta FEG200, FEI Company, Hillsboro, Oregon). The detailed microstructures were further performed with a FEI Tecnai F30 transmission electron microscopy (TEM; FEI Company) equipped with an energy dispersive x-ray spectroscope (EDX) operating at 300 kV. The grain sizes of all the samples were estimated using a linear intercept method based on SEM and TEM micrographs, and two hundred grains were measured for each sample with different Ag content. The texture components of as-extruded alloys were measured by XRD using the Schulz reflection method. The obtained pole figures were analyzed by X'Pert texture software. The observed direction for all XRD tests was parallel to the extrusion direction (ED).
Tensile and compression tests of the longitudinal direction of as-extruded alloys were conducted at room temperature with an initial strain rate of 1.0 × 10⁻³ s−1. The dog-bone shaped specimens with a diameter of 3 mm and gage length of 10 mm were used for tensile tests, and cylindrical compressive specimens with a diameter of 6 mm and height of 9 mm were used for compressive tests. To ensure the repeatability of the data, each experiment was conducted at least three times.
III. RESULTS AND DISCUSSION
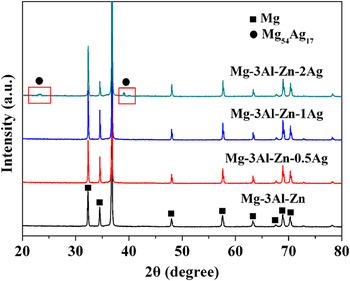
Figure 1 shows the XRD diffraction patterns of as-extruded Mg–3Al–1Zn–xAg (x = 0–2 wt%) alloys. For Mg–3Al–1Zn–xAg (x = 0–1 wt%) alloys, all diffraction peaks are easily indexed to hexagonal Mg phase. No peaks for other phases can be detected, which indicates that the Al, Zn, Ag elements approximately dissolve into the Mg matrix. In contrast, as the content of Ag rises to 2 wt%, some other weak peaks are detected, which are identified as Mg54Ag17 phase.
XRD diffraction patterns of as-extruded Mg–3Al–1Zn–xAg (x = 0–2 wt%) alloys.

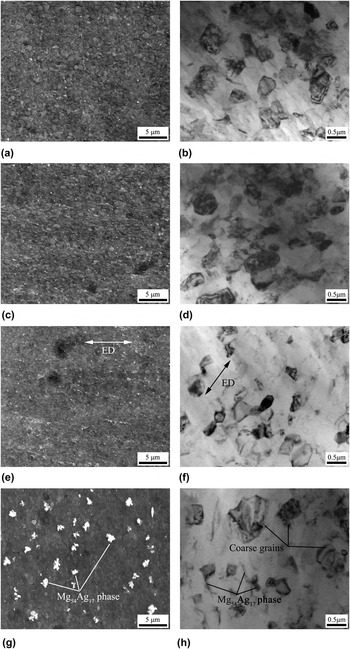
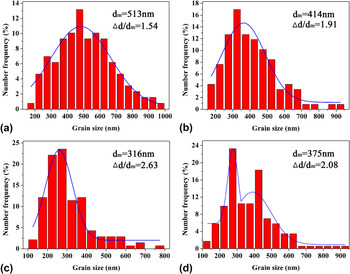
Figure 2 shows the microstructural variation of as-extruded Mg–3Al–1Zn–xAg (x = 0–2 wt%) alloys taken from the direction parallel to the ED. It can be seen that a DRXed structure with uniform and equiaxed grains is visible in Mg–3Al–1Zn alloy. The mean grain size in Mg–3Al–1Zn alloy is about 513 nm. For the Mg–3Al–1Zn–0.5Ag alloy, the DRXed grains are smaller than the Mg–3Al–1Zn alloy, and the average grain size decreases to 414 nm. As the content of Ag rises to 1 wt%, the grain size of as-extruded alloy is further refined (mean grain size of ∼316 nm), meanwhile, a majority of grains are elongated in parallel to the ED, indicating partial DRX replaces full DRX in Mg–3Al–1Zn–1Ag alloy. The elongated grains, or sub-grains, will be observed in detail in the following section. For the Mg–3Al–1Zn–2Ag alloy, numerous second phase particles precipitate. Combining with the analysis of XRD results (Fig. 1), these second phase particles are speculated to be Mg54Ag17 phase. Simultaneously, a duplex structure characterized by individual coarse grains and fine grains in clusters is formed in the extruded sample, and the average grain size in Mg–3Al–1Zn–2Ag alloy is about 375 nm. Therefore, it can be concluded that trace Ag additions in the range of 0–2 wt% have an obvious influence on the grain refinement of Mg–3Al–1Zn alloy.
SEM and bright-field TEM images of as-extruded Mg–3Al–Zn–xAg (x = 0–2 wt%) alloys: (a and b) Mg–3Al–1Zn; (c and d) Mg–3Al–1Zn–0.5Ag; (e and f) Mg–3Al–1Zn–1Ag and (g and h) Mg–3Al–1Zn–2Ag.

Apart from the mean grain size, the grain size dispersion also has a connection with Ag additions in the range of 0–2 wt%. The grain size dispersion can be defined by the value Δd/d m, where Δd represents the grain size range (Δd = d max − d min) and d m represents the average grain size, according to Ref. Reference Berbeni, Favier and Berveiller25. The grain size dispersion of as-extruded Mg–3Al–1Zn–xAg (x = 0–2 wt%) alloys is shown in Fig. 3. It can be seen that grain size distributions of the three extruded alloys containing 0–1 wt% Ag approximately follow log-normal density probability functions with a single peak. In contrast, the grains of Mg–3Al–1Zn–2Ag alloy are almost in a bimodal grain size distribution with two peaks. Among four investigated alloys, the Mg–3Al–1Zn sample exhibits the smallest grain size dispersion (Δd/d m) of 1.54, while the Mg–3Al–1Zn–1Ag sample exhibits the largest grain size dispersion (Δd/d m) of 2.63. It can be concluded that the Ag additions in Mg–3Al–1Zn alloy have profound influence on the grain size dispersion. Combined with the microstructure in Fig. 2, it can also be seen that the microstructure uniformity could be improved by full DRX, but would be deteriorated by partial DRX. Chen et al. Reference Chen, Yu, Wang, Wang and Liu26 also observed a similar correlation between microstructure uniformity and DRX in ZK61 alloy sheets during large-strain hot rolling.
Grain size dispersion of as-extruded Mg–3Al–1Zn–xAg (x = 0–2 wt%) alloys: (a) Mg–3Al–1Zn; (b) Mg–3Al–1Zn–0.5Ag; (c) Mg–3Al–1Zn–1Ag and (d) Mg–3Al–1Zn–2Ag.

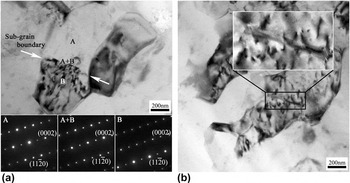
Further investigations are carried out to elucidate the partial DRX in Mg–3Al–1Zn–1Ag sample. Figure 4(a) shows a bright-field TEM image taken from an elongated-grained region with a grain size of about 0.8 μm in the elongated direction. The elongated grain is composed of two different sub-grains. The sub-grain boundary can be observed clearly between the two white arrows. Selected area electron diffraction (SAED) patterns are taken from the sub-grain boundary (A + B) coupled with the up (A) and down (B) sides. Comparing the inserted SAED images, the sub-grain at the upside is rotated 3.32° from the one at the downside along the sub-grain boundary. Figure 4(b) shows that sub-grains with low angle grain boundaries (LAGBs) are formed in a DRXed grain through dislocation arrays, which are magnified in the rectangle. It can be seen that the new grains form as the arrays of LAGBs gradually turn into HAGBs by continuous dislocation accumulation, which is introduced by the deformation. Reference Galiyev, Kaibyshev and Gottstein17,Reference Tsuzaki, Huang and Maki27,Reference Gourdet and Montheillet28 Since these ultrafine grains result from continuous reactions during deformation, such sequences of structural change have been referred to as CDRX. It can be concluded that Ag addition (1 wt%) strongly retards CDRX, resulting in a large amount of sub-grains in Mg–3Al–1Zn–1Ag alloy.
TEM micrographs of elongated grains in the as-extruded Mg–3Al–1Zn–1Ag sample: (a) bright-field TEM image of an elongated grain with selected area electron diffraction (SAED) patterns taken from the sub-grain boundary coupled with the upside and downside as inserts; (b) LAGBs formation by dislocation arrays with the magnification of dislocation arrays as an insert.

Based on above analysis, it is certain that the Ag addition to Mg–3Al–1Zn alloy has an obvious influence on DRX behavior during extrusion, and the DRX behavior is dependent on the Ag variations. Ag addition (≤1 wt%) can retard the DRX and the growth of the DRXed grains, resulting in the grain refinement from 513 to 316 nm and incomplete DRX in Mg–3Al–1Zn–1Ag alloy. It is well known that solute atoms generally segregate to the grain boundaries at hot deformation temperatures and decrease their mobility, Reference Cahn29 the interaction between solute segregation and grain-boundaries migration may have a pronounced effect on the rate of grain growth and recrystallization. The interaction is generally called as solute drag. Because of the larger atomic size of Ag than Mg (about 10% in diameter), Ag element tends to segregate along grain boundaries. In addition, the higher the solute atoms in Mg–3Al–1Zn alloy, the lower the tendency for DRX and grain growth during hot deformation. Therefore, it is speculated that Ag can also play the role of solute drag to inhibit the DRX behavior and grain growth in the Mg–3Al–1Zn–xAg (x = 0–1 wt%) alloys. Previous investigations have illuminated that solute drag resulting from the segregation of REs is responsible for the strong suppression of DRX behavior in Mg–Y and Mg–Gd alloys. Reference Farzadfar, Martin, Sanjari, Essadiqi and Yue22,Reference Hadorn, Sasaki, Nakata, Ohkubo, Kamado and Hono30
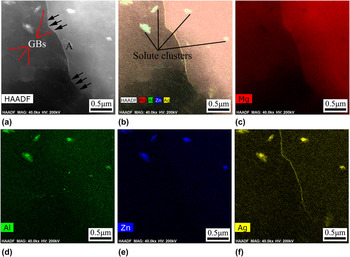
High angle annular dark field scanning transmission electron microscopy (HAADF-STEM) images of as-extruded Mg–3Al–1Zn–1Ag alloy and EDX mapping images corresponding to Mg, Al, Zn, and Ag are shown in Fig. 5. Based on the EDX mapping analysis, the solute-enriched features involve two types: (i) grain boundary; (ii) solute-rich cluster. The grain boundaries are found to be enriched in Ag. In contrast, the solute-rich clusters are found to be enriched in Al, Zn, and Ag and located in the vicinity of grain boundaries. The DRX behavior and grain growth would be retarded by the Ag segregation and Al–Zn–Ag clusters. Moreover, the grain boundary (A) with high content of Ag bows out in the direction marked as arrows, indicating that the grain growth should push forwards the barrier of Ag segregation. It indicates that the Ag segregation at grain boundaries plays a significant role in solute drag effect. The solute drag effect of Ag has been observed by Beck, Reference Beck31 who reported that the time for recrystallization of lead could be increased by many orders of magnitude by adding ppm levels of Ag.
Solute clusters and segregation of as-extruded Mg–3Al–1Zn–1Ag alloy: (a and b) HAADF-STEM images and EDX mapping images corresponding to (c) Mg; (d) Al; (e) Zn and (f) Ag.

When the content of Ag rises to 2 wt%, it is unexpected that the extent of partial DRX is not continued to intensify and the microstructure possesses DRXed grains with a bimodal grain size distribution. Meanwhile, a dense distribution of Mg54Ag17 precipitates is noted where the fine grains located in clusters, as shown in Fig. 2(h). It indicates that the abnormality has a connection with the precipitation of Mg54Ag17 phase in the Mg–3Al–1Zn–2Ag alloy.
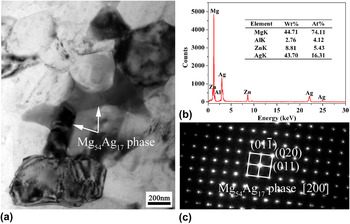
The Mg54Ag17 precipitates are further characterized in Fig. 6. Figure 6(a) shows the bright-field TEM image of the precipitates taken along [200] zone axes. The precipitates are observed to be roughly located along the grain boundaries in lath-like shape. According to the EDS analysis [Fig. 6(b)], the precipitate is enriched in Mg and Ag. Combined with the SAED pattern of the precipitate [Fig. 6(c)], the precipitate is further confirmed as Mg54Ag17 phase. The higher content of Al and Zn atoms indicates that Mg54Ag17 phase preferentially precipitated at the Al–Zn–Ag clusters which are located in the vicinity of grain boundaries. The Mg54Ag17 phase has a body centered orthorhombic structure, with the lattice parameter a = 1.242 nm, b = 1.4209 nm, c = 1.4663 nm. Reference Huang, Shi and Zhang32,Reference Huang and Zhang33 The same phase was also detected in extruded Mg–6Zn–2Sn–0.4Mn-based alloy Reference Son, Kim and Park34 and aged Mg–Sn–Mn alloy Reference Huang and Zhang35 with Ag addition.
Microstructure of as-extruded Mg–3Al–1Zn–2Ag alloy with the precipitates: (a) bright-field TEM image; (b) corresponding EDS spectra and (c) SAED pattern of the precipitate.

Compared with Mg–3Al–1Zn–1Ag alloy, the extent of DRX increases in Mg–3Al–1Zn–2Ag alloy. It is greatly attributed to that Mg54Ag17 phase consumes the Ag element from the Al–Zn–Ag clusters and segregation, thereby suppressing the effect of solute drag. Moreover, the grains are in a bimodal grain size distribution, and the DRXed grains adjacent to the Mg54Ag17 clusters are smaller than those far away from the Mg54Ag17 clusters. It indicates that the fine Mg54Ag17 particles that are dynamically precipitated during extrusion play an important role in restricting DRXed grain growth via grain boundary pinning effect. In this sense, these results are very similar to those previously observed in TAZ711 alloy Reference Jung, Park and You36 and Mg–7Sn–1Al–1Zn alloy Reference Park and You2 extruded under different conditions.
The texture data are examined in the form of pole figures, and the typical texture of four samples is shown in Fig. 7. The Mg–3Al–1Zn alloy shows a weak basal texture [Fig. 7(a)], i.e., there is a preferred orientation consisting of (0001) basal planes aligned with the extrusion axis. Further, there is a tendency for the (
 $10\bar 10$
) and (
 $11\bar 20$
) directions to align with the extrusion axis. Additionally, the orientation of (
 $10\bar 10$
) plane shows almost same to basal planes. That means the (
 $10\bar 10$
) plane parallels to the ED, and becomes a strong texture (in this paper we call this texture as second texture). Figure 7(b) shows the extrusion texture for Mg–3Al–1Zn–0.5Ag alloy. The texture is more random and weakened, which is similar to those alloys containing RE elements. At a higher alloying level of 1 wt% Ag, it is surprising that the texture is strengthened. Meanwhile, the second texture peak at approximately (
 $10\bar 10$
) direction parallel to the ED is evident in the pole figure shown in Fig. 7(c). In Mg–3Al–1Zn–2Ag alloy [Fig. 7(d)], the texture is weakened again. From Fig. 7, it can be seen that additions of Ag element to Mg–3Al–1Zn alloy weaken the basal texture to some extent. However, this effect is not remarkable.
The (0002), (
 $10\bar 10$
) and (
 $11\bar 20$
) pole figures of as-extruded Mg alloys: (a) Mg–3Al–1Zn; (b) Mg–3Al–1Zn–0.5Ag; (c) Mg–3Al–1Zn–1Ag and (d) Mg–3Al–1Zn–2Ag.

In the present study, it is interesting to find that the extrusion texture is in fairly scattered orientation distribution even in the Mg–3Al–1Zn alloy without the addition of Ag element, which varies considerably from the intense basal fiber texture in conventional AZ31, AZ61, and AZ91D cast Mg alloys after direct extrusion. Reference Li, Pan, Jiang, Dong and Yang37,Reference Pérez-Prado, del Valle and Ruano38 The weak basal texture and obvious prismatic texture are attributed to the following reasons: (i) when extruded at 473 K, some prismatic slip systems would be activated Reference Jia, Hu, Zhao, Ju and Chen39 ; (ii) when the grain size decreases, the nonslip system is easily activated by plastic compatibility stress associated with grain boundaries Reference Razavi, Foley, Karaman, Hartwig, Duygulu, Kecskes, Mathaudhu and Hammond40,Reference Shi, Chen and Ke41 ; (iii) it may relate to the fabrication process of hot press consolidation followed by extrusion, where extrusion is mainly adopted for further densification.
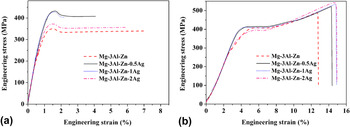
The engineering strain–stress curves in tension and compression of as-extruded Mg–3Al–1Zn–xAg (x = 0–2 wt%) alloys at room temperature are shown in Fig. 8. The 0.2% tensile yield stress (TYS), ultimate tensile stress (UTS), tensile failure strain (TFS), 0.2% compressive yield stress (CYS), ultimate compressive stress (UCS), and compressive failure strain (CFS) of as-extruded Mg–3Al–1Zn–xAg (x = 0–2 wt%) alloys are summarized in Table II. It can be observed that both TYS and CYS increase with increasing Ag content to 1 wt%. The TYS and CYS increase from 298 MPa to 384 MPa, and 318 MPa to 409 MPa, respectively. Accordingly, the UTS and UCS of alloys range between 351 MPa to 428 MPa, and 490 MPa to 544 MPa, respectively. Compared with above Mg–3Al–1Zn–xAg (x = 0.5–1 wt%) alloys, the Mg–3Al–1Zn–2Ag alloy with precipitated Mg54Ag17 phase exhibits a lower strength in both tensile and compressive tests.
The engineering strain–stress curves of as-extruded Mg–3Al–1Zn–xAg (x = 0–2 wt%) alloys in: (a) tension and (b) compression.

Mechanical properties of as-extruded Mg–3Al–1Zn–xAg (x = 0–2 wt%) alloys.

Generally, the strength of the Mg alloys is always attributed to multiple mechanisms which comprise strengthening due to grain boundaries, texture, dislocations, solid solution, and precipitates. Reference Kim, Park, Kim, You and Park42–Reference Yang, Bu, Qiu, Li, Li, Sun, Liu and Meng44 In the as-extruded Mg–3Al–1Zn–xAg (x = 0–2 wt%) alloys, in view of the weak basal texture, the strengthening due to texture could be out of consideration. Because the extrusion temperature is not high enough, some dislocations preserve due to the contribution of cell boundaries and microstrains, which mutually interact and lead to an increment of strength. Therefore, the dislocation strengthening should be taken into account. In the Mg–3Al–1Zn–2Ag alloy, Mg54Ag17 phase precipitates along the grain boundary, which leads to precipitation-strengthening from Orowan mechanism. Reference Wang, Lefebvre, Yan, Sinclair and Starink45 Among the multiple mechanisms, the grain boundary strengthening is supposed to be the most prominent in the ultrafine-grained Mg alloys because of their high k y values. Reference Barnett, Keshavarz, Beer and Atwell46,Reference Mora, Garcés, Onǒrbe, Pérez and Adeva47 Apart from above strengthening mechanisms, the clusters and solute segregation in the Mg–3Al–1Zn alloy with Ag additions also increase the strength. Reference Chen, Gao, Sha, Ringer and Starink48 Valiev et al. Reference Valiev, Enikeev, Murashkin, Kazykhanov and Sauvage49,Reference Valiev, Enikeev, Murashkin, Aleksandrov and Goldshtein50 proved that the solute segregation along the grain boundaries may affect the emission and mobility of intragranular dislocations, thus contributing to an additional strengthening. Chen et al. Reference Chen, Gao, Sha, Ringer and Starink51 proposed that the co-existence of solute clusters and cluster-dislocation complexes contribute to the extra strengthening. In addition, the short-range order due to the cluster-dislocation complexes account for more than 40% of overall hardness, and the solute hardness contributes very little in ultrafine-grained Al–Cu–Mg alloy. Based on above analysis, the contribution of solute clusters to the strength of the Mg–3Al–1Zn alloy with Ag additions is speculated to be significant in this research.
In contrast with Mg–3Al–1Zn alloy, the TYS of Mg–3Al–1Zn–0.5Ag alloy increases from 298 to 382 MPa. This strength enhancement is ascribed to the grain refinement, solid solution, dislocations, solute clusters, and segregation. With the increase of Ag content to 1 wt%, the TYS is observed not to increase obviously, which mainly relates to large quantities of LAGBs in Mg–3Al–1Zn–1Ag alloy. Because LAGBs are more effective sinks for dislocations, thus LAGBs result in a reduced work-hardening rate, which in turn leads to a lower strength. Reference Li, Yang, Feng, Feng, Huang, Chen, Han and Ru52,Reference Kapoor, Kumar, Mishra, Huskamp and Sankaran53 As the Ag content increases to 2 wt%, the TYS of Mg–3Al–1Zn–2Ag alloy decreases to 332 MPa. Because the Mg54Ag17 phase preferentially evolves from the solute clusters, the strength decrease of Mg–3Al–1Zn–2Ag alloy indicates that the strengthening effect of solute cluster is greater than that of Mg54Ag17 phase, which is in accordance with previous research. Reference Chen, Gao, Sha, Ringer and Starink51
Comparing TYS and CYS in the studied Mg–3Al–Zn–xAg (x = 0–2 wt%) alloys, it is interesting to observe that the yield asymmetry ratio (CYS/TYS) of all investigated alloys is a little higher than 1, which is inconsistence with results reported in conventionally extruded alloys.
Reference Huppmann and Reimers54
Based on prior work, the asymmetric yield behavior of the extruded alloy originates from the difference in {
 $10\bar 12$
} twinning characteristics under tensile and compressive loading, because slip-induced deformation is independent of the loading direction. Compression parallel to the extruded direction results in a high activity of {
 $10\bar 12$
} twinning, while tension parallel to the extruded direction is dominated by slip, particularly 〈a〉 prismatic slip. In conventional extruded Mg alloys, twinning is activated at a lower critical resolved shear stress (CRSS) than 〈a〉 prismatic slip, which accounts for the commonly observed yield anisotropy, that is, yielding occurs at lower stresses in compression than in tension.
Reference Xu, Oh-ishi, Kamado, Uchida, Homma and Hono55,Reference Song, Xin, Guo, Xu, Sun and Liu56
The uncommon yield anisotropy is considered to be relative to the ultrafine grain size and relatively weaker basal texture than other basal textured Mg alloys. Firstly, grain refinement can suppress the generation of twinning. Wang et al.
Reference Wang, Hoagland, Hirth, Capolungo, Beyerleinb and Tomé57
reported that the number fraction of the twinned grains and the tension-compression yield asymmetry of the basal-textured AZ31 depended strongly on the grain size. Barnett et al.
Reference Barnett, Keshavarz, Beer and Atwell46
showed that when the average grain size was smaller than 1 μm, the {
 $10\bar 12$
} twinning would be suppressed in the extruded Mg–3Al–Zn alloy. Meyers et al.
Reference Meyers, Vöhringer and Lubarda58
further investigated the essential reason for the reduced tension-compression asymmetry with decreasing grain size and found that the twinning stress increased more rapidly than the stress required to activate slip with decreasing grain size. In this study, the ultrafine grain size would restrain the formation of {
 $10\bar 12$
} extension twinning. Secondly, the weak basal texture can also restrain the formation of {
 $10\bar 12$
} extension twinning. In fact, the yield asymmetry in the extruded Mg alloys can be ascribed to the activation of {
 $10\bar 12$
} extension twinning in compression along ED but not in tension along ED, which arises from the combination of sharp basal textures and the polarity of deformation twinning.
Reference Kleiner and Uggowitzer59,Reference Xu, Oh-ishi, Sunohara and Kamado60
From this perspective, a weaker basal texture implies an increase in compression yield point as fewer grains have a favorable orientation for twinning. Therefore, the weak basal texture and ultrafine grain size lead to the high yield asymmetry ratio.
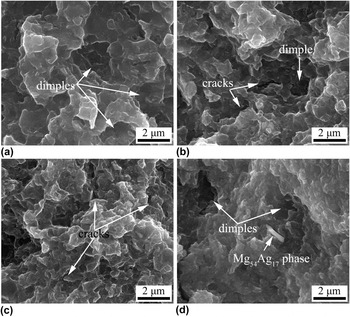
The fracture surfaces of the tensile test samples are shown in Fig. 9. For Mg–3Al–1Zn alloy, the fracture surface approximately exhibits ductile fracture feature with dimples [Fig. 9(a)]. As the Ag content increases to 0.5 wt%, the number of dimples decreases and cracks appear, indicating a mixed fracture mode with both ductile and brittle fractures [Fig. 9(b)]. For Mg–3Al–1Zn–1Ag alloy [Fig. 9(c)], the cracks are pervasive, indicating that brittle fracture plays a dominant role. Simultaneously, a large decrease in ductility occurs. It suggests that the presence of Ag segregation layer is likely to promote void initiation at the grain boundaries during plastic deformation. In Mg–3Al–1Zn–2Ag alloy [Fig. 9(d)], ductile fracture with dimples emerges again, indicating that the formation of Mg54Ag17 phase breaks the Ag segregation layer to some extent and increases the ductility of Mg–3Al–1Zn–2Ag alloy.
Fractography of tensile test samples of as-extruded Mg alloys: (a) Mg–3Al–1Zn; (b) Mg–3Al–1Zn–0.5Ag; (c) Mg–3Al–1Zn–1Ag and (d) Mg–3Al–1Zn–2Ag.

IV. CONCLUSIONS
Trace Ag addition (≤1 wt%) retards DRX and the growth of the DRXed grains due to solute drag effect of Ag segregation and Al–Zn–Ag solute clusters at grain boundaries. The Mg54Ag17 phase precipitates along the grain boundary with 2 wt% Ag addition, which restricts DRXed grain growth via grain boundary pinning effect. The Ag-containing extruded alloys exhibit an increase in the tensile and compressive properties. The ultrafine grain size and weak basal texture lead to the high yield asymmetry ratio. Moreover, the strengthening mechanisms due to grain refinement, dislocations, solid solution, precipitates, solute clusters, and segregation are discussed.