Introduction
Materials design is critical to achieving target performance, reliability, durability, and manufacturability of industrial components and products. Efficient and robust materials design and development methodologies have been sought for faster discovery, qualification, implementation, and industrialization of new materials. Under the framework of Integrated Computational Materials Engineering (ICME),Reference Pollock, Allison, Backman, Boyce, Gersh, Holm, LeSar, Long, Powell IV, Schirra, Whitis and Woodward1 there have been numerous efforts to develop computational capabilities and tools to design materials and predict material performance, as represented by the Materials Genome Initiative (MGI).2 Recent advancements in computational power and analytical capability have enabled the application of machine learning (ML) in materials design, as well as physics-based material models at various length scales. In this article, examples of successful applications of computational tools, both data-driven ML and physics-based models, in alloy design and optimization are described using single-crystal (SX) Ni-based superalloys as a model system.
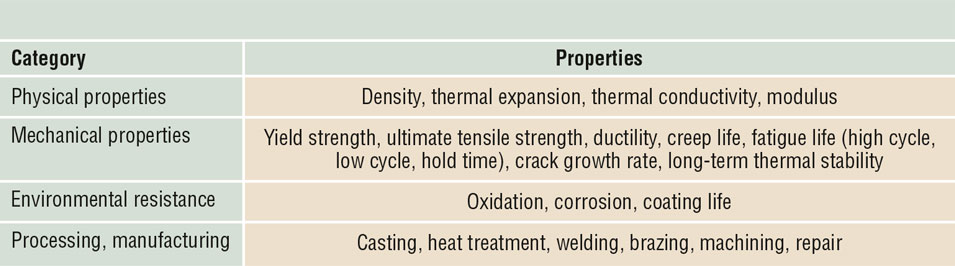
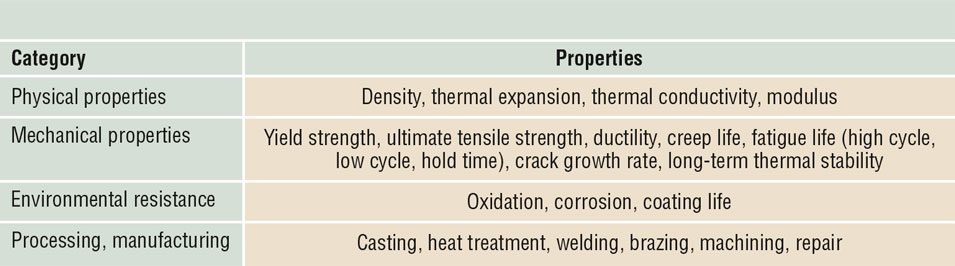
SX Ni-based superalloys are commonly used for high-temperature applications in aircraft engines and land-based power-generation gas turbines.Reference Pollock and Tin3–Reference Darolia5 Typical SX Ni-based superalloys contain multiple alloying elements, including Co, Cr, Mo, W, Re, Al, Ta, Ti, Hf, C, and B, and consist of a γ-Ni solid-solution matrix phase and γ′-Ni3Al strengthening precipitates with cuboidal morphology. There are multiple property requirements, including mechanical, environmental, and physical properties, as well as processability, manufacturability, and cost (Table I) that need to be taken into consideration in alloy design.
Representative properties for consideration in designing single-crystal superalloys.
Traditionally, experimental candidate alloy compositions were selected based on empirical rules and simple regressions built for a few primary property requirements. Multiple iterations of alloy compositions were typically required to identify the final composition that meets the desired combination of properties. Ideally, alloy property models and a multi-objective optimization process would guide us to quickly reach the best solution, if there are property models capable of providing accurate predictions. However, many of the properties have complex interactions and dependencies on various factors, and it is difficult to predict the properties directly from alloy compositions.
For example, sustained-peak low-cycle fatigue (SPLCF) resistance, which is one of the important properties for SX superalloys, includes elements of fatigue, creep, and environmental resistances.Reference Suzuki, Gigliotti, Hazel, Konitzer and Pollock6,Reference Patil, Huang, Karadge, Konitzer, Suzuki and Hardy7 Creep resistance itself has been also known to be dependent on multiple compositional and microstructural factors, such as fraction and morphology of the strengthening γ′ precipitates, compositions of phases, lattice parameter misfit between the γ and γ′ phases, coarsening kinetics of the precipitates, and thermal stability of the phases against the formation of harmful topologically close-packed (TCP) phases. TCP phases are refractory-element-rich phases that tend to form in highly alloyed Ni-based superalloys after prolonged exposure at elevated temperatures.
Instead of building ideal physics-based models that capture all of the underlying physics in the complex, high-dimensional composition space, a more realistic approach is to build alternative models that use (1) merit indices based on scientific principlesReference Reed, Tao and Warnken8 or (2) ML methods if sufficient, reliable, and consistent data are available. ML models have advantages in predicting the following two types of properties. The first is properties with relatively simple dependence on alloy composition. This includes physical properties such as thermal expansion, density, and modulus. The second type is properties that are too complex to accurately describe using physical parameters, which include creep and SPLCF resistance.
ML for materials property modeling
The General Electric Company (GE) has a long history in developing SX superalloys.Reference Darolia5,Reference Schafrik9 All of this experience has resulted in a rich database of alloy compositions and various properties that lend themselves to be readily exercised with advanced analytic techniques and ML methods. By combining the internal GE data with additional data collected from the published literature, hundreds of data points can be used to build data-driven models. However, it should be noted that this is not an ideal data set from an ML perspective. The size of the data set is relatively small, and the key input factors, including alloy compositions, were not sampled in the most ideal way – either as factorial design of experiments (DOEs) or the Latin hypercube sampling (LHS)-based design – but rather, following empirical decisions to sample certain regions in the overall design space.
Modeling composition-dependent properties—Coefficient of thermal expansion
The coefficient of thermal expansion (CTE) of a material is one of the basic properties that lacks a universal physical model. The design of some of the low CTE alloys has been guided by discovered mechanisms such as the Invar effect.Reference Guillaume10 In alloy design, CTE has been typically treated as a composition-dependent property, and there have been different approaches in seeking the composition–CTE relationship. For example, the underpinning physical mechanisms have been explored with first-principles simulations.Reference Bozzolo, del Grosso and Mosca11–Reference van Schilfgaarde, Abrikosov and Johansson13 Data-driven methods, such as linear regression,Reference Karunaratne, Kyaw, Jones, Morrell and Thomson14,Reference Sung and Poirier15 or more sophisticated models such as neural networksReference Bano and Nganbe16 have also been adopted. In this section, application of ML to model CTE and optimize composition in a high-dimensional composition space of interest is described.
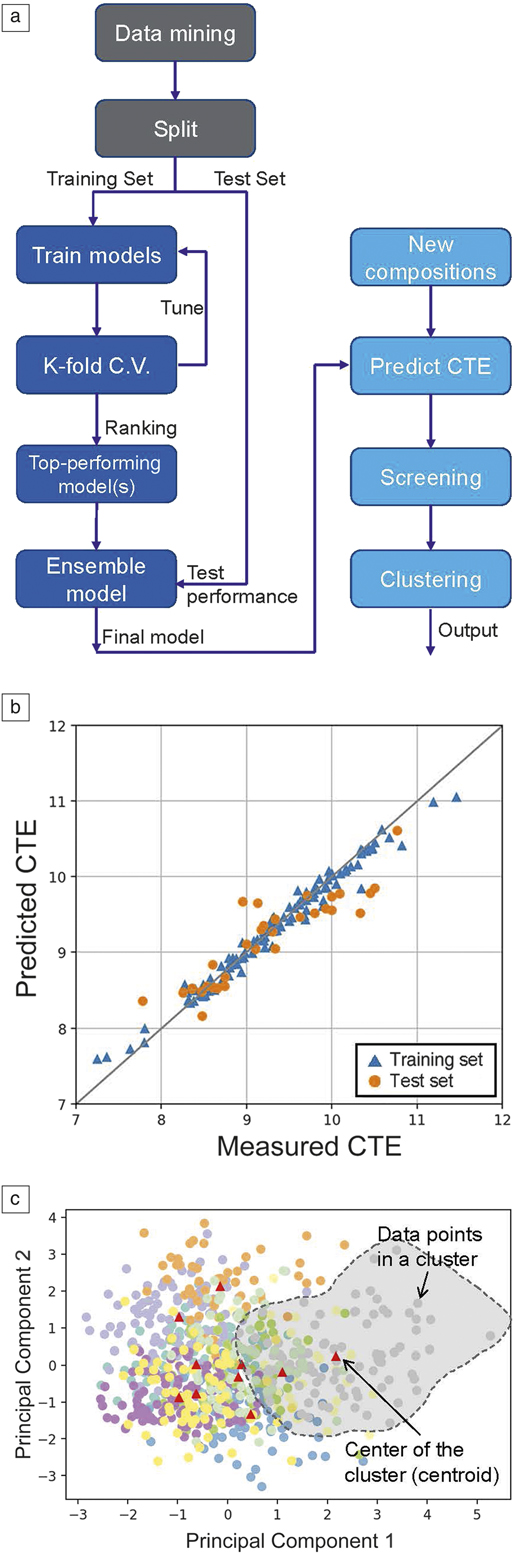
Current ML toolkits, such as Scikit-learn,Reference Pedregosa, Varoquaux, Gramfort, Michel, Thirion, Grisel, Blondel, Prettenhofer, Weiss, Dubourg, Vanderplas, Passos, Cournapeau, Brucher, Perrot and Duchesnay17 make it easy for one to exercise multiple regression algorithms. Multiple models can be combined to further build a metamodel (an ensemble model) that is even better in performance. Figure 1a illustrates a typical workflow of ML that consists of two sequential steps: (1) build a model and (2) search composition space with the model. High-order models require regularization to combat model overfitting that significantly degrades model accuracy in prediction than in training. Usually, input data are randomly split into a training set and a test set. Only the former is used to train models and tune hyperparameters, and the test set is applied to evaluate performance of the final model. When input data are relatively small, K-fold cross-validationReference Pedregosa, Varoquaux, Gramfort, Michel, Thirion, Grisel, Blondel, Prettenhofer, Weiss, Dubourg, Vanderplas, Passos, Cournapeau, Brucher, Perrot and Duchesnay17 is used during tuning to minimize prediction errors. This procedure is often applied to multiple models, of which the best performing model (i.e., with the lowest error) is selected as the final one. Alternatively, one may instead choose several top-performing models and use them to build a metamodel as the final model. The latter approach was taken to build the CTE model (Figure 1b). A total of 16 models in the Scikit-learn package were trained in parallel, and six top-performing models, including KNeighborsRegressor and RandomForestRegressor were down-selected to train a StackingRegressor model,Reference Raschka18 which was taken as the final model. An overlay plot of the test set shows good match between the actual and predicted values.
Machine-learning (ML) modeling of coefficient of thermal expansion (CTE). (a) Workflow for building a ML model and optimizing alloy compositions, (b) performance of the CTE model, (c) application of data clustering to further reduce the data set to a few compositions (10 centroids shown as red triangles). The high-dimensional data are visualized on a projection plane of the two leading principal components. Note: C.V., cross-validation.

To identify alloy compositions that meet a specific design criterion for CTE, a set of 106 compositions was generated in a SX superalloy composition space by optimized LHS. In this example, screening with a CTE criterion yielded 103 compositions. Additional screening criteria on other properties and parameters can be included in this step to narrow down compositions. To further reduce the number of compositions to a realistic number, similar data points were grouped using K-means clustering, and each group was replaced by a respective centroid. Visualizing data points in high-dimensional space is challenging. Principal component analysisReference Pedregosa, Varoquaux, Gramfort, Michel, Thirion, Grisel, Blondel, Prettenhofer, Weiss, Dubourg, Vanderplas, Passos, Cournapeau, Brucher, Perrot and Duchesnay17 is a convenient tool to reduce dimensions. Figure 1c shows the projections of the data points that meet the CTE criteria and the centroids of the 10 clustered groups on a plane defined by the two leading principal components.
Modeling complex properties—Creep and fatigue resistance
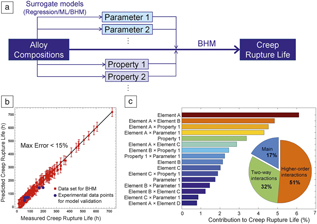
Creep resistance has a nonlinear response to alloy composition, and simple linear models have not been proved to be successful. We utilized a Gaussian process (GP) model-based nonparametric surrogate modeling approach to develop a predictive model for creep resistance. A database of creep rupture life was built based on the GE historical data and additional data collected from published literature, and it covers a wide range of experimental SX superalloys tested at constant temperature and stress conditions. GE’s internal implementation of the GP model, referred to as the Bayesian hybrid model (BHM), was applied to build a model. In addition to all of the elemental constituent percentages, relevant properties and parameters concerning microstructural features were included as inputs for the model by building surrogate models. One of the microstructural parameters included was the propensity to form TCP phases, which has been known to degrade long-term high-temperature mechanical properties. Using a TCP severity scale,Reference Darolia5 a surrogate BHM for the TCP phase was built. Depending on the nature of the properties and parameters to be included in the creep model as inputs, surrogate models can be built using either linear regression, ML (similar to the CTE model discussed in the previous section) or BHM methods. The high-level workflow is shown in Figure 2a.
Creep rupture life model by Bayesian hybrid model (BHM). (a) Workflow for building a BHM, (b) performance of the model, and (c) sensitivity analysis of the model showing top contributors and input factor interactions. Note: ML, machine learning.
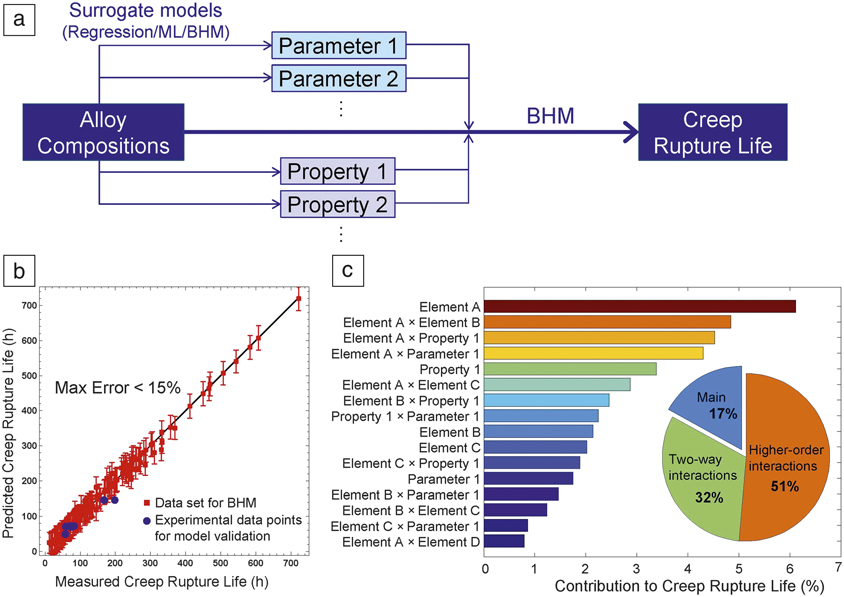
The BHM prediction for the creep rupture life at 2000°F (1366 K) is shown in Figure 2b. Maximum error is less than 15%. Experimental validation also proved the performance of the model. The BHM can also provide variance-based global sensitivity information for the creep resistance. Figure 2c shows the sensitivity of creep resistance in terms of main, two-way and higher-order interaction total effects.Reference Srivastava, Subramaniyan and Wang19,Reference Kumar, Subramaniyan and Wang20 One key observation is that the creep resistance is composed of a larger fraction of higher-order interactions, which was expected due to the complex interactions among the alloying elements, parameters, and properties used as inputs. The sensitivity analysis also shows contributions of each input and interaction, which helps in cross validating the model and the physics understanding.
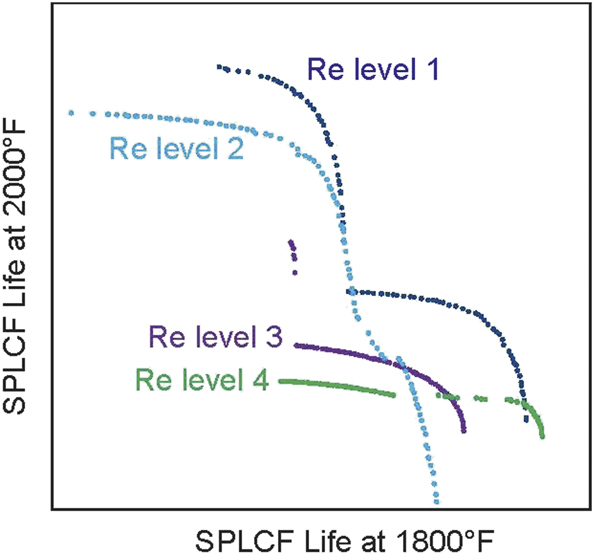
The BHM creep can be used as one of the inputs to build a more complex hierarchical model for SPLCF resistance. By building separate models for SPLCF life at 1800°F (1255 K) and 2000°F (1366 K), alloy chemistry optimization was performed to identify design space(s) that can result in the maximization of SPLCF resistance at both temperatures. The results from the global optimization are plotted in Figure 3, showing pareto fronts of solutions optimizing both objectives. The optimization was performed at four different levels of Re content, which is one of the known key contributors to the high-temperature capability of SX Ni-superalloys. Each data point corresponds to one alloy composition. The global optimization methods are useful for optimizing alloy compositions for multiple property requirements and design constraints (such as heat-treatment window, environmental resistance, and physical properties) and for performing tradeoff analyses between competing property requirements, such as Re content and raw material cost.
Global optimization of alloy compositions to maximize sustained-peak low-cycle fatigue resistance at 1800°F (1255 K) and 2000°F (1366 K). The plots show pareto fronts of solutions obtained at various levels of Re content in single-crystal Ni-based superalloy compositions.

Physics-based microstructure modeling
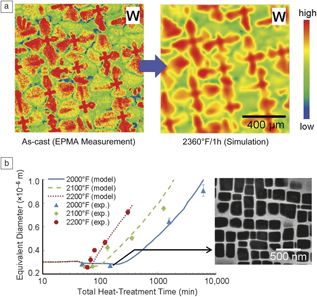
Unlike the ML approaches for predicting properties from alloy compositions, incorporating microstructures and the dependence on processing substantially expands the internal degrees of freedom of a model. Besides alloying elements, adding dependence on processing paths, constituent phases, and spatial variations of a microstructure increases the complexity of a data-driven model and demands substantially more data. On the other hand, extensive studies of the composition–processing–microstructure relationship in superalloys have sprouted many physical models across length scales. For SX superalloys, several existing physical models, when linked to CALculation of PHAse Diagrams (CALPHAD) databases, have demonstrated great potentials in predicting the material state during heat treatments with only limited experimental inputs. Figure 4a shows an example of simulating changes in dendritic microsegregation during homogenization heat treatments of SX Ni-superalloy.Reference Shen, Suzuki, Konitzer and Hardy21 The multicomponent multiphase diffusion simulations successfully accounted for spatial microstructural variations. This model helps optimize nonlinear heat-treatment paths to efficiently achieve homogeneous microstructure, which contributes to avoiding incipient melting and reducing localized formation of the TCP phase. Figure 4b shows another example of a precipitation model for optimizing γ′ precipitate size for mechanical properties. By effectively integrating nucleation, growth, and coarsening kinetics with CALPHAD databases, state-of-the-art prediction capability was achieved to directly link microstructures and industrial processing conditions. More details on these microstructure models can be found in References Reference Shen, Suzuki, Konitzer and Hardy21–Reference Shen23.
Microstructure models in a single-crystal superalloy. (a) Simulated residual microsegregations of W after 2360°F (1566 K)/1 h. The initial state (as-cast) is provided by electron probe microanalyzer (EPMA). (b) Simulation of γ′ size evolution during aging heat treatments.Reference Shen, Suzuki, Konitzer and Hardy21

Future outlook
In this article, we have described powerful data-driven methodologies for modeling highly nonlinear properties of superalloys and for utilizing the models to discover new alloys with desired combinations of properties. For further improving the performance of the models (i.e., reducing uncertainty and error in predictions), the following two areas of improvement need to be addressed: (1) advancement of data-driven modeling methodologies and ML algorithms, and (2) enhancement of the input database in terms of quality and volume.
The input data sets currently available for SX superalloy design are often not ideal for ML due to the relatively small size and insufficient (e.g., nonuniform) sampling in the composition space. In addition, among the experimentally collected data points, scatter and noise are inevitable, especially in mechanical property data. Methodologies for curing the imperfection of the data set will greatly benefit model training quality and prediction capability. On the other hand, incorporating physics understanding or parameters as model inputs to build a physics-informed data-driven model will help a model to better tolerate data errors. Sensitivity analyses in the BHMs are useful for identifying the need for physics-based parameter input to complement the model.
For enhancing the databases, BHM models can be used in a reverse way to guide database maturation strategies by identifying design spaces with high uncertainties. Efficient methodologies to obtain more reliable, consistent property measurement data in wide ranges of composition spaces are also required. One useful approach is high-throughput screening,Reference Zhao24 even though it is not suitable for collecting some of the important mechanical property data, such as ductility and fatigue resistance.
Acknowledgments
The authors would like to acknowledge K.S. O’Hara, D.G. Konitzer, P.R. Subramanian, S.J. Duclos, B.P. Bewlay, and M.L. Blohm for technical discussions and project support.

Akane Suzuki is a principal engineer in structural materials at GE Research. She obtained her PhD degree in metallurgy and ceramics science at the Tokyo Institute of Technology, Japan. She joined GE after a postdoctoral appointment at the University of Michigan. Her research focuses on physical metallurgy, development and processing of high-temperature alloys, including superalloys, intermetallics, and high-entropy alloys. Suzuki can be reached by email at suzukia@ge.com.

Chen Shen is a senior scientist in structural materials at GE Research. He received his PhD degree in materials science and engineering from The Ohio State University. His research interests include solid-state diffusion, phase transformation, microstructure evolution, alloy design, and life prediction. He applies physical models and machine-learning tools for prediction of material behaviors under processing and servicing conditions, and for addressing challenging issues of superalloys in gas and steam turbines. Shen can be reached by email at chens@ge.com.

Natarajan Chennimalai Kumar is a senior engineer of mechanics and design at GE Research. He received his undergraduate degree in aeronautical engineering from Anna University, India, and his PhD degree in mechanical engineering from the University of Illinois at Urbana-Champaign. His work focuses on probabilistic methods, including machine learning, uncertainty quantification and optimization, and service life prediction of industrial assets. He has more than 20 international publications and has filed six patents. Kumar can be reached by email at kumarn@ge.com.