Introduction
Lamproites are ultrapotassic, volatile rich (dominantly H2O) peralkaline igneous rocks. These rocks are characterised by complex mineralogy and can be classified using ‘mineralogical-genetic classification’ schemes (Mitchell and Bergman, Reference Mitchell and Bergman1991; Scott Smith et al., Reference Scott Smith, Nowicki, Russell, Webb, Mitchell, Hetman and Robey2018; Mitchell, Reference Mitchell2020a). Identification of the typomorphic mineral assemblage is essential for accurate classification and nomenclature of exotic rock types such as lamproites, kimberlites and lamprophyres (Mitchell and Bergman, Reference Mitchell and Bergman1991; Mitchell, Reference Mitchell1994, Reference Mitchell1995; Tappe et al., Reference Tappe, Foley, Jenner and Kjarsgaard2005; Dongre and Tappe, Reference Dongre and Tappe2019; Mitchell, Reference Mitchell2020a). Lamproites, unlike other common igneous rocks, cannot be classified on the basis of their modal mineralogy. Lamproites occur in anorogenic (cratonic) and orogenic (subduction) tectonic environments (Prelević et al., Reference Prelević, Foley, Romer and Conticelli2008; Mitchell, Reference Mitchell2020b). According to Murphy et al. (Reference Murphy, Collerson and Kamber2002) and Chakrabarti et al. (Reference Chakrabarti, Basu and Paul2007), the sub-lithospheric mantle is the source of lamproites and ‘orangeites' however lamproite magmas are generated by the partial melting of sub-continental lithospheric mantle and in some instances are diamondiferous (Mitchell and Bergman, Reference Mitchell and Bergman1991; Scott Smith et al., Reference Scott Smith, Nowicki, Russell, Webb, Mitchell, Hetman and Robey2018; Dongre and Tappe, Reference Dongre and Tappe2019; Mitchell, Reference Mitchell2020a; Pandey and Chalapathi Rao, Reference Pandey and Chalapathi Rao2020; Krmíček et al., Reference Krmíček, Magna, Pandey, Rao and Kynický2022).
Kimberlites (or para-kimberlites), lamproites and ultramafic lamprophyres are considered to be present in close proximity in the Eastern Dharwar Craton (Shaikh et al., Reference Shaikh, Patel, Bussweiler, Kumar, Tappe, Ravi and Mainkar2019). Many of the rocks previously regarded as kimberlites have been reclassified as bona fide lamproites on the basis of ‘mineralogical-genetic classification’ schemes (Fareeduddin and Mitchell, Reference Fareeduddin and Mitchell2012; Gurmeet Kaur et al., Reference Gurmeet, Korakoppa M., Pruseth, Pearson, Grutter, Harris, Kjarsgaard, O'brien, Chalapathi Rao and Sparks2013; Gurmeet Kaur and Mitchell, Reference Gurmeet and Mitchell2013, Reference Gurmeet and Mitchell2016; Shaikh et al., Reference Shaikh, Patel, Ravi, Behera and Pruseth2017, Reference Shaikh, Kumar, Patel, Thakur, Ravi and Behera2018, Reference Shaikh, Patel, Bussweiler, Kumar, Tappe, Ravi and Mainkar2019). The present work describes the petrography and mineral compositional data for the Marepalli dyke from the Mesoproterozoic Ramadugu Lamproite Field in the Eastern Dharwar Craton, South India.
Geological setting
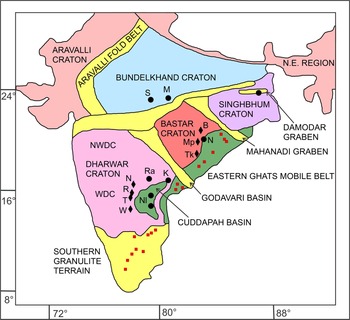
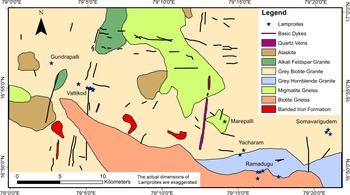
The Dharwar Craton is divided into the Eastern Dharwar Craton and the Western Dharwar Craton by the Chitradurga Boundary Fault (Naqvi and Rogers, Reference Naqvi and Rogers1987; Swaminath and Ramakrishnan, Reference Swaminath and Ramakrishnan1981). The Eastern Dharwar Craton comprises the Late-Archaean granitoids, schist belts and the tonalitic-trondhjemite-granodiorite gneiss of the Peninsular Gneissic Complex. The Peninsular Gneissic Complex is overlain by the Proterozoic Sedimentary Cuddapah basin, covering the eastern part of the Eastern Dharwar Craton (Ramakrishnan and Vaidyanadhan, Reference Ramakrishnan and Vaidyanadhan2008; Jayananda et al., Reference Jayananda, Santosh and Aadhiseshan2018). The Archaean rocks of the Eastern Dharwar Craton are further intruded by the Paleoproterozoic mafic dykes, Mesoproterozoic kimberlites and lamproites and calc-alkaline lamprophyres (Kumar et al., Reference Kumar, Parashuramulu and Nagaraju2015; Gurmeet Kaur and Mitchell, Reference Gurmeet and Mitchell2013, Reference Gurmeet and Mitchell2016; Gurmeet Kaur et al., Reference Gurmeet, Korakoppa M., Pruseth, Pearson, Grutter, Harris, Kjarsgaard, O'brien, Chalapathi Rao and Sparks2013; Srivastava et al., Reference Srivastava, Samal and Gautam2015; Shaikh et al., Reference Shaikh, Patel, Ravi, Behera and Pruseth2017, Reference Shaikh, Kumar, Patel, Thakur, Ravi and Behera2018, Reference Shaikh, Patel, Bussweiler, Kumar, Tappe, Ravi and Mainkar2019; Chalapathi Rao et al., Reference Chalapathi Rao, Giri, Sharma and Pandey2020). The lamproite fields of Eastern Dharwar Craton present in the Cuddapah Basin are: the Banganapalle Lamproite Field (Garledinne); the Nallamalai Lamproite Field (Chelima and Zangamarajupalle); and the Somasila Lamproite Field (Sridhar and Rau, Reference Sridhar and Rau2005; Kumar et al., Reference Kumar, Ahmed, Priya and Sridhar2013; Ahmed et al., Reference Ahmed, Sufija and Ravi2016). These are grouped as the Cuddapah Basin lamproites. The Ramadugu Lamproite Field and Krishna Lamproite Field occur along the northwestern and northeastern margins of the Cuddapah Basin, respectively (Fig. 1; Gurmeet Kaur et al., Reference Gurmeet, Mitchell and Ahmed2018; Chalapathi Rao et al., Reference Chalapathi Rao, Kamde, Kale and Dongre2010; Talukdar et al., Reference Talukdar, Pandey, Chalapathi Rao, Kumar, Belyatsky and Lehmann2018; Shaikh et al., Reference Shaikh, Patel, Bussweiler, Kumar, Tappe, Ravi and Mainkar2019). The recent studies on the reclassification of P-2 west, P-4, P-5, P-12, P-13, TK-1 and TK-4 kimberlites from the Wajrakarur Kimberlite Field in the Eastern Dharwar Craton as lamproites by Gurmeet Kaur and Mitchell (Reference Gurmeet and Mitchell2013, Reference Gurmeet and Mitchell2016), Gurmeet Kaur et al. (Reference Gurmeet, Korakoppa M., Pruseth, Pearson, Grutter, Harris, Kjarsgaard, O'brien, Chalapathi Rao and Sparks2013) and Shaikh et al. (Reference Shaikh, Patel, Ravi, Behera and Pruseth2017, Reference Shaikh, Kumar, Patel, Thakur, Ravi and Behera2018, Reference Shaikh, Patel, Bussweiler, Kumar, Tappe, Ravi and Mainkar2019) are significant in unravelling the nature of these rocks. The Ramadugu Lamproite Field consists of lamproites dykes named after the local villages and includes: Ramadugu; Somavarigudem; Yacharam; Vattikod; Gundrapalli; and Marepalli (Fig. 2; Kumar et al., Reference Kumar, Ahmed, Priya and Sridhar2013; Chalapathi Rao et al., Reference Chalapathi Rao, Kumar, Sahoo, Dongre and Talukdar2014; Gurmeet Kaur et al., Reference Gurmeet, Mitchell and Ahmed2018; Gurmeet Kaur and Mitchell, Reference Gurmeet and Mitchell2019). The lamproites of Krishna, Nallamalai and Ramadugu lamproite fields are diamondiferous. The para-kimberlites and lamproites of Eastern Dharwar Craton are poorly diamondiferous (e.g. < 2 carats per hundred tons for the Wajrakarur Lamproite Field) however the diamonds are of gem quality, as reported by Ravi et al. (Reference Ravi, Sufija, Patel, Sheikh, Sridhar, Kaminsky, Khachatryan, Nayak and Bhaskara Rao2013). The Ramadugu and Krishna lamproites are non-prospective, i.e. diamonds with no commercial value (Chalapathi Rao et al., Reference Chalapathi Rao, Kumar, Sahoo, Dongre and Talukdar2014).
Distribution of lamproites (black circles: S – Saptarshi; M – Majhgawan; D – Damodar; Na – Nawapara; Ra – Ramadugu; K – Krishna; NI – Nallamalai–Chelima) and lamproite–kimberlite fields (black labeled diamonds: B – Basna; Mp – Mainpur; Tk – Tokopal; N – Narayanpet; R – Raichur; T – Tungabhadra; W – Wajrakarur) in the cratons of the Indian subcontinent together with the locations of deformed Proterozoic alkaline rocks and carbonatites (red squares) in the Eastern Ghats Mobile Belt and Southern Granulite Terrain (after Gurmeet Kaur et al., Reference Gurmeet, Mitchell and Ahmed2018; Mitchell, Reference Mitchell2020b).

Geological map showing the lamproitic intrusions in Ramadugu Lamproite Field (compiled from Kumar et al., Reference Kumar, Ahmed, Priya and Sridhar2013 and Sridhar and Rau, Reference Sridhar and Rau2005).

Marepalli dyke
The Marepalli lamproite dyke was first recognised by Kumar et al. (Reference Kumar, Ahmed, Priya and Sridhar2013) as part of the Vattikod lamproite cluster in the Ramadugu Lamproite Field (Fig. 2). The dyke occurs 1.5 km west of the Marepalli village (16°53′00.8″N, 79°02′38.6″E) and intrudes the migmatitic gneiss unit of the Peninsular Gneissic Complex along the fractures in a NW–SE direction (Kumar et al., Reference Kumar, Ahmed, Priya and Sridhar2013; Talukdar et al., Reference Talukdar, Pandey, Chalapathi Rao, Kumar, Belyatsky and Lehmann2018). On the basis of a ‘mineralogical-genetic classification’ scheme, the Marepalli dyke is a bona fide pseudoleucite-amphibole-phlogopite lamproite. The mineralogical characteristics of the Marepalli dyke are compared with those of the neighbouring Vattikod cluster and Gundrapalli lamproite dyke lying to the northwest, and the Ramadugu, Somavarigudem and Yacharam lamproite dykes in the southeast, which together form part of the Ramadugu Lamproite Field.
Analytical techniques
Representative samples from the Marepalli dyke were investigated by quantitative energy-dispersive X-ray spectrometry using a Hitachi SU-70 scanning electron microscope at Lakehead University, Ontario, Canada. The raw X-ray data were obtained with a beam current of 300 pA, an accelerating voltage of 20 kV and 30–60 s counting times and processed using Oxford AZtec software. For information regarding the standards used, refer to Liferovich and Mitchell (Reference Liferovich and Mitchell2005).
Petrography of the Marepalli dyke
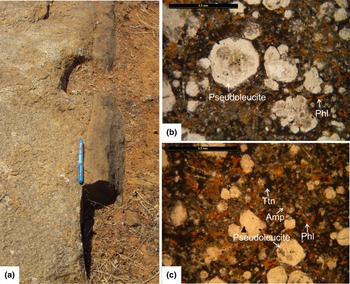
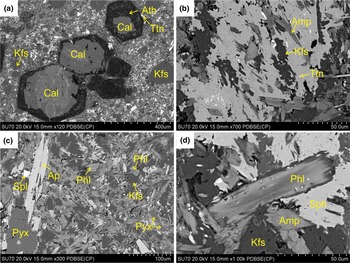
The Marepalli dyke is a greenish black and fine-grained rock (Fig. 3a). Petrographic studies reveal that it is inequigranular in texture with variable sized microphenocrysts and groundmass phases. The rock is characterised by the presence of microphenocrysts of rounded–subrounded pseudomorphed leucite and mica as the principle phases, together with euhedral-to-subhedral pseudomorphed olivine, apatite and clinopyroxene. These microphenocrysts are embedded in a fine-grained groundmass of mica, apatite, clinopyroxene, spinel, amphibole, titanite, K-feldspar and calcite with quartz being the final crystallising interstitial mineral (Figs 3b–c, 4a–d).
(a) Field photograph showing an outcrop of the Marepalli lamproite dyke intruding the Peninsular Gneissic Complex; (b) and (c) plane-polarised light images showing the inequigranular texture of the Marepalli lamproite dyke rock with ovoid pseudoleucites, reddish-brown elongated phlogopite (Phl) microphenocrysts in a fine-grained groundmass of greenish-brown prismatic amphibole (Amp), dark brown titanite (Ttn) and phlogopite (Phl).

Back-scattered electron (BSE) images. (a) Euhedral olivine phenocrysts pseudomorphed by secondary calcite (Cal) in the core and anthophyllite (Ath), phlogopite (Phl) and titanite (Ttn) in the rim. Also seen are anhedral leucite phenocrysts completely pseudomorphed by secondary K-feldspar (Kfs). (b) Prismatic amphibole (Amp), aggregates of titanites (Ttn) and K-feldspar (Kfs) as groundmass phases. (c) Phenocrysts of apatite (Ap) and pyroxene (Pyx) in a fine grained groundmass of phlogopite (Phl), K-feldpsar (Kfs), pyroxene (Pyx) and spinel (Spl). (d) Zoned microphenocryst of phlogopite (Phl) in groundmass of amphibole (Amp), titanite (Ttn) and K-feldspar (Kfs).

Rounded-to-subrounded microphenocrysts of leucite are completely pseudomorphed by secondary K-feldspar intergrown with calcite, quartz, cryptocrystalline silica, and contain small inclusions of allanite, pyrite, magnetite, chalcopyrite, galena, titanite and hydro-zircon. Fresh olivine is not found, although it occurs as euhedral-to-subhedral pseudomorphs of calcite surrounded by microphenocrysts of anthophyllite and phlogopite at the margins (Fig. 4a). In contrast, mica, apatite and clinopyroxene occur as alteration-free primary microphenocrysts. Mica is the most abundant phase and is present as zoned microphenocrysts with compositionally distinct cores and rims. Mica also occurs as zonation-free groundmass grains and is present in the marginal part of olivine pseudomorphs (Fig. 4a). Apatite is the second common primary phase, and occurs texturally as two types: (1) euhedral-to-subhedral acicular microphenocrysts (Fig. 4c); and (2) tiny hexagonal prisms scattered throughout the rock. Apatite prisms and microphenocrysts are also completely- or partially-enclosed by mica and clinopyroxene microphenocrysts, indicative of their earlier crystallisation. The majority of apatites are not zoned, although compositional zoning is observed in one microphenocryst partially-included in clinopyroxene. Marepalli clinopyroxene is commonly present as zonation-free microphenocrysts and in the groundmass, unlike those reported from the Vattikod and Gundrapalli lamproites (Fig. 4c; Gurmeet Kaur et al., Reference Gurmeet, Mitchell and Ahmed2018; Talukdar et al., Reference Talukdar, Pandey, Chalapathi Rao, Kumar, Belyatsky and Lehmann2018; Gurmeet Kaur and Mitchell, Reference Gurmeet and Mitchell2019). Most clinopyroxene in the Marepalli dyke are corroded and commonly replaced by titanite along the grain margins and cracks.
Spinels occur as tiny euhedral crystals scattered throughout the groundmass and are also present along the margins of olivine pseudomorphs (Fig. 4c). Spinels occasionally show compositional zoning identified as core surrounded by a weakly developed thin rim. Amphiboles essentially occur as subhedral-to-anhedral groundmass crystals in association with fine-grained phlogopite, spinel, apatite and titanite (Fig. 4d). Subhedral amphibole crystals exhibit compositional zoning and are commonly enclosed by titanite aggregates in the groundmass (Fig. 4b). Titanite occurs in three different parageneses: (1) dominantly as late-stage primary phase aggregates containing inclusions of mica, apatite, pyroxene and amphibole (Fig. 4b); (2) a secondary phase replacing clinopyroxene along the grain boundaries, cleavage planes and fractures; and (3) along the margins of leucite pseudomorphs. The feldspars are commonly present as primary anhedral poikilitic crystals occupying the interstitial spaces in the groundmass and as the principle secondary phase pseudomorphing leucite (Fig. 4a–d). Calcite occurs as: (1) a late-stage deuteric phase filling the interstices between earlier-formed groundmass phases; and (2) a secondary phase together with K-feldspar and quartz in the leucite pseudomorphs (Fig 4a). Similar calcite has been recorded in the Vattikod and Gundrapalli lamproites (Gurmeet Kaur et al., Reference Gurmeet, Mitchell and Ahmed2018; Talukdar et al., Reference Talukdar, Pandey, Chalapathi Rao, Kumar, Belyatsky and Lehmann2018; Gurmeet Kaur and Mitchell, Reference Gurmeet and Mitchell2019). The textural features of accessory phases (allanite; hydro-zircon; pyrite; magnetite; chalcopyrite; galena; witherite; strontianite; baryte; chlorite; and serpentine) indicate their late secondary occurrence as a result of late-stage deuteric or post-magmatic hydrothermal alteration. Allanite and hydro-zircon occur as fine-grained aggregates in the core of leucite pseudomorphs. Magnetite and pyrite are observed as anhedral crystals within leucite pseudomorphs. Rare anhedral galena and Co–Ni-chalcopyrite are present in the olivine pseudomorphs. Witherite and strontianite are rarely present in the groundmass. Baryte is observed as veins cross-cutting the rock. Minor chlorite and serpentine occur as alteration products. Chlorite rarely replaces groundmass phlogopite, pyroxene and amphibole, and rare serpentine is present as pseudomorphs after former subhedral olivine.
Mineral compositions
Mica
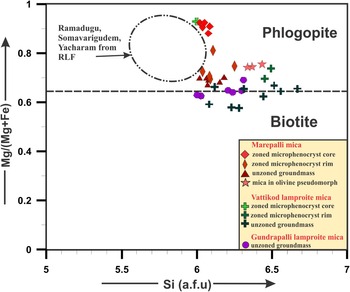
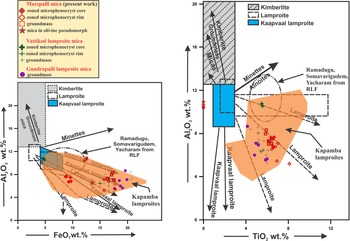
Representative compositions of mica are given in Table 1. Marepalli micas occurring as microphenocrysts and groundmass phase are phlogopites with X Mg [the ratio Mg/(Mg+Fe2+)] in the range of 0.92–0.67 (Fig. 5). There is marked difference in FeOT and TiO2 in the cores and rims of these zoned phlogopite microphenocrysts, however, Al2O3 show overlapping concentrations on Al2O3 vs. FeOT and Al2O3 vs. TiO2 compositional variation plots (Fig. 6a–b). The cores contain 7.7–6.7 wt.% Al2O3, 19.4–21.2 wt.% MgO, 8.7–9.7 wt.% FeOT and 6.4–6.7 wt.% TiO2, whereas the rims are characterised by overlapping Al2O3 (5.2–7.1 wt.%), relatively decreased MgO (14.1–18.1 wt.%), highly enriched FeOT (13.6–17.8 wt.%) and slightly increased TiO2 (6.5–8.1wt.%). The groundmass phlogopites have similar compositions to the rims of the zoned phlogopite microphenocrysts in terms of their Al2O3 (7–8.3 wt.%), MgO (14.9–15.9 wt.%), FeOT (16.3–17.6 wt.%) and TiO2 (5.9–6.4 wt.%) content. The compositional evolution observed in the Marepalli phlogopites is towards VIFe2+ enrichment, compensated by significant substitution of VIMg2+ by VIFe2+ at the octahedral-site (Table 1). The phlogopite also shows a minor component of stoichiometrically recalculated tetraferric iron (0.48–0.89 atoms per formula unit), suggestive of slight substitution of IVAl3+ by IVFe3+ at the tetrahedral site. The high X mg (0.88–0.92) observed in cores of zoned phlogopite microphenocrysts indicates their early crystallisation from less evolved lamproitic melt (Mitchell and Bergman, Reference Mitchell and Bergman1991). However, the rims of zoned phlogopite microphenocrysts and groundmass grains showing relatively low and wider range of X mg (0.67–0.81) are considered to be formed at a late-stage in equilibrium with the evolving magma (Mitchell and Bergman, Reference Mitchell and Bergman1991). The mica occurring at the marginal parts of the olivine pseudomorph are also phlogopites with 0.74–0.75 X mg (Fig. 5). These phlogopites are characterised by high Al2O3 (10.4–10.9 wt.%), MgO (20.9–20.3 wt.%), moderate FeOT (12.6–12.2 wt.%), very low Cr2O3 (0.2–0.3 wt.%), NiO (0.2 wt.%) and negligible TiO2. The composition and textural characteristics of these phlogopites are indicative of their crystallisation prior to phenocrystal phlogopites, at mantle depths (Mitchell and Bergman, Reference Mitchell and Bergman1991). The BaO contents in all textural types of phlogopites are typically <1.6 wt.% and fluorine contents vary between 0–1.2 wt.%.
Mg# vs. Si (a.f.u = atoms per formula unit) classification diagram for mica compositions (after Rieder et al., Reference Rieder, Cavazzini, Yakonov, Frank-Kamenetskii, Gottardi, Guggenheim, Koval, Muller, Neiva, Radoslovich, Robert, Sassi, Takeda, Weiss and Wones1998). Also shown are data for the micas from Vattikod (Gurmeet Kaur et al., Reference Gurmeet, Mitchell and Ahmed2018) and Gundrapalli (Gurmeet Kaur and Mitchell, Reference Gurmeet and Mitchell2019) lamproites and the field for other Ramadugu lamproites (Chalapathi Rao et al., Reference Chalapathi Rao, Kumar, Sahoo, Dongre and Talukdar2014).

(a) Al2O3 (wt.%) vs. FeOT (wt.%); and (b) Al2O3 (wt.%) vs. TiO2 (wt.%) compositional variation diagram of mica in Marepalli lamproite. Also shown are data for the micas from Vattikod (Gurmeet Kaur et al., Reference Gurmeet, Mitchell and Ahmed2018) and Gundrapalli (Gurmeet Kaur and Mitchell, Reference Gurmeet and Mitchell2019) lamproites and the field for other Ramadugu lamproites (Chalapathi Rao et al., Reference Chalapathi Rao, Kumar, Sahoo, Dongre and Talukdar2014). The compositional field for mica in Kapamba lamproites is taken from Ngwenya and Tappe (Reference Ngwenya and Tappe2021). Compositional fields and trends for kimberlites, lamproite, Kaapvaal lamproite (formerly orangeite) and minette micas from Mitchell (Reference Mitchell1995).

Representative compositions (wt.%) of phlogopite.

n.d. – not detected; FeO* – total Fe expressed as FeO; C – Core and R – Rim; Mg# = Mg/(Mg+Fe2+)
Compositions: 1–2, 9–11, microphenocrysts; 3–8, groundmass; 12–14, included in olivine pseudomorphs at rims.
Mica compositional zonation trends are similar to those found in bona fide lamproites (Mitchell and Bergman, Reference Mitchell and Bergman1991; Mitchell, Reference Mitchell2020a) and are unlike the trends shown by minettes and archetypal kimberlites (Fig. 6a–b). The compositions of Marepalli mica determined in this work are in agreement with those reported previously from the Vattikod and Gundrapalli lamproites (Figs 5, 6a–b; Gurmeet Kaur et al., Reference Gurmeet, Mitchell and Ahmed2018; Gurmeet Kaur and Mitchell, Reference Gurmeet and Mitchell2019). However, the Marepalli mica is more evolved than mica occurring in the Ramadugu, Somavarigudem and Yacharam lamproites and less evolved than that in the Vattikod and Gundrapalli lamproites in terms of Al2O3 and FeOT content (Fig. 6a; Chalapathi Rao et al., Reference Chalapathi Rao, Kumar, Sahoo, Dongre and Talukdar2014; Gurmeet Kaur et al., Reference Gurmeet, Mitchell and Ahmed2018; Gurmeet Kaur and Mitchell, Reference Gurmeet and Mitchell2019).
Amphiboles
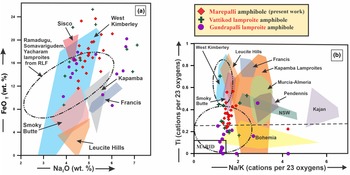
Representative compositions of Marepalli amphiboles are given in Table 2. Although a wide compositional variation exists, all amphiboles are depleted in Al2O3 (<0.7 wt.%) and enriched in TiO2 (2–5.1 wt.%), and thus typical of most lamproitic amphiboles crystallising from a peralkaline magma (Mitchell and Bergman, Reference Mitchell and Bergman1991). The overall compositional range of Marepalli amphibole is 4.4–6 wt.% Na2O, 1.6–5.5 wt.% K2O, 11.6–23.7 wt.% FeOT, 0.54–15.1 wt.% MgO and 2.7–5.3 wt.% CaO. These amphiboles exhibit an exceptionally wide compositional evolution from titanian potassic-katophorite through potassic-ferro-katophorite, potassic-katophorite, potassic-ferro-richterite and potassic-richterite to titanian potassic-arfvedsonite (Table 2). However, potassic-richterite is predominant. In a FeOT vs. Na2O compositional variation diagram (Fig. 7a), the Marepalli amphiboles evolve to the compositions that are higher in FeOT than typical lamproites sensu lato, and overlap the compositional trend of amphiboles from the West Kimberley lamproites. The Ti content varies consistently with the essentially constant Na/K ratio in a Ti vs. Na/K plot (Fig. 7b). Although most of the compositions lie in none of the fields delineated in the Ti vs. Na/K plot, they do show some affinity with those of the Smoky Butte and Leucite Hills lamproites (Fig. 7b). Figures 7a and b demonstrate that the majority of Marepalli amphiboles are similar to those from the Vattikod lamproites (Gurmeet Kaur et al., Reference Gurmeet, Mitchell and Ahmed2018), and are more evolved than Gundrapalli lamproite (Gurmeet Kaur and Mitchell, Reference Gurmeet and Mitchell2019). Additionally, the majority of Marepalli amphiboles are also similar to those of Ramadugu, Somavarigudem and Yacharam lamproites, though exhibit a more extensive evolutionary trend (Fig. 7a–b; Chalapathi Rao et al., Reference Chalapathi Rao, Kumar, Sahoo, Dongre and Talukdar2014).
(a) FeOT (wt.%) vs. Na2O (wt.%); and (b) Ti vs. Na/K (cations per 23 oxygens) compositional variation of amphiboles from Marepalli lamproite. Also shown is the field for amphibole from other Ramadugu lamproites (Chalapathi et al., Reference Chalapathi Rao, Kumar, Sahoo, Dongre and Talukdar2014) and the amphiboles from Vattikod and Gundrapalli lamproites (Gurmeet Kaur et al., Reference Gurmeet, Mitchell and Ahmed2018; Gurmeet Kaur and Mitchell, Reference Gurmeet and Mitchell2019). The compositional field for amphibole in Kapamba lamproites is taken from Ngwenya and Tappe (Reference Ngwenya and Tappe2021). Compositional fields and trends for amphiboles in lamproites from Mitchell and Bergman (Reference Mitchell and Bergman1991).

Representative compositions (wt.%) of amphiboles (using the amphibole classification spreadsheet of Locock et al., Reference Locock2014).

n.d. – not detected; FeO* – total Fe expressed as FeO; Fe2O3 and FeO calculated on a stoichiometric basis; C – Core; R – Rim.
Compositions: 1, 2, 8, included in titanite groundmass aggregates; 3–7, groundmass.
K-RT: potassic-richterite; K-Fe2+-RT: potassic-ferro-richterite; K-KAT: potassic katophorite; Ti-K-KAT: Ti-rich potassic-katophorite; K-KAT: potassic katophorite.
Clinopyroxene
The microphenocrysts and groundmass clinopyroxene in Marepalli are diopsidic in composition with a compositional range of Wo45.6–46.6En47.2–49.0Fs4.6–6.4 (Table 3). They have high MgO (17.1–17.9 wt.%) and CaO (22.7–23.6 wt.%) and are extremely depleted in Al2O3 (<0.4 wt.%), with low TiO2 (1.2–2.2 wt.%), FeO(T) (2.9–4.1 wt.%), Na2O (<0.6 wt.%) and Cr2O3 (<1.0 wt.%), indicating they are a diopside of uniform composition and similar to pyroxenes from lamproites in other localities (Table 3; Mitchell and Bergman, Reference Mitchell and Bergman1991).
Representative compositions (wt.%) of pyroxene.

n.d. – not detected; FeO* – total Fe expressed as FeO; Fe2+ and Fe3+ calculated on a stoichiometric basis.
Compositions: 1–2, 6–7, microphenocrysts; 3–5, groundmass; 5–7, replaced by titanite along grain margin and cracks.
Composition 8# taken from Kumar et al. (Reference Kumar, Ahmed, Priya and Sridhar2013).
Wo: Wollastonite (CaSiO3); En: Enstatite (MgSiO3); Fs: Ferrosilite (FeSiO3).
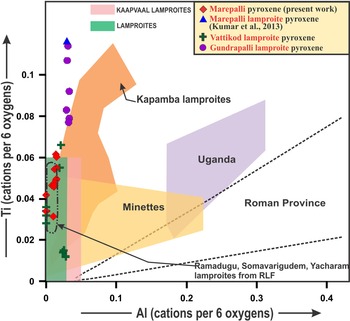
The diopsides from Marepalli are similar in composition to those reported previously from the Gundrapalli lamproite, but differ from those in the Vattikod lamproites which contain two distinct varieties of clinopyroxene, i.e. diopside and Na-Fe-rich pyroxenes extremely enriched in FeO(T) (up to 17 wt.%; Gurmeet Kaur et al., Reference Gurmeet, Mitchell and Ahmed2018; Gurmeet Kaur and Mitchell, Reference Gurmeet and Mitchell2019). The Ti vs. Al (atoms per formula unit) plot of pyroxene compositions shows that all Marepalli clinopyroxenes fall well within the lamproite field and have comparable compositions to those in Ramadugu, Somavarigudem and Yacharam lamproites (Fig. 8; Chalapathi Rao et al., Reference Chalapathi Rao, Kumar, Sahoo, Dongre and Talukdar2014). However, Gundrapalli lamproite clinopyroxenes have high TiO2 (2.8–4.1 wt.%) relative to Marepalli and Vattikod lamproite clinopyroxenes that contain TiO2 ranging from 1.2–2.2 wt.% and 0.4–2.4 wt.% respectively (Fig. 8; Gurmeet Kaur et al., Reference Gurmeet, Mitchell and Ahmed2018; Gurmeet Kaur and Mitchell, Reference Gurmeet and Mitchell2019).
Compositional variation (Ti vs. Al in atoms per formula unit) of pyroxenes from Marepalli lamproite. Also shown are the pyroxenes from Vattikod and Gundrapalli lamproites (Gurmeet Kaur et al., Reference Gurmeet, Mitchell and Ahmed2018; Gurmeet Kaur and Mitchell, Reference Gurmeet and Mitchell2019). Compositional fields and trends for lamproites, minettes, Roman province lavas and kamafugites from Mitchell and Bergman (Reference Mitchell and Bergman1991). The dotted circular field for spinels from other Ramadugu lamproites is shown (Chalapathi et al., Reference Chalapathi Rao, Kumar, Sahoo, Dongre and Talukdar2014). The compositional field for pyroxene in Kapamba lamproites is taken from Ngwenya and Tappe (Reference Ngwenya and Tappe2021). RLF – Ramadugu lamproite field.

Potassium feldspar
Representative compositions of Marepalli feldspar given in Table 4 confirm that they are essentially K-feldspar. There are no significant compositional differences between feldspars in leucite pseudomorphs and those occurring as poikilitic crystals in the groundmass. All are potassic (14.6–16.4 wt.% K2O) with significant iron (0.3–1.4 wt.% Fe2O3), barium (<2 wt.% BaO) and very low sodium (<0.3 wt.% Na2O) contents. The Marepalli K-feldspars are compositionally similar to those recorded in the Vattikod and Gundrapalli lamproites (Gurmeet Kaur et al., Reference Gurmeet, Mitchell and Ahmed2018; Gurmeet Kaur and Mitchell, Reference Gurmeet and Mitchell2019). Additionally, the Vattikod lamproite also contains Na-feldspar (Gurmeet Kaur et al., Reference Gurmeet, Mitchell and Ahmed2018). Feldspar with similar ferric content is also reported from worldwide lamproites (Mitchell and Bergman, Reference Mitchell and Bergman1991; Ngwenya and Tappe, Reference Ngwenya and Tappe2021).
Representative compositions (wt.%) of K-feldspar.

n.d. – not detected; total iron expressed as Fe2O3
Compositions: 1–5, 9–10, groundmass (mesostasis); 6–8, present in leucite pseudomorphs; 11# taken from Kumar et al., Reference Kumar, Ahmed, Priya and Sridhar2013.
Spinels
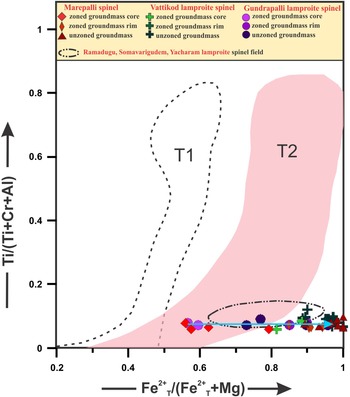
Representative compositions of Marepalli spinels are given in Table 5. These are extremely rich in Cr2O3, but are unusually poor in TiO2, and do not follow the trend T2 typical of lamproites (Fig. 9; Mitchell and Bergman, Reference Mitchell and Bergman1991). In zoned spinels, Cr2O3 and MgO contents decrease from core to rim accompanied by an increase in FeOT and ZnO contents whereas Al2O3 and TiO2 contents remain constant (Table 5). Groundmass spinels show compositional similarity to the rims of the zoned spinels (Fig. 9). The cores of zoned Marepalli spinels are enriched in Ti, Mg and Cr (3.9–5.2 wt.% TiO2; 4.8–11.6 wt.% MgO; 53.6–56.3 wt.% Cr2O3), but poor in Al (1.9–2.8 wt.% Al2O3) and can be defined as titanian magnesian chromites (Fig. 9; Kumar et al., Reference Kumar, Shaikh, Patel, Sheikh, Behera, Pruseth, Ravi and Tappe2021). Their FeOT content ranges from 26.2–32.7 wt.%. The cores are marked by moderate Fe2+T# (0.56–0.79), low Ti# (0.06–0.08) with Fe3+T# (0.10–0.12), and therefore plot near the magnesiochromite–chromite edge on the Ti# vs. Fe2+T# compositional bivariate plot of the front face of the reduced iron spinel prism (Fig. 9). The rims of the zoned and the uniform groundmass Marepalli spinels are enriched in Ti (3.6–5.4 wt.% TiO2) and Cr (47.1–52.0 wt.% Cr2O3), but poor in Al (1.3–2.5 wt.% Al2O3) and Mg (<3.3 wt.% MgO), so can be defined as titanian chromites (Fig. 9; Kumar et al., Reference Kumar, Shaikh, Patel, Sheikh, Behera, Pruseth, Ravi and Tappe2021). Their FeOT (31.9–36.3 wt.%) is relatively high and are characterised by high Fe2+T# (0.85 to 1), very low Ti# (0.06–0.09) and Fe3+T# (0.06–0.12), thus plot near the base and close to the chromite end of the magnesiochromite–chromite edge on the Ti# vs. Fe2+T# compositional bivariate plot of the front face of the reduced iron spinel prism (Fig. 9).
Compositional variation of spinels from Marepalli and Gundrapalli lamproite projected onto the front face of the reduced iron-spinel compositional prism (Mitchell, Reference Mitchell1986). Compositional fields and trends for spinels from kimberlites (T1) and lamproites (T2) from Mitchell (Reference Mitchell1986, Reference Mitchell1995). The dotted circular field for spinels from other Ramadugu lamproites is shown (Chalapathi et al., Reference Chalapathi Rao, Kumar, Sahoo, Dongre and Talukdar2014). Also shown are the spinels from Vattikod lamproite (Gurmeet Kaur et al., Reference Gurmeet, Mitchell and Ahmed2018). The blue arrow shows the compositional evolutionary trend of spinels from core to rim.

Representative compositions (wt.%) of spinels.

n.d. – not detected; FeO* – total Fe expressed as FeO; Fe2O3 and FeO calculated on a stoichiometric basis; C – Core and R – Rim.
Compositions: 1–8, 12–15, groundmass; 9–11, 16, included in olivine pseudomorphs at rims.
Representative compositions (wt.%) of spinels (continued).

n.d. – not detected; FeO* – total Fe expressed as FeO; C – Core and R – Rim; Fe2O3 and FeO calculated on a stoichiometric basis.
Compositions: 17# – 23#, Gundrapalli spinels.
The compositions of the Marepalli spinels are characterised by an increase in Fe2+T# at nearly constant and low Ti# and do not follow any magmatic trend on the Ti# vs. Fe2+T# bivariate plot. These spinels are less evolved with compositional range from titanian magnesian chromite (TMC) to titanian chromite (TC), due to their low Ti and Fe3+ contents (Fig. 9). The Marepalli spinels are analogous to those in the Vattikod, Gundrapalli and Ramadugu cluster lamproites of Ramadugu Lamproite Field but exhibit a relatively wide range for Fe2+T# (Fig. 9; Chalapathi Rao et al., Reference Chalapathi Rao, Kumar, Sahoo, Dongre and Talukdar2014; Gurmeet Kaur et al., Reference Gurmeet, Mitchell and Ahmed2018; Gurmeet Kaur and Mitchell, Reference Gurmeet and Mitchell2019). Marepalli spinels are characterised by the enrichment of Zn (up to 6.28 wt.% ZnO) and Mn (up to 3.6 wt.% MnO) trending from core towards rim (accompanied by groundmass grains), which are comparable to the spinels in the Vattikod lamproites (0.4–5.6 wt.% ZnO; 1.7–2.3 wt.% MnO; Gurmeet Kaur et al., Reference Gurmeet, Mitchell and Ahmed2018) and Gundrapalli lamproite (up to 3.6 wt.% ZnO; up to 2.3 wt.% MnO; Gurmeet Kaur and Mitchell, Reference Gurmeet and Mitchell2019). However, the spinels occurring in the Ramadugu, Somavarigudem and Yacharam lamproites of Ramadugu Lamproite Field lack Zn but have high Mn content (0.95–1.4 wt.% MnO; Chalapathi Rao et al., Reference Chalapathi Rao, Kumar, Sahoo, Dongre and Talukdar2014).
Apatite
Representative compositions of Marepalli apatite are given in Table 6. These are enriched in SrO (up to 2.9 wt.%) and fluorine (up to 3.7 wt.%); a characteristic compositional feature found in lamproitic apatites (Mitchell and Bergman, Reference Mitchell and Bergman1991). These fluoroapatites are poor in FeOT (<0.5 wt.%), MgO (<0.4 wt.%), Na2O (<0.2 wt.%), K2O (<0.2 wt.%) and lack BaO. The SiO2 content varies from 0.5 to 1.9 wt.%. The rare earth element (REE) content is low (<0.8 wt.% Ce2O3; <0.6 wt.% Nd2O3). The Marepalli fluoroapatites are similar to those recorded previously from the Vattikod and the Gundrapalli lamproites (Gurmeet Kaur et al., Reference Gurmeet, Mitchell and Ahmed2018; Gurmeet Kaur and Mitchell, Reference Gurmeet and Mitchell2019). The compositional zoning observed in one of the Marepalli apatite microphenocrysts indicates variation in its F, SrO and REE contents from core to rim. The core contains significant F (2.6 wt.%), low SrO (0.8 wt.%) and not detectable REE (by scanning electron microscopy), whereas the rim shows marked enrichment in F (3.5 wt.%) and SrO (2.9 wt.%) and has low REE (0.7 wt.% Ce2O3).
Representative compositions (wt.%) of apatite.

n.d. – not detected; FeO*total Fe expressed as FeO; C – Core and R – Rim.
Compositions: 1, apatite included in phlogopite; 2–3, groundmass apatites; 4–5, phenocrystal apatites; 6–7, apatites partially included in pyroxenes.
Titanite and allanite
Representative compositions of Marepalli titanite are given in Table 7. All textural varieties of titanite are compositionally similar and have low Al2O3 (1.2–2.3 wt.%), MgO (<0.9 wt.%) and FeOT (1.4–1.7 wt.%). Similar titanite has also been reported previously from the Ramadugu, Somavarigudem, Yacharam, Vattikod and Gundrapalli lamproites (Chalapathi et al., Reference Chalapathi Rao, Kumar, Sahoo, Dongre and Talukdar2014; Gurmeet Kaur et al., Reference Gurmeet, Mitchell and Ahmed2018; Gurmeet Kaur and Mitchell, Reference Gurmeet and Mitchell2019). Representative compositions of Marepalli allanite are given in Table 7. The Marepalli allanites are rich in FeOT (14.4–15.0 wt.%) and CaO (11.4–12.4 wt.%) with significant amounts of Al2O3 (13.6–14.3 wt.%) and MgO (0.5–0.7 wt.%). These allanites are extremely enriched in LREEs (10.5–11.1 wt.% La2O3; 7.9–8.4 wt.% Ce2O3; 0.4–0.5 wt.% Nd2O3; 0.4–0.8 wt.% Pr2O3). Allanite is not a common phase in lamproites however it has been reported previously from the Vattikod lamproites (Gurmeet Kaur et al., Reference Gurmeet, Mitchell and Ahmed2018).
Representative compositions (wt.%) of titanite and allanite.

n.d. – not detected; FeO* – total Fe expressed as FeO
Compositions: 1–4, groundmass titanite aggregates enclosing amphiboles; 5, titanite along margin of olivine pseudomorph; 6–8, allanite included in leucite pseudomorph.
Discussion and conclusions
Detailed mineralogical data for all primary major, minor and accessory phases are required for the correct characterisation and classification of lamproites and kimberlites (Scott Smith and Skinner, Reference Scott Smith and Skinner1984; Mitchell and Bergman, Reference Mitchell and Bergman1991; Mitchell, Reference Mitchell1995; Woolley et al., Reference Woolley, Bergman, Edgar, Le Bas, Mitchell, Rock and Scott Smith1996; Mitchell, Reference Mitchell2020a). This investigation of the Marepalli dyke demonstrates that it is a bona fide lamproite. This conclusion is supported by the presence and distinct composition of the major typomorphic minerals of lamproite such as: Al-poor, Ti-Fe-rich phlogopite; pseudoleucite; Ti-K-rich richterite; Al-Na-poor diopside; Al-poor titanian magnesian chromite and titanian chromite. Minor and accessory minerals are Sr-F-rich, REE-poor apatite together with late-stage residual titanite and K-feldspar. The alumina-poor phlogopites display compositional zonation trends of almost constant Al2O3 with increasing FeOT and TiO2 as compared to the archetypal kimberlites and typically occupy the lamproite fields (Fig. 6a–b). The alumina-poor (Al2O3 <0.7 wt.%) amphiboles exhibit compositional evolution from titanian potassic-katophorite through potassic-ferro-katophorite, potassic-katophorite, potassic-ferro-richterite, potassic-richterite to titanian potassic-arfvedsonite, and show affinity with those in the West Kimberley (Fig. 7a), Smoky Butte and Leucite Hills lamproites (Fig. 7b). All the pyroxenes are diopsidic in composition with low Al2O3 (<0.4 wt.%), Na2O (<0.6 wt.%), and fall well within the lamproite field (Fig. 8). The spinels are alumina-poor (Al2O3 <2.8 wt.%), with compositional evolution from titanian magnesian chromite (TMC) cores to titanian chromite (TC) rims and groundmass grains, marked by an increase in Fe2+T# at nearly constant and low Ti# and Fe3+# (Fig. 9). The fluoroapatites are characterised by low Sr content in the cores and Sr and F enrichment in the rims, again typical of lamproites. Former euhedral olivine and anhedral leucite are now present as pseudomorphs in the Marepalli rock. The rock might have undergone late-stage/post-magmatic carbonisation and silicification which led to the secondary replacement of leucite grains by calcite and quartz.
According to the above mineralogical data using a mineralogical genetic classification scheme for potassic-ultrapotassic rocks, we classify the Marepalli dyke rock as a ‘pseudoleucite-amphibole-phlogopite lamproite’. Although typomorphic minerals such as the priderite group and wadeite are absent in the Marepalli rock, the presence of abundant Ti-rich, Al-poor phlogopite, primary clinopyroxene (diopside), K-richterite, K-feldspar, leucite (now pseudomorphed) and titanite clearly support a lamproite classification. The absence of monticellite, abundant primary carbonates (calcite and/or dolomite) and melilite clearly exempt the Marepalli rock from being classified as kimberlite or an ultramafic lamprophyre (Mitchell and Bergman, Reference Mitchell and Bergman1991; Mitchell, Reference Mitchell1986, Reference Mitchell1995; Tappe et al., Reference Tappe, Foley, Jenner and Kjarsgaard2005; Mitchell, Reference Mitchell2020a).
The increasing FeOT content accompanied by significant MgO depletion at almost constant Al2O3 in Marepalli phlogopite rims and groundmass indicate the VIFe2+ enrichment and highlight the reducing state of the evolving magma (Mitchell and Bergman, Reference Mitchell and Bergman1991). Similarly, low FeOT in clinopyroxene (diopside) and absence of aegirine also support the low oxidation state of the evolving magma. The crystallisation of F-bearing phlogopite and F-rich apatite also indicate the reducing environment conditions (Foley et al., Reference Foley, Taylor and Green1986; Talukdar et al., Reference Talukdar, Pandey, Chalapathi Rao, Kumar, Belyatsky and Lehmann2018). The low Ti# and Fe3+# of Marepalli spinels could be due to their crystallisation from less evolved magma composition or crystallisation from magma under reducing conditions (Mitchell, Reference Mitchell1986). The Marepalli spinels show a narrow compositional range from titanian magnesian chromite to titanian chromite and are similar to those in Hills Pond lamproite (Mitchell, Reference Mitchell1985), TK4 lamproite of the Wajrakarur Lamproite Field (Shaikh et al., Reference Shaikh, Patel, Ravi, Behera and Pruseth2017) and the Aliyabad lamproite of the Banganapalle Lamproite Field (Kumar et al., Reference Kumar, Shaikh, Patel, Sheikh, Behera, Pruseth, Ravi and Tappe2021). These zoned spinels are exceptionally enriched in Mn and Zn which might be due to the high oxygen fugacity of the magma or enrichment by the hydrothermal process as suggested by Kumar et al. (Reference Kumar, Shaikh, Patel, Sheikh, Behera, Pruseth, Ravi and Tappe2021). However the particular compositions of phlogopite, clinopyroxene, apatite and spinels clearly rule out an increase in the oxidation state of the magma during evolution. Thus, the Mn–Zn enrichment in rims of Marepalli spinels could be due to the hydrothermal processes as inferred for Aliyabad spinels (Kumar et al., Reference Kumar, Shaikh, Patel, Sheikh, Behera, Pruseth, Ravi and Tappe2021). Mn and Zn enrichment in spinel rims occur by the substitution of Mg2+ and Fe2+ by Mn and Zn when the magma interacts with mineralising fluids enriched in Mn and Zn (Fanlo et al., Reference Fanlo, Gervilla, Colás and Subías2015).
The Marepalli dyke represents a particular variety of lamproite crystallised from Na-Ca-Al poor and Ti-Cr-K rich magma derived from the partial melting of a local metasomatised mantle source. It can be related genetically to the Vattikod, Gundrapalli and Ramadugu cluster, which lies in close proximity, in the Ramadugu Lamproite Field. The minor mineralogical variations in the intra-field lamproites are a result of the differentiation of the common parent magma (Gurmeet Kaur et al., Reference Gurmeet, Mitchell and Ahmed2018).
Acknowledgements
GK is grateful to Panjab University for granting her leave to carry out studies on Marepalli lamproite at Lakehead University, Thunder Bay, Ontario. The authors wish to acknowledge Dr. Somnath Thakur for helping us in the geo-referencing of the map. JS and PK, senior research fellows at Panjab University, Chandigarh are thankful to CSIR for awarding them the fellowship. The authors are thankful to Prof. Sebastian Tappe and an anonymous reviewer for the critical review and their valuable comments and suggestions that helped to improve the manuscript.
Competing interests
The authors declare none