INTRODUCTION
The major foliar pathogen of winter wheat (Triticum aestivum) in Ireland is Septoria leaf blotch, caused by Mycosphaerella graminicola (Fückel) Schroeter (Anamorph: Septoria tritici Rob. ex Desm.). Left untreated, it can reduce grain yield by more than 50% (Dunne Reference Dunne2004). Effective control of M. graminicola is provided by a range of fungicides (Gooding et al. Reference Gooding, Dimmock, France and Jones2000). Fungicide programmes to control M. graminicola in winter wheat currently cost about €180/ha. In addition to reducing this cost, there is an increasing preference for reduced chemical usage in crop production (Jørgensen Reference Jørgensen2001).
Under current farm practice, fungicides are applied in a prophylactic manner, with timing of applications dictated by crop growth stage. This method of scheduling fungicide applications is long established (Cook Reference Cook1977; Jordan et al. Reference Jordan, Hunter, Fielding, Stinchombe, Hutcheon, Rooney, Huxley and Clay1986; Hims & Cook Reference Hims and Cook1991). Timing of cereal fungicide applications using crop growth stage as the key determinant takes no account of pathogen epidemiology, but relies on chance to ensure that fungicide application coincides with a sensitive stage in the pathogen's population dynamics. Such prophylactic application of fungicides is often wasteful (Parker et al. Reference Parker, Lovell and Royle1997), does not closely match the level of disease (Hardwick et al. Reference Hardwick, Turner, Slough, Elcock, Jones and Gladders2002) and does not take account of cultivar susceptibility/resistance (Clarke Reference Clarke2003).
Information regarding the host–pathogen–environment components of the disease triangle such as cultivar susceptibility, M. graminicola infection level and weather conditions can be readily obtained. Assimilating all this data into a decision to withhold or apply fungicide, and furthermore determining the type and rate of fungicide to apply, is an extremely complex task. Recognizing this difficulty, extensive research effort over some 20 years has focused on the development of risk-based models which would assist in the decision-making process. A reliable decision support system (DSS) would estimate the likelihood of epidemic development, replace routine spraying with targeted applications and give cereal growers the opportunity to use less fungicide in seasons of low disease pressure, with consequent economic, food safety and environmental benefits. In the current study, in six trials carried out during 3 years, the efficacy of the DSSs, CerDis (W. Nugteren, Opticrop, personal communication), DESSAC (Brooks Reference Brooks1998), Crop Protection Online (CPO, formerly Pl@nteinfo, Secher et al. Reference Secher, Jørgensen, Murali and Boll1995), PLANT-Plus (Raatjes et al. Reference Raatjes, Hadders, Martin, Hinds, MacKerron and Haverkort2003), proPLANT Expert (Newe et al. Reference Newe, Meier, Johnen and Volk2003) and Septoria Timer (Verreet et al. Reference Verreet, Klink and Hoffmann2000) to schedule fungicides for the control of M. graminicola in two winter wheat cultivars was compared with that of routine 2-spray and 3-spray programmes.
The DSSs under evaluation are either in-crop (Septoria Timer) or interactive computer-based programs (CerDis, DESSAC, CPO, PLANT-Plus and proPLANT Expert), which use analytical models to formulate decisions on disease control in winter wheat. The in-crop Septoria Timer comprises a sensor, which seeks to mimic the duration of leaf wetness and a datalogger. An integrated algorithm utilizes a duration of leaf wetness of more than 48 h, combined with a relative humidity of >98% to calculate the occurrence of a M. graminicola infection period. The grower uses this information to determine if an application of fungicide is warranted and selects the appropriate compound and application rate. The interactive DSSs specify whether or not disease control measures are warranted. If a fungicide application is required, they recommend the fungicide products to use and advise their application rate. The DESSAC system is further designed to evaluate the economic impact of its recommendations.
With the interactive systems, the decision-making process is dependent upon the user inputting data on cultivar, crop growth stage, current and historical meteorological data as well as updates on the prevailing disease status. Algorithms take account of these factors when analysing a situation and utilize the information to formulate a site-specific decision whether to withhold or apply fungicide. In contrast to routine applications, such a rational approach takes account of cultivar susceptibility, disease epidemiology and pathogen population dynamics.
MATERIALS AND METHODS
The winter wheat cultivars Claire (rated ‘moderately resistant’ to Septoria, Anon. 2002) and Madrigal (rated ‘susceptible’ to Septoria, Anon. 2002) were planted as separate experiments on 17 October 2002, 22 October 2003 and 12 October 2004. The field layout was a randomized complete block design and treatments were replicated six times (plot size 20×2·25 m). The Septoria Timer (Theis Clima, Germany) was placed in the crop at the onset of stem elongation (GS 32, Zadoks et al. Reference Zadoks, Chang and Konzak1974). Meteorological data for incorporation into the interactive DSSs were collected at a station located some 200 m from the experimental site, except for the data utilized by the proPLANT Expert DSS that were obtained from an Irish Meteorological Service station at Kilkenny – some 40 km away.
Fungicides were applied as a 3-spray programme at growth stages 32, 39 and 65/69 (Standard Treatment 1) 2-spray programme at growth stages 37 and 65 (Standard Treatment 2) and according to Septoria infection risk periods, as indicated by the Septoria Timer. Fungicides scheduled by the interactive DSSs were applied at the rate and frequency advised. Fungicides were applied using an Azo plot sprayer with a boom width matched to plot width and carried on the back of the spray operator. The sprayer was fitted with Birchmeier Helico Sapphire nozzles (Whirling Pin 673 A) having 1·6 mm aperture. The spray was applied at a pressure of 2·5 bar, using propane gas as the propellant. Spray volume was equivalent to 220 l/ha. The walking speed of the sprayer operator was gauged initially to deliver the desired amount of spray over the area requiring treatment.
The following compounds were applied: ‘Amistar’ (azoxystrobin, 250 g/l), ‘Allegro’ (kresoxim-methyl 125 g/l+epoxiconazole 133·3 g/l), ‘Bravo’ (chlorothalonil, 500 g/l), ‘Caramba’ (metconazole, 60 g/l), ‘Fandango’ (fluoxastrobin 100 g/l+prothioconazole 100 g/l), ‘Folicur’ (tebuconazole, 250 g/l), ‘Impact-Excel’ (flutriafol 47 g/l+chlorothalinil 300 g/l), ‘Mantra’ (fenpropiomorph 150 g/l), ‘Menara’ (propioconazole 250 g/l+cyproconazole, 160 g/l), ‘Modem’ (pyraclostrobin 250 g/l), ‘Opera’ (pyraclostrobin 133 g/l+epoxiconazole 50 g/l), ‘Opus’ (epoxiconazole 125 g/l), ‘Opus Team’ (epoxiconazole 84 g/l+fenproprimorph 250 g/l), ‘Proline’ (prothioconazole 250 g/l), ‘Pronto Plus’ and ‘Beam’ (spiroxamine 250 g/l+tebuconazole 133·3 g/l), ‘Prosaro’ (prothioconazole 125 g/l+tebuconazole 125 g/l), ‘Sanction’ (fusilazole 400 g/l), ‘Tern’ (fenpropidin 750 g/l), ‘Unix’ (cyprodinil, 750 g/kg) and ‘Venture’ (epoxiconazole 67 g/l+boscalid 233 g/l).
The choice of fungicide and application rates in Standard Treatments 1 and 2 are based upon continuing research at Oak Park Crops Research Centre and is representative of commercial farm practice. The Septoria Timer signals the occurrence of an M. graminicola infection period, but the operator chooses the fungicidal compound and the application rate. Of the remaining systems DESSAC, proPLANT Expert, CerDis and CPO, advise the fungicide, the application rate and timing. PLANT-Plus advises the application timing and a category of compound (e.g. ‘contact’, ‘translaminar’, etc.) while the operator then selects the fungicide and decides on the application rate. The outcome of these varying systems is presented in Tables 1–3.
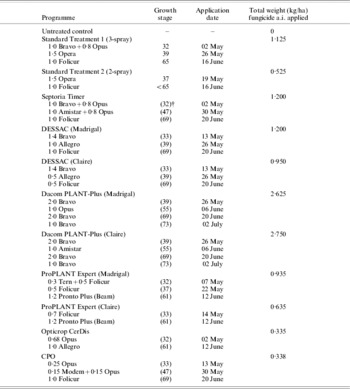
Summary of fungicides (l/ha), crop growth stage, application date and total load of fungicide active ingredient applied to wheat cvs Madrigal and Claire Footnote * in 2003

* Entries are applicable to both cultivars, except where specified.
† Growth stages in brackets denote the GS on the date of application advised by a DSS.
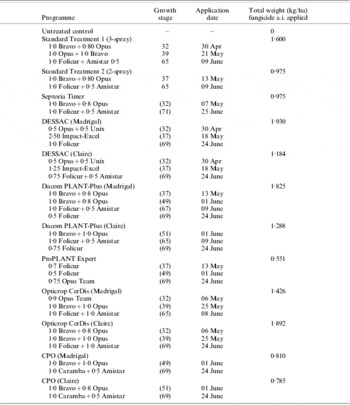
Summary of fungicides (l/ha), crop growth stage, application date and total load of fungicide active ingredient applied to wheat cvs Madrigal and Claire 2004

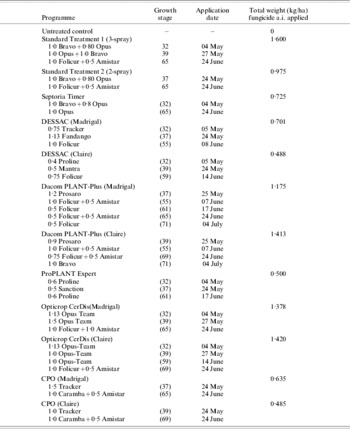
Summary of fungicides (l/ha), crop growth stage, application date and total load of fungicide active ingredient applied to wheat cvs Madrigal and Claire 2005

Disease assessments commenced with the first observations of M. graminicola lesions on leaf F-3 (the fourth from the top, the flag leaf being leaf F). The infected areas of the four uppermost leaves were assessed at weekly intervals using an assessment key (Anon. 1972) until complete necrosis or senescence of the leaves. The area under the disease progress curve (AUDPC) for all fungicide programmes was calculated from these assessments using the formula developed by Fry (Reference Fry1978).
The crops were harvested on 21 August 2003, 27 August 2004 and 11 August 2005. In the Results and Discussion sections, and also in the Tables, the years 2003, 2004 and 2005 refer to the year during which the crops were treated with fungicide and harvested. The grain from each plot was weighed, the moisture content of the grain was determined and grain yield at 85% dry matter (DM) calculated. The results for leaf necrosis were transformed using an arcsine transformation to achieve an approximately normal distribution and then log transformed to stabilize the variance of the transformed values.
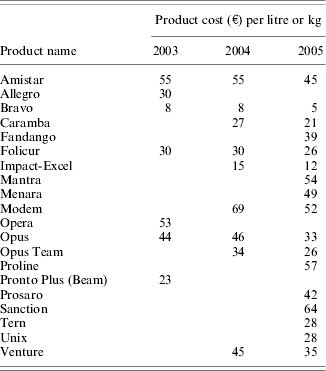
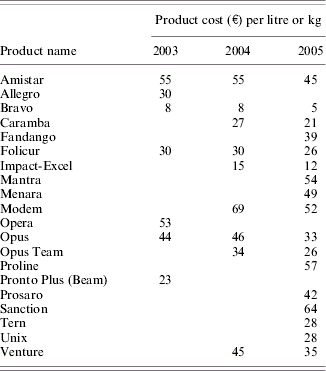
The response variables AUDPC, grain yield and grain-specific weight (g/hectolitre) and margin over fungicide cost (MOFC) were analysed using a mixed models approach with PROC GLIMMIX of SAS 9.1©. (The GLIMMIX procedure allows for correctly adjusted tests of treatment differences within factor levels of an interaction.) The trials were analysed separately in the first instance and then the 3 years were combined in the same modelling framework. For the individual years, the treatments were taken as fixed effects and the replications (blocks) as random. While it is possible to argue that the individual years could be taken as a random effect in terms of their effect on the crop, the number of years was too few for reliable estimation of the random effect and subsequent inference. For the combined analysis therefore, years and treatment×year interactions were treated as fixed effects. The replications were modelled as nested within years. Tukey–Kramer adjustment was used to control error rates in the multiple comparisons of treatment means. A MOFC was determined for each plot. Grain was valued at €123/t (2003) and €125/t (2004 and 2005) at 150 g/kg moisture content. Fungicide products were costed at recommended retail prices (Appendix 1). For some treatments, the financial value of the increased grain yield resulting from fungicide application was less than the cost of the fungicide programme – giving rise to negative values.
RESULTS
Fungicide applications, timing and rate
The timing of fungicide applications, the rate and the number of applications also the amounts of active ingredient are presented in Tables 1–3.
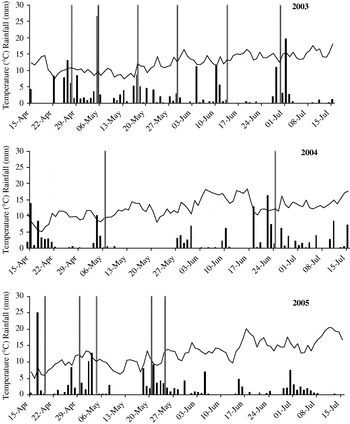
The first application of Standard Treatment 1 to both cultivars was scheduled at GS 32. Over the six trials, the Septoria Timer signalled the occurrence of an M. graminicola infection period to coincide with GS 32 (Fig. 1) and fungicide was applied in response. In 2003, proPLANT Expert scheduled a fungicide application to the M. graminicola sensitive cultivar Madrigal coinciding with GS 32, but withheld the application for a further 7 days to the more resistant cultivar Claire. Similarly in 2004, PLANT-Plus scheduled the first application to Madrigal at GS 37 but withheld the first application to Claire until GS 51. Otherwise, the DSSs did not differentiate between the relative susceptibilities of the cultivars in scheduling the first application.
Daily mean temperature (°C)(line), rainfall (mm)(bars) and Septoria Timer infection periods (hatched vertical lines), 2003–05.

In 2003, proPLANT Expert responded to cultivar susceptibility by scheduling an additional application to cv. Madrigal at GS 37, resulting in three applications compared with two applications to cv. Claire. The DSS CerDis scheduled two applications to cv. Madrigal in 2003 compared with three or four applications for the other systems while in 2004 and 2005, the CPO system also scheduled only two applications. On cv. Claire, the proPLANT Expert and CerDis systems scheduled two applications in 2003, while CPO scheduled two applications in both 2004 and 2005.
The choice of fungicide and the application rates advised by the various DSSs is presented in Tables 1–3. Using Standard Treatment 1 as a reference, the relative amounts of fungicidal active ingredient can be compared. Towards the objective of reducing fungicide input, the CerDis system advised the lowest rates on cvs Madrigal and Claire in 2003, proPLANT Expert advised the lowest rates in 2004 while in 2005 proPLANT Expert advised the lowest rate on cv. Madrigal with CPO advising the lowest rates on cv. Claire.
Disease control
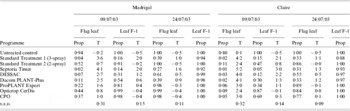
Pycnidia of M. graminicola were first observed on the primary leaf on both cultivars on 19 December 2002, 22 January 2004 and 7 January 2005. The effectiveness of fungicide programmes scheduled by the DSSs and Standard Treatments to control M. graminicola is shown in Tables 4–6. In 2003, control was expressed as a reduction in the proportion of flag leaf and leaf F-1 displaying symptoms of M. graminicola-induced necrosis (Table 4). The relatively large number of fully necrotic leaves required particular care in the assessment of the transformation of these data. For all but the final set of results for leaf F-1, the residuals from the analysis showed that the transformation was successful. The alternative approach of grouping the data and performing a categorical analysis could not be pursued because of insufficient data. The differences observed for the final set of values for leaf F-1 were judged to be of no practical importance. All fungicide programmes provided a significant (P<0·05) reduction of M. graminicola compared with the untreated control. There were significant (P<0·05) differences in the effectiveness of control provided by the fungicide programmes. Only the 3-spray programme and the Septoria Timer provided consistently high levels of control while the 2-spray programme provided low levels of control. For the remaining programmes, the effectiveness of control varied with observation date, leaf and cultivar
Effect of fungicide scheduling programmes on the proportion of leaves necrotic in wheat cvs Madrigal and Claire, 2003 (T=transformed value)

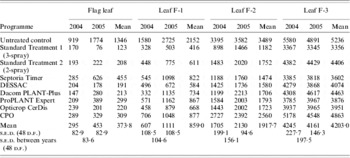
Effect of fungicide programme on AUDPC of wheat cv. Madrigal, 2004 and 2005

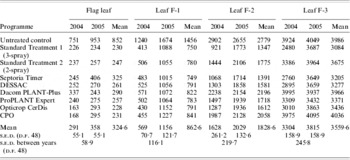
Fungicide programme by year interaction on AUDPC, cv. Claire, 2004 and 2005

In 2004 and 2005, the effectiveness of M. graminicola control is expressed as a reduction in AUDPC. For this and all subsequent analyses, the homogeneity of variance was tested for the combined analysis across years and the variances for years were found to be significantly different. The models therefore incorporated a component of variance for each year. Analysis of residuals did not indicate any difficulty in meeting the assumptions of the analysis.
For the flag leaf, leaves F-1 and F-2 of cv. Madrigal (Table 5), the main effect of ‘year’ (growing season) on AUDPC values was highly significant (P<0·001), but values for F-3 were not significantly (P=0·380) affected by growing season. Values of AUDPC for all four leaves were significantly (P<0·001) reduced by fungicide programmes compared with the untreated control and there was a significant (P<0·001) growing season by fungicide programme interaction for all leaves. Flag leaf AUDPC values in 2004 were some 35% lower than in 2005. After treatment with the 3-spray programme DESSAC and CerDis systems, they were higher in 2004 compared with 2005. Although the mean AUDPC value for leaf F-1 in 2005 was almost twice that for 2004, the value after treatment according to PLANT-Plus in 2005 was some 3·5-fold higher compared with 2004. The AUDPC values for DESSAC and the CPO systems were similar in both seasons. Similarly for leaf F-2, AUDPC values for the untreated control and eight of the fungicide programmes were lower in 2004 compared with 2005, the CPO system being-lower in 2005. In contrast, AUDPC values of leaf F-3 for the untreated control, the 3-spray programme, DESSAC and CPO programmes were higher in 2004 compared with 2005.
Growing season significantly (P<0·05) affected AUDPC values for cv. Claire in 2004 and 2005 (Table 6). Values were significantly (P<0·001) reduced by fungicide application programmes compared with the untreated control and for the flag leaf, leaves F-2 and F-3, there was a significant (P<0·001) year by fungicide programme interaction. For these leaves the values were higher in 2005 compared with 2004 except for the PLANT-Plus system and also for the untreated control of leaf F-2. There was no interaction (P=0·282) between fungicide programme and growing season for leaf F-1.
Grain yield
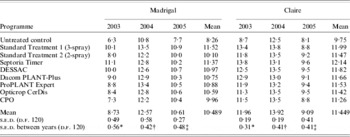
The effect of fungicide applications on grain yield of cvs Madrigal and Claire show the main effects of year and fungicide application programme to be highly significant (P<0·001) and there was a significant (P<0·001) year×fungicide programme interaction (Table 7). For cv. Madrigal, mean yields at harvest in 2003 in response to fungicide application were lower than in 2005, but grain yield for the Septoria Timer programme was higher in 2003 than in 2005. Similarly for cv. Claire, despite lower mean yield in 2003 compared with 2004, the Septoria Timer programme provided a higher yield in 2003 than in 2004, contributing to a significant interaction.
Mean grain yield (t/ha) of wheat cvs Madrigal and Claire in response to various fungicide programmes, 2003, 2004 and 2005

* 2003 v 2004.
† 2003 v 2005.
‡ 2004 v 2005.
Grain quality
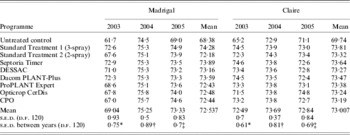
Grain specific weight (g/hectolitre) of cvs Madrigal and Claire is presented in Table 8. Grain specific weight responded significantly to year (cv. Madrigal: P<0·001; cv. Claire: P=0·014 and fungicide application programme (P<0·001) and there was a significant (P<0·001) year×fungicide programme interaction. For cv. Madrigal at harvest in 2004 and 2005, grain specific weight values were similar. In 2003, the values for 3-spray programme, Septoria Timer, DESSAC and PLANT-Plus closely resembled the 2004 and 2005 values, but values for the remaining programmes were significantly lower. Similarly for cv. Claire, the values for 2004 mirrored the values for 2005, except for the CerDis system in 2005, which provided significantly higher values, while the 2003 values followed no consistent pattern, contributing to the year by fungicide programme interaction.
Mean grain specific weight (g/hectolitre) of wheat cvs Madrigal and Claire after various fungicide programmes 2003, 2004 and 2005

* 2003 v 2004.
† 2003 v 2005.
‡ 2004 v 2005.
MOFC
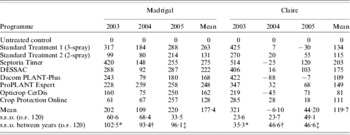
Values for MOFC are presented in Table 9. The main effect of year was not significant (P=0·379) for cv. Madrigal but highly significantly (P<0·001) for cv. Claire. For both cultivars, the main effect of fungicide programme was significant (P<0·001) and there was a significant (P<0·001) year×fungicide programme interaction. Effects of fungicide programmes on MOFC were more consistent than were effects over years, contributing to the significant year×fungicide programme interaction. For cv. Madrigal in 2003, there were large differences between MOFC values for programmes 2 and 3 also between programmes 2 and 9, but in 2005 these differences were considerably less. Over the three seasons and six trials, the Septoria Timer most frequently provided the highest MOFC. The DESSAC and proPLANT Expert systems provided margins similar to the 3-spray programme.
Fungicide programme by year interaction on MOFC, cvs Madrigal and Claire, 2003, 2004 and 2005

* 2003 v 2004.
† 2003 v 2005.
‡ 2004 v 2005.
DISCUSSION
A successful DSS should improve the timing of fungicide application and when conditions warrant, should reduce both the frequency of applications and the rate of active ingredient, while maintaining similar economic returns.
Timing a fungicide application to coincide with a sensitive stage in the pathogen life cycle would be expected to provide improved control compared with prophylactic application (Verreet et al. Reference Verreet, Klink and Hoffmann2000). However, since M. graminicola is a multi-cycle pathogen it is likely that there are several stages of infection present, from spores recently arrived to lesions visible on the leaf. Furthermore, the stages may vary in the degree to which they are amenable to control, since most of the fungicides currently in use rely on protection rather than on ‘cure’.
Under conditions in Ireland, winter wheat crops become infected with M. graminicola soon after emergence, therefore the rationale underlying the 3-spray programme is to schedule applications so as to protect the four uppermost yield determining leaves and the ear. When this system schedules the first application at GS 32, leaf F-3 is fully emerged and up to half of leaf F-2 may also be exposed to fungicides applied at this stage. The 3-spray programme consistently provided the greatest control of M. graminicola on leaves F-2 and F-3 of both cv. Madrigal and Claire in 2004 and 2005, illustrating the validity of the approach. While the contribution to grain yield from leaf F-3 is approximately 0·03, the contribution from leaf F-2 approaches 0·10 (Anon. 2006). In addition, controlling infection on the lower leaves helps to delay the spread to the uppermost yield-determining leaves. In an analysis of factors determining the severity of epidemics of M. graminicola, Shaw & Royle (Reference Shaw and Royle1993) identified rainfall as the major driver of disease development after GS 31. Furthermore, Chungu et al. (Reference Chungu, Gilbert and Townley-Smith2001) observed more pycnidia when leaf wetness duration was 72 h compared with 48 and 60 h. The Septoria Timer responds both to rainfall and duration of simulated leaf wetness to calculate the occurrence of a M. graminicola infection period and among the DSSs it provided the most consistent reduction in AUDPC for leaves F-2 and F-3 of both cultivars in 2004 and 2005, while CPO provided the least effective control on these leaves.
Cook et al. (Reference Cook, Hims and Vaughan1999) demonstrated that most effective control of M. graminicola on the flag leaf was achieved by timing fungicide application at or immediately following its emergence. At GS 37, F-1 is fully emerged and up to half of the flag leaf may be exposed to a fungicide applied at this stage. The first application under the 2-spray programme was scheduled to coincide with GS 37 but resulted in less effective control of M. graminicola on leaf F-2 compared with the 3-spray programme in 2004 and 2005. The poor performance of the 2-spray programme in 2003 can be attributed to the presence of high levels of strobilurin resistance in the Mycosphaerella population. Opera, which contains pyraclostrobin, was the main fungicide used in the standard programmes in that season and was applied at the commercially recommended rate. The proPLANT Expert system, which also scheduled the first application coinciding with GS 37 in 2004, similarly provided ineffective control on leaf F-2 on Madrigal and Claire.
At GS 39, both F-1 and the flag leaf are fully emerged. The only case of a DSS scheduling the first application of a fungicide at GS 39 was PLANT-Plus in 2003. The 3-spray programme which scheduled the second application of fungicide at GS 39 provided a consistently high level of M. graminicola control on leaf F-1 and the flag leaf. DSSs provided a comparable level of control on the flag leaf of cv. Madrigal in 2004 and leaf F-1 in 2005 and on both these leaves on cv. Claire in 2004 and 2005. In the seasons when there was a significant difference between the performance of the 3-spray programme and the programmes advised by the DSSs, the Septoria Timer, DESSAC PLANT-Plus and CerDis performed effectively on individual leaves of both cultivars but there was no consistent pattern to the control achieved.
Fungicide applications timed to coincide with GS 65 are designed to extend the protection against M. graminicola infection on the flag leaf and protect against Fusarium infection on the ear, thus promoting grain filling. Dimmock & Gooding (Reference Dimmock and Gooding2002) demonstrated that fungicides applied at flag leaf emergence (GS 37–39) and at ear emergence (GS 59) increased flag leaf green area duration, resulting in significant increases in grain yield and specific weight. For cvs Madrigal and Claire in 2003, when there were significant differences between the performance of DSSs, the DSSs which provided the lowest grain yield and specific weight scheduled applications both too early and too late to protect the uppermost yield determining leaves.
Under the conditions prevailing in Ireland (high levels of M. graminicola inoculum, regular rainfall events and moderate temperatures) a single application of fungicide will rarely be sufficient to provide adequate control. All the interactive DSSs responded to those conditions by scheduling at least two applications.
The in-crop Septoria Timer may signal the occurrence of several infection periods after GS 32, but infection periods which occur within the protected phase of the most recent fungicide application are ignored.
There are reports of over-application of fungicides to control M. graminicola (Hardwick et al. Reference Hardwick, Jones and Slough2001; Pietravalle et al. Reference Pietravalle, Shaw, Parker and van den Bosch2003). Two strategies might be employed to reduce fungicide active ingredient use – reduce the rate of application or reduce the number of applications. The DSS CPO advised application of the least active ingredient to the six trials over three seasons, while together with the Septoria Timer it also advised the least number of applications (average 2·3 per crop) compared with the 3-spray programme. This value is comparable with the finding of Hardwick et al. (Reference Hardwick, Jones and Slough2001) that winter wheat crops in England and Wales received on average 2·3 applications per crop over three years (1996–98). Bouma (Reference Bouma2003) investigated the contribution of DSSs towards the reduction of fungicidal active ingredient to cereal crops in the Netherlands and also observed that CPO advised the lowest input. Similarly, Jørgensen & Hagelskjaer (Reference Jørgensen, Hagelskjaer and Wolffhechel2003) compared the performance of four DSSs (CPO, DESSAC, proPLANT Expert and Septoria Timer) to schedule fungicide applications to winter wheat crops in Denmark and observed that CPO scheduled the lowest input of fungicides. In the current study, a reduction in active ingredient is regarded as a measure of ‘success’. However, this criterion takes no account of the relative toxicities of the various active ingredients. Cultivar susceptibility to M. graminicola could be expected to influence application strategy, with a susceptible cultivar requiring higher rates of fungicide compared with a less susceptible cultivar. The interactive DSSs responded to cultivar susceptibility where PLANT-Plus and proPLANT Expert increased the frequency and rate of application to cv. Madrigal compared with the levels applied to the less susceptible cv. Claire.
Effective control of M. graminicola relies not only on timing of application but also on choice of fungicidal product and rate of application. The choice of product and the rates applied following the 3-spray programme, 2-spray programme, Septoria Timer was informed by fungicide efficacy trials conducted at Oak Park Crops Research Centre.
The PLANT-Plus system advises fungicide by classification/mode of action, with the choice of product being dictated by the operator. The remaining interactive systems advise the product and the rate of application. While recognizing that products vary in their efficacy, the objective of the current study was to compare the effectiveness of a number of DSSs. It is assumed that the designers of the DSSs have taken fungicide efficacy and cost into consideration and that the relative merits these factors are utilized when the system generates a recommendation.
The prophylactic approach of stage-based spraying has been successfully employed in commercial winter wheat growing over many years. Septoria leaf blotch is the main foliar disease of winter wheat in Ireland. The standard 3-spray programme is designed to protect the main yield determining leaves and ear over the growing season. In high disease pressure seasons such as 2003 and 2005, the 3-spray achieves this goal and it would be difficult for a decision-based programme to outperform it. In a low disease pressure season, such as 2004, a 3-spray would apply an excess of fungicide. In such a season, the DSSs respond by achieving the same level of disease control as the standard 3-spray programme, with a reduction in the amount of fungicide applied, with fewer applications and at a lower cost.
A statistically adequate test of a DSS system would require several years of investigation at multiple sites to allow for seasonal and environmental variations. But the pace of technical change in agriculture means that new cultivars, new disease control products and new applications techniques which might be developed during the course of such a long-term study could render the conclusions less relevant.
In summary, over three seasons and on two cultivars, the 3-spray programme delivered a consistent and effective control of M. graminicola whereas the 2-spray programme was considerably less effective. Grain yields were highest following the 3-spray programme except for 2003 when the Septoria Timer provided significantly higher yield of both cultivars. There was marked variation in the performance of the interactive DSSs with individual systems reducing fungicide input and providing effective control of M. graminicola on either cv. Madrigal or Claire in different seasons. No interactive DSS consistently out-yielded the 3-spray programme. MOFC provides a useful basis for comparison across the eight systems under evaluation since it responds to fungicide input costs and increases in grain yield. If this parameter is accepted as the criterion of success, then the in-crop Septoria Timer was the most successful since it most frequently provided the highest margins over fungicide cost.
The authors thank James Grant and Paula Reid for statistical analysis, James Grace for technical assistance and also E. Shiels and J. P. Fenlon for field assistance.
Fungicide cost (€), 2003–05