

Background
In the jurisdiction in which this study was conducted, seclusion is defined as ‘the sole confinement of a person at any hour of the day or night in a room of which the doors and windows are locked from the outside’ and may be used only with a person receiving treatment for a mental disorder ‘if it is necessary to protect the person or any other person from an immediate or imminent risk to his or her health or safety or to prevent the person from absconding’ (Victorian Government, 1986, p 129). Seclusion, with its infringement of civil liberty and frequent negative psychological impact on patients, is rightly regarded as a controversial management method and efforts are made to reduce its use to a minimum.
Services have tried various ways of minimizing or averting seclusion, along with other management practices, like restraint, that can be experienced as oppressive. A review of methods to reduce or eliminate seclusion and restraint found rates of use varied widely and that initiatives to limit their use can often have dramatic effects (Busch & Shore, Reference Busch and Shore2000). The kinds of factors implicated in seclusion levels and their reduction have included nursing staff levels (Donat, Reference Donat2002) and skill mix (De Lacy, Reference De Lacy2006), and identification of critical cases and initiation of case reviews (Donat, Reference Donat2003).
Fisher (2003) attributed a 67% reduction in restraint and seclusion over two years in a large, urban, state-operated psychiatric hospital, to high-level administrative endorsement, participation by recipients of mental health services, culture change, training, data analysis, and individualised treatment. In a recent review, Gaskin et al. (2007, abstract) suggested that services typically use a combination of methods to reduce seclusion, and listed ‘…state-level support, state policy and regulation changes, leadership, examinations of the practice contexts, staff integration, treatment plan improvement, increased staff to patient ratios, monitoring seclusion episodes, psychiatric emergency response teams, staff education, pharmacological interventions, treating patients as active participants…changing the facility environment, adopting a facility focus, and improving staff safety and welfare.’ A similar list was presented by Smith et al. (2005).
A parallel strand of inquiry has been to identify those patientFootnote 1 characteristics that are associated with seclusion. The most frequently reported factors have been diagnoses characterised by mood elevation (Fitzgerald & Long, Reference Fitzgerald and Long1973; Mattson & Sacks, Reference Mattson and Sacks1978; Schwab & Lahmeyer, Reference Schwab and Lahmeyer1979; Oldham et al., Reference Oldham, Russakoff and Prusnofsky1983; Stolker et al., Reference Stolker, Hugenholtz, Heerdink, Nijman, Leufkens and Nolen2005), younger age (Plutchik et al., Reference Plutchik, Karasu, Conte and Siegel1973; Schwab & Lahmeyer, Reference Schwab and Lahmeyer1979; Oldham et al., Reference Oldham, Russakoff and Prusnofsky1983; Thompson, Reference Thompson1986; Goren et al., Reference Goren, Singh and Best1993; Swett, Reference Swett1994; Sourander et al., Reference Sourander, Ellila, Valimaki and Piha2002; Tunde-Ayinmode & Little, Reference Tunde-Ayinmode and Little2004; Stolker et al., Reference Stolker, Hugenholtz, Heerdink, Nijman, Leufkens and Nolen2005), and involuntary admission status (Way & Banks, Reference Way and Banks1990; Olsen, Reference Olsen1998; Tunde-Ayinmode & Little, Reference Tunde-Ayinmode and Little2004; Stolker et al., Reference Stolker, Hugenholtz, Heerdink, Nijman, Leufkens and Nolen2005).
Strong experimental designs to assess the determinants of seclusion are difficult to implement, for a variety of reasons. A recent review of randomised controlled trials (Muralidharan & Fenton, Reference Muralidharan and Fenton2006) that found little evidence for the efficacy of psychological interventions in this context has been criticised for ignoring other forms of evidence (Gaskin et al., Reference Gaskin, Elsom and Happell2007). One alternative approach is the before-and-after design in which the intervention to be tested is compared with an earlier ‘baseline’ level. Many such studies were reviewed by Gaskin et al. (2007). For example, D'Orio et al. (2004) compared two nine-month periods, in the second of which there was enhanced management of problem behaviours and improved monitoring, and found a 39% reduction in instances of seclusion and restraint. Similarly, Schreiner et al. (2004), comparing a three month baseline period with seven months of an intervention comprising close observation of staff responses to patient crises, staff and patient interviews, and a data monitoring system for seclusion and restraint, reported a 35% reduction in seclusion and 43% in restraint. Most such studies have reported substantial decreases in the use of seclusion and/or restraint, with some showing virtual eradication of these practices (Greene et al., Reference Greene, Ablon and Martin2006; Regan et al., Reference Regan, Curtin and Vorderer2006) and only one showing no effect (Bowers et al., Reference Bowers, Brennan, Flood, Lipang and Oladapo2006). Most of these studies made no adjustment for any possible change in the patient mix in the time periods being compared, so one cannot be sure whether the changes observed may have been due, even in part, to differences in the patient characteristics in the periods that were compared.
The study reported here is an evaluation of a ward-based intervention that had several objectives, including a reduction in the use of seclusion. Two contiguous six month periods were compared, and explicit adjustment was made for patient demographic and diagnostic characteristics. The expectation was that there would be a reduction in seclusion in the six months of the intervention compared with the six months before its introduction. In addition, the study afforded an opportunity to examine whether other patient and/or service factors were associated with seclusion.
METHOD
Setting
The Area Mental Health Service where the study was conducted has two inpatient wards in a single building: Ground Floor and First Floor. Each ward was unlocked (although the whole unit could be briefly locked when required) and comprised 22 beds and two seclusion rooms. Each ward also had an ‘extra care unit’ (equivalent to a psychiatric intensive care unit) which was locked and included three of ward’s beds.
The Management of Acute Arousal Programme (MAAP)
Prior to MAAP, the only formal requirement was for clinical staff to have attended mandatory aggression management training. Beyond this, how any incident was handled was at the discretion and judgment of the clinician or clinicians directly involved.
MAAP comprised four elements: assessment, psychosocial interventions, pharmacological interventions, and debriefing. Ward nursing staff initially assessed patients displaying agitated or aggressive behaviour using the Fremantle Arousal Scale (Castle & Alderton, Reference Castle, Alderton, Castle, Copolov and Wykes2003) which ranks the patient’s state as asleep or unconscious (0), through to highly aroused or violent (5). This is similar to the escalating stages of verbal, motor, property damage, and personal attack described by Kalogjera et al. (1989) who also applied stage-specific interventions to disturbed behaviour.
According to the level of arousal, a psychosocial intervention was applied, selecting from an ordered list: ventilation (opportunities for the patient to express fears, frustration anger, anxiety and triggers), redirection (exploring with the patient solutions that would assist them to gain control, including distraction techniques), time-out (the patient is asked to go voluntarily to an area in the unit for a specific period of time away from others), restraint (being held against active resistance by physical or mechanical means), or seclusion (as defined above). Each MAAP episode was initiated as required and continued until a low level of arousal was reestablished; reassessments and variation in management occurred every 15 to 30 minutes. ‘As required’ or ‘pro re nata’ (PRN) medications could be given at any stage, according to the algorithm outlined by Castle et al. (2005). Twenty-four to forty-eight hours after an episode of MAAP, patients were offered a debriefing (following the format described in Castle et al. (2005)) with a member of staff who had not been involved in the episode. All assessments and interventions were recorded on specially designed forms.
All clinical staff on the implementation ward were trained in the intervention in two sessions: one three weeks and the other one week prior to its start. The training included all elements of MAAP, and use of the documentation system. Training was also provided to new staff as required. A Practice Development Nurse was appointed for the six month implementation to provide training and ongoing support and monitoring. Ward staff were also given manuals and pocket-sized reference materials, and regular opportunities to meet with senior staff to review the operation of the programme. The implementation of MAAP was monitored both informally and formally. Senior clinicians on the ward would ask about the initiation of any MAAP episodes at an informal check-in with shift leaders and staff. This would be discussed with the appropriate staff member and the documentation reviewed.
Design
On one ward (First Floor, the experimental ward) there was a six-month baseline period (Time 1: 1/2/2006 to 31/7/2006) followed immediately by six months of MAAP (Time 2: 1/8/2006 to 31/1/2007). Examination of the initial data revealed that many patients admitted to one ward spent time on the other ward, sometimes for the purposes of seclusion when the seclusion facilities on the first ward were fully occupied. For this reason, all admissions in which the patient had been admitted to the Ground Floor ward, or had been transferred to or from it, were excluded. This comprised 27% of admissions in Time 1 and 25% of admissions in Time 2. The study was approved by the hospital’s Human Research Ethics Committee.
Data
For the experimental ward, details of all admissions any time of which fell between 1/2/2006 and 31/1/2007 were obtained. For each admission, the data comprised: admission and discharge dates and times, the dates and times of any absences (leave or absconding) from the ward, a variety of demographic variables (sex, date of birth, country of birth, preferred language, marital status, living alone or with others, indigenous status, income status, highest educational level attained, employment status, disability pension status, and accommodation type), all psychiatric diagnoses on admission, legal status on admission, and a routinely administered measure of severity of mental health problems, the Health of the Nation Outcome Scales (HoNOS; Wing et al., Reference Wing, Beevor, Curtis, Park, Hadden and Burns1998). For the same ward, details of all seclusions that occurred over the same period were also obtained: for each seclusion the data comprised the dates and times of the admission, and the dates and time of starts and ends of all seclusions within that admission.
Comparisons between Time 1 and Time 2, and between secluded and not secluded patients were effected by t test and chi square. Negative binomial regression was used to compare rates of seclusion. Time to first seclusion was examined using chi square, Cox proportional hazards regression, and graphical display.
RESULTS
Over the period of the study, 302 patients were admitted to the ward, 149 only in Time 1, 132 only in Time 2 and 21 had admissions in both periods. The 302 patients were admitted a total of 352 times, with 188 admissions in Time 1 and 164 in Time 2. There were 64 seclusions in Time 1 and 67 in Time 2. Fifty-four (18%) of the 302 patients experienced one or more seclusions in one or more of their admissions.
Patient descriptives
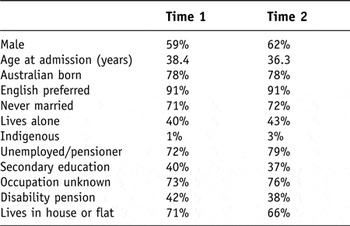
Table 1 summarises the patient demographics. None of the differences between Time 1 and Time 2 are statistically significant. Neither were any of the demographic characteristics listed in Table 1 significantly different between those patients who experienced seclusions and those who did not.
Consumer demographics

Of the 188 admissions in Time 1, 126 (67%) were involuntary at admission or shortly thereafter and 62 (33%) were voluntary. The corresponding figures for Time 2 were 87 (53%) involuntary and 77 (47%) voluntary. The association between legal status and time period is significant (χ2(1) = 7.15, p = 0.007) demonstrating that there was a significantly lower proportion of involuntary admissions in Time 2 compared to Time 1.
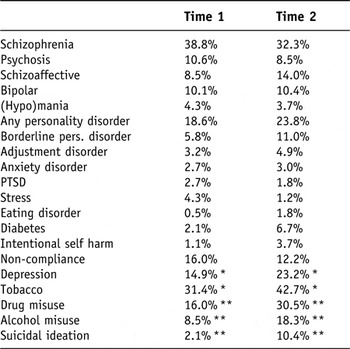
At each admission, as many diagnoses as applied were attached to the computerised admission record. Diagnoses were according the International Classification of Diseases (National Centre for Classification in Health, 2002). Different diagnoses could be entered in different admissions of the same patient. Psychiatric diagnoses were grouped into the most frequently occurring; these are presented in Table 2. The numbers sum to greater than the number of admissions because many admissions had several diagnoses attached to them. The univariate chi square tests show that there were proportionately more admissions with diagnoses of depression, tobacco misuse, suicidal ideation, drug misuse and alcohol misuse in Time 2 compared to Time 1.
Diagnoses

*p < 0.05 **p < 0.01
About half (166, or 47%) of all admissions had an associated intake assessment with no missing ratings on the HoNOS. The mean total scores at Time 1 and Time 2 were 10.2 and 11.4 respectively, a non-significant difference. For admissions with and without seclusion the means were 11.2 and 10.5 respectively, also non-significant, but there were significant differences on certain items. The mean ratings on item 1 (Overactive, aggressive, disruptive or agitated behaviour) and item 11 (Problems with living conditions) were higher in admissions with seclusions than in admissions without seclusions (1.81 versus 0.84, p = 0.0001, and 1.03 versus 0.57, p = 0.04 respectively), while scores were lower on item 2 (Non-accidental self-injury) and item 7 (Depressed mood), (0.61 versus 1.23, p = 0.02, and 0.52 versus 1.38, p = 0.0006 respectively). Thus the non-significant difference in the total scores obscures opposing differences on several items that cancel each other out.
Comparisons of seclusion rates
In both time periods, 84% of admissions had no seclusions, 10% had one episode of seclusion, about 2% had two seclusions, and less than 4% had three or more seclusions. A negative binomial regression analysis to account for the number of seclusions in an admission was performed with the following features: inclusion of significant patient characteristics and time period as independent variables, exposure to ‘risk’ of seclusion represented by duration of admission minus time off the ward (leave or absconding), and robust standard errors implemented by specifying that admissions were clustered on patient. The overall result was significant (p = 0.04) with younger age (p = 0.04), (hypo)manic diagnosis (p = 0.02), and involuntary status (p = 0.005) but not time period (p = 0.51) associated with more seclusions per admission.
Time to first seclusion
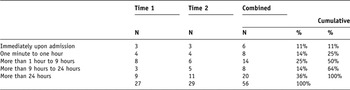
In view of the failure to find any material difference in numbers of seclusions per admission between Time 1 and Time 2, time to first seclusion within each admission was explored. To the extent that patients require seclusion immediately or very shortly after they are admitted, any seclusion-averting actions by ward staff may have little or no time to take effect. To test this idea, we computed, for each admission that contained one or more seclusions, the time, in hours and minutes, between the admission time and the first seclusion time. This is shown in Table 3.
Time to first seclusion, by time period

There were 56 admissions with one or more seclusions; 27 in Time 1 and 29 in Time 2. Across both time periods, in 6 admissions the seclusion started at the point of admission and in a further 8 within one hour of the admission. Thus, in one quarter of all admissions with seclusions, the seclusion began in the first hour of the admission. In exactly half of admissions with seclusions (28 of 56) the seclusion began in the first 9 hours of the admission. The association between time to first seclusion and time period is not significant (χ2(4) = 0.91, p = 0.92).
Comparison of seclusion durations
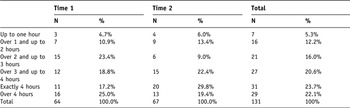
The mean duration of the 131 seclusions was 235 minutes (five minutes short of four hours). The shortest recorded seclusion was 10 minutes and the longest 3,245 minutes (two days and six hours). The distribution of durations is shown in Table 4.
Duration of seclusions, by time period

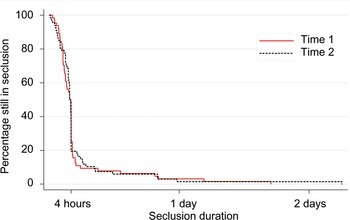
About one quarter of seclusions lasted exactly four hours, which is the legal limit before additional authorisation is required by State law (Victorian Government, 1986). The association between duration classified in this way and time period is not significant (χ2(5) = 7.4, p = 0.19). The mean duration of seclusions in Time 1 was 299 minutes (median 230) and in Time 2, 312 minutes (median 235); these differences are not significant.
Figure 1 shows the durations of seclusions, separately for each time period, and demonstrates both that most seclusions lasted less than four hours and the closeness of distributions in the two time periods. The results presented in Table 4 and Figure 1 are unadjusted for any patient differences between the time periods. A Cox proportional hazards regression was performed, with seclusion duration as the dependent variable, four binary independent variables of sex, personality disorder diagnosis, bipolar disorder diagnosis, and time period, and robust standard errors implemented by specifying that seclusions were clustered on patient. This produced an overall significant result (Wald χ2(4) = 26.3, p < 0.001); sex, personality disorder diagnosis and bipolar disorder diagnosis were all significant (p ≤ 0.01) but time period was not (p = 0.95). Longer durations of seclusion were associated with male sex, as well as personality disorder and bipolar disorder diagnosis.
Duration of seclusions, by time period

DISCUSSION
The primary hypothesis of this study, that there would be a reduction in seclusion during a programme designed to intervene early in patient agitation, was not supported. The rates and durations of seclusions under the programme were very similar to those in the prior six months. Sixteen percent of admissions contained seclusions; this is the same as the rate in the four British units that employed seclusion reported by Dye et al. (2009). The significant patient associations with being secluded were younger age, any element of mania in the diagnosis, and involuntary legal status. These findings clearly replicate those of earlier studies. In addition, we were able to show some consistent differences on HoNOS ratings at admission. Admissions that had seclusions had higher ratings on overactive, aggressive, disruptive or agitated behaviour and on accommodation problems, but lower ratings on deliberate self-harm and depressed mood. We have not here reported on any analyses of the medication data; these are clearly important and will be addressed in a later report.
In an attempt to understand the negative result, an exploration of time to first seclusion within an admission was undertaken. We found that duration was influenced to a large degree by an externally imposed legal limit, and that one quarter of seclusions began within one hour of admission, with one half of seclusions beginning within nine hours. The tendency for seclusions to occur early in an admission has been observed by others. El-Badri & Mellsop (2002) and Thompson (1986) both noted that most seclusions occurred in the first week, while Binder (1979) found that most occurred on the first day. The intervention that we trialed was essentially preventative in nature: it consisted of a number of measures that staff could take to de-escalate a situation that could eventuate in the initiation of an episode of seclusion. To the extent that patients arrived on the ward in a state that already necessitated seclusion, the capacity of the intervention to reduce seclusions was limited by a factor beyond its control.
Another factor beyond the control of the service was the characteristics of the patients it admitted. We were able to replicate the well-known associations with seclusion of younger age, mood elevation, and involuntary legal status. Given the generally strong effect of these factors, any evaluation of an intervention needs to control for them. It is quite possible, for example, for an intervention to appear better or worse simply on account of a few highly seclusion-prone patients being admitted in one or the other phase of the study. It is typical for the majority of seclusions to be accounted for by a minority of patients. For example, Atkins & Ricciuti (1993) found that 15% of patients accounted for 73% of all seclusions in a child and adolescent unit. In the present study the effect was even more extreme: two (less than 1%) patients accounted for 23 (18%) of all seclusions, and four (less than 2%) accounted for 41 (31%). Similarly, the fourteen patients with diagnoses indicating elevated mood totaled twelve seclusions. This disproportionality means that it is important to take account of patient characteristics when studying practices such as seclusion, and that appropriate analytic methods, such as deal with infrequent counts, should be employed.
While this study has not been able to demonstrate any beneficial effect of MAAP on seclusion rates, it appeared to have been well received by ward staff. Many staff expressed satisfaction with the structure of the MAAP intervention. Positive feedback was particularly notable from newly or recently graduated nurses, who appreciated the clarity of this process and who experienced an increase in their confidence to deal early and well with agitation.