



Introduction
In the polar regions, the growth of sea ice thickness in one winter season by purely thermal processes is 0.5–2 m (Leppäranta Reference Leppäranta1993, Worby et al. Reference Worby, Geiger, Paget, van Woert, Ackley and DeLiberty2008). Different growth mechanisms produce layers of different classes including congelation ice, frazil ice, platelet ice and superimposed ice (Gow et al. Reference Gow, Ackley, Weeks and Govoni1982, Eicken & Lange Reference Eicken and Lange1989, Morris & Jeffries Reference Morris and Jeffries1992, Heil et al. Reference Heil, Allison and Lytle1996, Smith et al. Reference Smith, Langhorne, Haskell, Trodahl, Frew and Vennell2001). Growth of sea ice is forced by heat losses to the atmosphere, while solar and oceanic heat gains drive melting of sea ice. Solar radiation also melts the ice in its interior and is able to penetrate the ice to the ocean below. Sea ice is a thin layer in that its capacity to store heat is low, and volume changes consequently follow external forcing with small lag. In some polar regions, sea ice may survive over the summer and become multi-year ice (Zubov Reference Zubov1945, Maykut & Untersteiner Reference Maykut and Untersteiner1971).
Landfast ice forms and remains stable along the coast, where it is attached to the shore or shelf edge, or between shoals and grounded icebergs. In the Antarctic seas, first year ice grows up to 2 m in thickness by thermal processes in the narrow landfast ice zone. Further offshore thermal growth is much less but dynamics can greatly thicken the ice (Williams et al. Reference Williams, Maksym, Wilkinson, Kunz, Murphy, Kimball and Singh2014). In Antarctica, landfast ice has about the same thickness as that on the Siberian continental shelf (Dmitrenko et al. Reference Dmitrenko, Kirillov and Tremblay2008) but undeformed ice offshore is quite thin compared with the normal first year ice in the Arctic Ocean. This observation can be explained by the strong oceanic heat flux in the weakly stratified polar zone of the Southern Ocean. Field observations of Antarctic landfast ice have been conducted by several researchers (e.g. Heil et al. Reference Heil, Allison and Lytle1996, Kawamura et al. Reference Kawamura, Ohshima, Takizawa and Ushio1997, Purdie et al. Reference Purdie, Langhorne, Leonard and Haskell2006, Lei et al. Reference Lei, Li, Cheng, Zhang and Heil2010).
In the annual cycle of landfast ice, the most sensitive factors are the oceanic heat flux, snow cover and albedo (Heil et al. Reference Heil, Allison and Lytle1996). The oceanic heat flux is the least documented of these, with few direct observations. Antarctic reference values are based on model tuning of sea ice thickness. Parkinson & Washington (Reference Parkinson and Washington1979) set oceanic heat flux as a constant 25 W m-2 in their large-scale model. Heil et al. (Reference Heil, Allison and Lytle1996) estimated the mean annual oceanic heat flux at the Australian station Mawson in East Antarctica to vary in the range 5–12 W m-2. Gordon & Huber (Reference Gordon and Huber1990) derived a mean oceanic heat flux of 16 W m-2 for the region 60–70°S near the Greenwich meridian in the Weddell Sea. In the Arctic, the oceanic heat flux is an order of magnitude less, with 2 W m-2 widely considered as a reasonable annual basin-averaged value (Maykut & Untersteiner Reference Maykut and Untersteiner1971).
In addition to the oceanic heat flux, ice growth and decay are sensitive to snow accumulation. Snow provides an insulating layer on top of the ice. The albedo depends on the thickness of snow cover and the presence of liquid water, ranging from 0.9 for ice with thick snow to 0.5 for bare dry ice and down to 0.2–0.3 for wet and ponded ice. Due to variations in snow thickness and its close connection to albedo, feedback mechanisms produce a patchy ice cover in the melting stage. In the coastal zone around the Antarctic continent, the air temperature in summer is close to 0°C and the air is dry; therefore, the melting process is not accelerated by the albedo feedback mechanism as strongly as it is in the Arctic.
Along long coastal sections in Antarctica, landfast ice has been reported to disappear in summer (December–February) (Alexander et al. 2012). It is unlikely that all landfast ice melts in place; instead, ice breakage and drift mechanically remove the ice and prevent the formation of multi-year landfast ice. The breakage may be forced by wind (Leppäranta Reference Leppäranta2011), icebergs (Massom et al. Reference Massom, Hill, Lytle, Worby, Paget and Allison2001), tides or ocean waves (Kohout et al. Reference Kohout, Williams, Dean and Meylan2014).
Sea ice modelling in the Antarctic has mainly consisted of two-dimensional models focused on mobile pack ice in large basins, with little attention on the mechanics of landfast ice. One-dimensional thermodynamic sea ice models are less common, despite being desirable because there are differences in the rates of growth and decay of sea ice between the two polar oceans. In Antarctic seas, there is more melting at the ice bottom and less at the surface compared with typical Arctic conditions. Crocker & Wadhams (Reference Crocker and Wadhams1989) performed modelling investigations in the McMurdo Sound with modifications to Arctic models to include snow-ice and platelet ice in the ice stratigraphy. Although the available large-scale models deliver reasonable general features of the spatial distribution of sea ice thickness, they do not accurately represent the thickness cycle of the landfast ice zone, mainly due to their coarse resolution.
In this study, the annual cycle of the thickness of landfast sea ice in Prydz Bay, East Antarctica, was examined using a time-dependent thermodynamic sea ice model (Launiainen & Cheng Reference Launiainen and Cheng1998), with a focus on processes in the summer. The research is a continuation of the study by Lei et al. (Reference Lei, Li, Cheng, Zhang and Heil2010), where ice thickness was monitored by the Chinese National Antarctic Research Expedition (CHINARE) from March to December 2006. The model was forced by the observations at the Zhongshan weather station in the Larsemann Hill Oasis close to Prydz Bay. The objectives of the study were to calibrate the thermodynamic sea ice model for the site and to examine the sensitivity of ice evolution in the summer season, the critical part of the annual cycle, to external forcing and parameterizations. Calibrations were performed using model simulations with known initial and final conditions for summer. The following hypotheses were tested: i) landfast ice in Prydz Bay cannot melt completely in summer but disappears due to breakage and drifting, ii) ice melting is forced by solar radiation and oceanic heat flux, and iii) the ice thickness cycle can be simulated with a congelation ice model using local weather station data and tuned oceanic heat flux for the forcing. Comparisons between the thermodynamics of Antarctic and Arctic sea ice are also reported.
Methods
Field data of landfast sea ice in Prydz Bay
Prydz Bay is located on the coast of the Antarctic continent in the Indian Ocean sector between 66°E and 79°E (Fig. 1). There are three year-round stations (Davis, Zhongshan and Mawson) from where regional landfast ice observations have been carried out. Zhongshan Station is located at 69.37°S, 76.37°E (Fig. 1). The proportion of thermodynamically formed landfast ice may be higher in Prydz Bay than in other regions in East Antarctica because it does not rely on pack ice advection for formation to occur (Fraser et al. Reference Fraser, Massom, Michael, Galton-Fenzi and Lieser2012). Landfast ice grows there to ~1.7 m thickness during a single growth season from March to November (He et al. Reference He, Chen and Wu1998, Lei et al. Reference Lei, Li, Cheng, Zhang and Heil2010). The structure is predominantly composed of congelation ice. He et al. (Reference He, Chen and Wu1998) found that frazil ice formed the top portion of the ice cores, usually <3% but in one sample out of five there was 30% frazil ice. However, the samples did not contain any snow-ice or platelet ice. Snow cover is thin, usually a few centimetres, and new snow is quickly drifted away by winds. Therefore, it is natural to expect that snow-ice is rare in Prydz Bay, except at a few specific spots that favour snow accumulation. Tang et al. (Reference Tang, Qin, Ren, Kang and Li2007) found a significant portion of snow-ice in the semi-enclosed Nella Fjord close to Zhongshan Station.
Map of Prydz Bay showing the locations of the weather station (W.S.), the sea ice mass station (I.M.S.) and Zhongshan Station.

Landfast ice in Prydz Bay usually breaks off in summer, often due to coincident high wind speeds, monthly peak tides and/or the effect of penetrating ocean swell (He et al. Reference He, Chen and Wu1998, Lei et al. Reference Lei, Li, Cheng, Zhang and Heil2010). Occasionally a small portion of landfast ice may survive through summer within a narrow bay or fjord that provides protection from ocean swell and wind fetch. Tang et al. (Reference Tang, Qin, Ren, Kang and Li2007) found multi-year ice in Nella Fjord in the summer of 2002/2003, but in the summer of 2006/2007 all ice drifted out from this fjord influenced by strong winds.
Measurements of landfast ice properties in Prydz Bay were included in a continental-scale field campaign carried out near Zhongshan Station from December 2005 to December 2006 as part of the CHINARE programme. There are several islands off Zhongshan Station, and the nearby bathymetry is highly undulating. The thickness of snow and ice were monitored at a few locations in the landfast ice zone.
The shore-based snow- and ice-monitoring programme commenced in March, when it was safe to work on the ice. Measurements were conducted from the beach nearest to each survey section. The data included digital photography and written notes on the changes of surface conditions. Beginning on 21 March 2006, sea ice thickness was measured through drill holes every 5 days along a line at each measurement site. The accuracy of the ice thickness measurement was ±5 mm (Lei et al. Reference Lei, Li, Cheng, Zhang and Heil2010).
In late March 2006, a hot-wire thickness gauge was deployed in a north–south line through measurement at the ice mass station (I.M.S.) with a horizontal interval of 15 m (Fig.1, Lei et al. Reference Lei, Li, Cheng, Zhang and Heil2010). The line was also used for snow stakes (Fig. 2e). The measurements were conducted at the gauges every 1–3 days from 21 March to 18 December 2006. From mid-October 2006 onwards, some gauges were loose due to absorption of solar radiation by the wires and consequent warming.
The time series of a. cloudiness, b. relative humidity, c. air temperature, d. wind speed at Zhongshan Station, and e. observed and interpolated snow thickness at the sea ice mass station from March 2006 to March 2007.

The meteorological measurements at the Zhongshan weather station (Fig. 2) were used for the model forcing. Air temperature, wind speed and relative humidity were averaged to 1 hour intervals, and cloudiness was available at 3 hour intervals. Snow thickness was obtained from the snow stakes at the I.M.S. every 1–3 days. We do not have reliable in situ precipitation data. However, snowdrift seemed to dominate the local snow mass balance and keep the snow cover thin throughout the winter. In summer (December–February), the ice was snow-free.
Thermodynamic model for congelation ice
Congelation ice crystals grow from the ice bottom, and the released latent heat is conducted through the ice to the atmosphere. Heat transfer is in the vertical direction, since the lateral length scales are much larger than the length scale of thermal diffusion in one year’s time. The basic equation is the vertical heat conduction law (e.g. Maykut & Untersteiner Reference Maykut and Untersteiner1971):
 $$\rho c{{\partial T} \over {\partial t}}={\partial \over {\partial z}}\left( {k{{\partial T} \over {\partial z}}{\minus}Q_{{sp}} } \right),$$
where ρ is density, c is specific heat of ice, T is temperature, t is time, z is vertical co-ordinate positive downward (z=0 at the ocean surface), k is thermal conductivity, and Q sp is the solar radiation in the ice. For sea ice, the heat capacity (ρc) and the thermal conductivity depend on temperature and salinity, while for snow they depend on density. The bottom boundary condition provides the growth of congelation ice:
 $$z=h_{d} :T=T_{f} ,\,\rho L{{dh} \over {dt}}{\plus}Q_{w} =k{{\partial T} \over {\partial z}},$$
where T f is the freezing point temperature, h is ice thickness, h d is draft, L is latent heat of freezing, and Q w is the oceanic heat flux. The surface boundary condition is:
 $$z=h_{f} :\rho L{{dh} \over {dt}}{\plus}Q_{0} =k{{\partial T} \over {\partial z}};{{dh\tf="TNR"\char"A9} \over {dt}}={{\rho _{w} } \over \rho }(P{\minus}E),$$
where h f is freeboard, Q 0 is the surface heat balance, ρ w is water density, h' is atmospheric surface mass flux, and P and E are precipitation and sublimation, respectively (also accounting for snow drift). Sublimation has been ignored in earlier model investigations. The surface heat balance is written as:
 $$Q_{0} =(1{\minus}\alpha )(1{\minus}\gamma )Q_{s} {\plus}{\varepsilon}\sigma ({\varepsilon}_{a} T_{a}^{4} {\minus}T_{a}^{4} ){\plus}Q_{e} {\plus}Q_{c} {\plus}Q_{P} ,$$
where α is albedo, γ is the fraction of solar radiation penetrating the surface, Q s is incident solar radiation, ε is the thermal emissivity of the surface, ε a is the effective emissivity of atmosphere, σ is Stefan-Boltzmann constant, T a and T 0 are air and surface temperature, respectively, Q e and Q c are the latent and sensible heat fluxes, and Q P is the heat flux from precipitation. The latter term is only significant when there are phase changes involved and can be neglected in the case of Prydz Bay.
Frazil ice, snow-ice and platelet ice are not considered here, based on the ice observations at the field site. High frazil/platelet production takes place under the adjacent Amery Ice Shelf, but that ice does not drift from there to Zhongshan Station (Herraiz-Borreguero et al. Reference Herraiz-Borreguero, Allison, Craven, Nicholls and Rosenberg2013). Frazil ice formation may occur in a short time period in the beginning of the ice season and would play a minor role in the whole annual cycle of ice thickness and temperature. Snow-ice does not form since the snow cover is thin and dry. Platelet ice growth is an important mechanism in parts of the landfast ice (Smith et al. Reference Smith, Langhorne, Haskell, Trodahl, Frew and Vennell2001) but appears to be insignificant in the study area.
Two approaches were used to model sea ice thermodynamics. The first approach used analytic or semi-analytic models of ice growth that ignore thermal inertia and penetration of solar radiation into the ice (Zubov Reference Zubov1945, Leppäranta Reference Leppäranta1993). In that case, the temperature profile is linear, and Eqs (1)–(3) are reduced to an ordinary differential equation. These models can be called quasi-steady models, since the temperature profile immediately shifts into a new steady-state form when the boundary conditions change. During the process of ice melting there is no conduction but the external fluxes melt the ice at the boundaries, and solar radiation absorption and brine dynamics melt the interior. Therefore, melting can be predicted as soon as the total heat flux into the ice is specified.
In the second approach, a high-resolution, time-dependent model was run, which was based on a direct numerical solution of Eqs (1)–(3) with a 5–10 cm grid size (see Maykut & Untersteiner Reference Maykut and Untersteiner1971, Cheng Reference Cheng2002, Shirasawa et al. Reference Shirasawa, Leppäranta, Saloranta, Kawamura, Polomoshnov and Surkov2005). These models can resolve the response of ice to daily cycles in external forcing. The thermal diffusion coefficient of sea ice is ~0.1 m2 d-1 and, therefore, the length scale for daily cycles is ~0.3 m. Penetration of solar radiation into the snow and ice can also be properly included in high-resolution, time-dependent models.
Crocker & Wadhams (Reference Crocker and Wadhams1989) used a coarse-resolution numerical model (Semtner Reference Semtner1976) to examine the growth of landfast ice in the McMurdo Sound. Significant discrepancies between observations and the model results were found, primarily due to the formation of platelet ice and snow-ice. Fairly simple model modifications to include these ice types greatly improved the ice thickness simulations. Superimposed ice formation was assumed to occur immediately after a flooding event. The presence of the sub-ice platelet layer was assumed to increase columnar ice growth at a rate proportional to the volume fraction of ice in the platelet layer. This simple technique allowed the estimation of the platelet-enhanced growth without detailed knowledge of the oceanographic conditions. The resulting model predictions were in close agreement with measurements of landfast ice growth and decay in McMurdo Sound.
In the present work the time-dependent model HIGHTSI (Launiainen & Cheng Reference Launiainen and Cheng1998, Cheng et al. Reference Cheng, Zhang, Vihma, Johansson, Bian, Li and Wu2008) is employed for the congelation ice at Zhonghan Station. The model solves the heat conduction equation in the snow and ice layers to derive the evolution of temperature and thickness of ice and snow. At the upper boundary, the solar and terrestrial radiative fluxes and the turbulent heat fluxes are parameterized, with the turbulent fluxes taking into account the stability of atmospheric stratification (see Launiainen & Cheng Reference Launiainen and Cheng1998). The surface temperature is solved from the surface energy balance that couples the snow and ice with the atmosphere.
Snow thickness is taken from observations, and oceanic heat flux is prescribed as a function of time Q w =Q w (t). They are external factors, not coupled to the ice model. Albedo depends on the surface conditions (snow/ice and wet/dry) increasing in the melting season as the surface becomes wet. The surface in Prydz Bay was bare ice in summer and, therefore, albedo variations were small.
The linear attenuation law is employed for the radiation transfer inside the ice:
 $${{dQ_{{sp}} } \over {dt}}={\minus}\kappa Q_{{sp}} ,$$
where κ is the attenuation coefficient. Ice and snow have different attenuation coefficients. Furthermore, the uppermost 5 cm layer has a larger attenuation coefficient due to the rapid attenuation of ultraviolet and near-infrared wavelengths close to the surface. The fraction i 0, absorption in the top layer, depends on the cloudiness N and the ice type; for clear congelation ice, i 0=0.43·(1–N)+0.63·N (Grenfell & Maykut Reference Grenfell and Maykut1977, Perovich Reference Perovich1996). More sophisticated methods for estimating the solar radiation transfer in snow and ice are available, e.g. an advanced radiative transfer scheme (e.g. Liston et al. Reference Liston, Winter, Bruland, Elvehoy and Sand1999). However, a comparison has shown that the results based on the linear attenuation law are close to the results of the Liston et al. (Reference Liston, Winter, Bruland, Elvehoy and Sand1999) scheme, especially for the snow layer (Cheng Reference Cheng2002).
The vertical grid contains 40 grid cells in ice, at the maximum ice thickness of 2 m, and the physical grid step is 5 cm. Fewer grid cells were needed because snow cover was thin at the I.M.S. The grid size is small enough to resolve the daily cycles in ice temperature and thickness. The model parameters are shown in Table I.
The model parameters based on CHINARE measurements and the literature; h s and h i are snow and ice thickness, N is cloudiness, and T i is ice temperature.

Summer decay: sensitivity investigations
The most uncertain part, in with regards both data and models, is the summer period (December to February). The ice decays by melting and drifting. Melting is sensitive to albedo and oceanic heat flux, and the sensitivity of these factors was investigated by model simulations. The breakage of landfast ice depends on winds, tides and the strength of the ice.
First, the albedo shows variations due to ice deterioration and the presence of liquid water, ranging from 0.3 to 0.7. Second, model-derived oceanic heat flux increases in summer due to solar heating of the water under the ice and possibly due to advection of warm water from further north. Interestingly, oceanic heat flux decreases through the growth season and the heat storage needs to be renewed in summer to close the annual cycle.
Results
Annual ice cycle
In January 2006, landfast ice, which had grown in the previous winter, had become thinner and weaker. This ice was broken away from the shore by winds and tides, and subsequently drifted out of the region. The new ice season started in mid-February, first with night-time freezing and daytime melting (Lei et al. Reference Lei, Li, Cheng, Zhang and Heil2010). In the beginning of March a stable ice cover formed and continued thickening. The maximum ice thickness (174 cm) was observed on 20 November. After that date, ice melted at an average rate of ~0.5 cm per day until 18 December. The melt season continued until 28 February 2007, when the ice was broken off during a severe storm.
The scaling of the ice thickness cycle can be obtained by analytic quasi-steady models (Zubov Reference Zubov1945, Leppäranta Reference Leppäranta1993). The basic model is:
 $$\rho L{{dh} \over {dt}}{\plus}Q_{w} =k \cdot {{T_{f} {\minus}T_{0} } \over h}=Q_{0} (T_{0} ,T_{a} ).$$
This formula gives a good approximation for the growth of ice when the snow cover is thin or absent, as is the case at the study site. It is based on the heat transfer through ice to the atmospheric surface layer and the oceanic heat flux to the ice bottom. In the melting phase T o≈T f and the melt rate is given by the fluxes at the top and bottom surfaces.
In Zubov’s (Reference Zubov1945) growth law, the oceanic heat flux is ignored and the solutions for the annual growth and melting of sea ice become:
 $$h_{1} =\sqrt {aS{\plus}d^{2} } {\minus}d,\,a={{2k} \over {\rho L}},$$
 $$\Delta h={{\left\langle {Q_{0} {\plus}Q_{{sp}} } \right\rangle {\plus}\tilde{Q}_{w} } \over {\rho L}}\tau _{m} ,$$
where h 1 is the first year ice thickness, S is the sum of degree days below the freezing point, d is ~10 cm and describes the atmospheric surface layer buffering of heat transfer from the ice pack, Δh is summer melt, τ m is the length of summer, and the notation <·> stands for time averaging. Equation (6a) is the Zubov (Reference Zubov1945) solution (see also Leppäranta Reference Leppäranta1993), while Eq. (6b) comes from the heat balance integral over the melting period. The length of summer can be taken as the period when the sum of the surface heat flux and solar radiative flux penetrating into the ice, Q 0+Q sp, stays positive.
Figure 3 shows the annual air temperature cycle in Prydz Bay. The mean air temperature was -12°C over the ice growth season (March–November) with a minimum of ~-30°C in July–August, and the freezing degree days summed to S=3390°C·day. Applying Zubov’s (Reference Zubov1945) model to the Zhongshan weather station data, the first year sea ice in Prydz Bay would grow to 1.83 m. This value is 9 cm larger than observed, which is consistent with ignoring snow and oceanic heat flux (Leppäranta Reference Leppäranta1993). The melting period can be approximated by the time the daily averaged air temperature was >0°C from the beginning of December 2006 to mid-February 2007 (Fig. 3). The heat budget suggests that the summer melting was Δh<1 m. Thus, the summer balance would allow for the existence of multi-year ice (h 1>Δh) if ice were not mechanically removed in summer.
The time series of the daily mean air temperature at Zhongshan Station. The horizontal line is the average air temperature between 1 March 2006 and 30 November 2006 for when ice observations are available, coinciding with the period of ice growth.

To estimate the melt rate of ice, the positive degree day method has been widely used in sub-polar regions, with a rate of ~0.3 cm °C-1 day-1. In Prydz Bay, however, positive air temperatures summed to <50°C·day, suggesting that the amount of ice melt would be <20 cm. This is much less than observed; therefore, the degree day method is not applicable here. The ice and environmental conditions keep the air temperature close to 0°C in summer, and the correlation between air temperature and surface heat balance is low. Alternative sources of melt, such as elevated oceanic heat flux, must be responsible for most of the melt.
The multi-year ice state is unstable in that, occasionally, all ice disappears in summer. Combining Eqs (6a) & (6b), the mean and amplitude of the equilibrium multi-year thickness cycle, H and ΔH, respectively, can be solved:
 $$H={{h_{1}^{2} } \over {2\Delta h}},\,\Delta H=\Delta h,$$
where ΔH is the annual range of multi-year ice thickness. When h 1=1.8 m and Δh=1.0 m, the equilibrium cycle oscillates within 1.12–2.12 m.
In the presence of oceanic heat flux, analytic modelling becomes more difficult, since oceanic heat flux is connected to heat conduction through ice for the thickness solution. If the oceanic heat flux and air temperature are constants, an analytic solution for the steady-state sea ice thickness (H s ) can be reached, where heat conduction through the ice equals the oceanic heat flux:
 $$H_{s} =k{{T_{f} {\minus}T_{a} } \over {Q_{w} }}{\minus}d.$$
Thus, if T f –T a is ~10°C and Q w is ~25 W m-2, H s is ~75 cm, which corresponds to typical first year ice thickness in the Antarctic drift ice fields. The time evolution of ice thickness is obtained by the non-linear equation:
 $${h \over {H_{s} }}{\plus}\log \left( {1{\minus}{h \over {H_{s} }}} \right)=k{{T_{f} {\minus}T_{a} } \over {H_{s}^{2} }} \cdot t.$$
In the beginning (h<<H s ), the ice growth is proportional to the square root of time. The time-scale of the system of Eq. (9) is τ=H s ρL/Q w , h/H s =0.84 at t=τ. If Q w is ~25 W m-2 and H s is ~75 cm, τ is ~75 days, and thus the steady-state ice thickness can be reached during the ice growth season in the Antarctic drift ice field. If Q w is ~10 W m-2 (in the growth season; Heil et al. Reference Heil, Allison and Lytle1996) and H s is ~1.8 m, τ is ~635 days; thus, steady-state thickness is not reached in Prydz Bay. The steady-state ice thickness is nearly inversely proportional to the oceanic heat flux but, when the oceanic heat flux is small, the length of the growth season is the limiting factor. In summer, the average oceanic heat flux is ~15 W m-2, which provides an explanation for approximately 50% of the summer melt.
HIGHTSI model experiments
The external forcing for the HIGHTSI model is based on air temperature, wind speed, relative humidity, cloudiness, precipitation and incoming solar radiation. Snow cover is normally modelled from precipitation and metamorphic processes, but here the snow thickness was prescribed due to its marginal role (see Fig. 2e). The initial ice thickness was taken as 2 cm based on in situ observations. Ice and snow thickness data in Prydz Bay are available for the period from April to November 2006, which was used for the calibration. An estimate of the oceanic heat flux was obtained as a by-product of the simulations. In the summer, the oceanic heat flux was clearly important to ice melt but with large uncertainty in its magnitude; therefore, sensitivity studies were made to investigate its magnitude and variation.
To obtain the annual ice thickness cycle, the basic simulation started with the freezing date of 1 March and was run until the end of March of the following year. In the ice growth season, until the end of November, the simulations reproduced the ice thickness evolution very well, with the relevant thermal properties of ice being stable and snow thickness remaining small. Therefore, the modelled initial ice thickness in the beginning of the melting season was appropriate.
The oceanic heat flux was first estimated for the ice growth season by keeping all other parameters fixed. A method similar to the ‘ensemble simulation procedure’ was applied to determine the best possible time series of oceanic heat flux. The oceanic heat flux was assumed to be within a range of 0 up to 30 W m-2. HIGHTSI model runs were made at 0.1 W m-2 steps within this range. Those model runs where the differences between modelled and observed ice thickness were <0.5 cm were retained and the corresponding oceanic heat fluxes were averaged to create a time series (Fig. 4). The criterion is based on the accuracy of the ice thickness measurements (±0.5 cm). The resulting modelled oceanic heat flux decreased from 25 W m-2 in March to 5 W m-2 in November. For consistency, in December–February the oceanic heat flux must go back to 25 W m-2.
Time series of estimated oceanic heat flux and the measured landfast sea ice thickness in Prydz Bay. In January–February 2007, the ice thickness and oceanic heat flux must return to the initial levels of the simulation.

The modelling results suggest that the heat storage of the Prydz Bay water mass is renewed in summer, and almost all this heat is used to melt ice or is transferred through the ice to atmosphere at a rate decreasing with time. This heat renewal can be accounted for by local solar radiation in summer; however, we cannot estimate how much oceanic heat may have been brought in by lateral advection from further north. The solar heat is stored in the mixed layer, so that it can be used slowly during the ice season rather than simply to delay the freezing date.
The annual cycles of ice temperature and thickness reflect the long, cold growth season of March to November and the short summer (December–February). The ice thickness grows steadily, and the temperature in the ice interior falls below -20°C in winter (Fig. 5). During the growth season, seven cold spells were observed. In summer, the ice is isothermal.
Ice temperature and thickness from March 2006 to March 2007 produced by the HIGHTSI model simulation. Albedo is 0.6, snow thickness is ignored, and summer oceanic heat flux is 15 W m-2.

In thermodynamic sea ice models, the decay of ice cover is taken from the heat balance and the mass balance is ignored. When ice melts, the meltwater is pushed away rather than kept on the surface to form ponds. Part of the meltwater flows through porous ice and cracks to the mixed layer. Evaporation also removes meltwater, but this sink is small relative to drainage through the ice. However, sublimation can become significant in an arid, cold climate such as in the Prydz Bay landfast ice zone.
It is possible that sublimation has a significant role in the mass budget of the ice. For a latent heat flux of -30 W m-2, mass loss by sublimation would be 1 mm day–1. Figure 6 shows the simulated latent heat flux. In the growth season, because of the cold conditions, the mean latent heat flux is ~-10 W m-2, but in summer the value is ~-30 W m-2. Since the growth season is 8 months long and summer is 3 months, the resulting sublimation would be 90 mm in both periods. However, sublimation becomes weaker when the surface becomes ponded in summer. For comparison, Fig. 7 shows the daily change of ice thickness in the standard simulation.
The daily mean latent heat flux produced by HIGHTSI. Albedo is 0.6, snow thickness is ignored, and summer oceanic heat flux is 15 W m-2.

The daily ice thickness change calculated by HIGHTSI. Albedo is 0.6, snow thickness is ignored, and summer oceanic heat flux is 15 W m-2.

The parameters used in the model are shown in Table II.
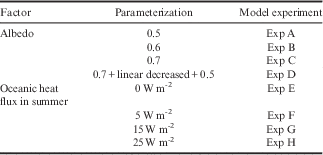
Model experiments carried out for the summer period (December 2006 to February 2007).
The summer simulations showed how the ice would decay thermally through summer and how the next ice season should begin. In February, the model ice thickness was non-zero (0.5–1.0 m), but around that time the ice broke off and drifted away with the wind or tide. Sensitivity studies showed how the freezing date and oceanic heat flux influence the modelled ice thickness to the end of the summer (28 February). The time of ice break-up is determined by when the ice thickness and strength are low enough for the ice to be broken by forcing from winds, waves and tides. The strength of the ‘warm summer sea ice’ (T>-5°C) is highly variable and unpredictable. Prydz Bay is quite openly connected to the Southern Ocean, and thus exposed to forces that lead to ice break-up in summer.
Figure 8 shows the time series of the modelled ice thickness cycle for the different parameterizations of albedo (α). The oceanic heat flux was optimized by the model simulations until 1 December, and then to the end of the summer it was assumed to increase linearly from 5 to 20 W m-2. The ice thickness is affected by albedo only when the shortwave radiation reaches a significant level in October. Large differences are seen in summer for different albedo values. With α=0.5 ice melts completely by 1 February, while with α=0.7 the ice decays to 90 cm on 28 February. These two extremes reflect too much and too little melting, respectively. With α=0.6, the thickness of ice is 50–70 cm in February, consistent with observations, with the new growth season starting at the beginning of March as observed. The modelled range of ice thickness is small (20 cm) in February, so that any major mechanical forcing event may break the landfast ice and export it away from the coast. The thickness of ice at ice break-up is <1 m and probably >0.5 m.
The sensitivity of ice thickness cycle to albedo (α). Exp A: α=0.5, Exp B: α=0.6, Exp C: α=0.7, and Exp D: α=0.7 from March to November, α is linearly decreased from 0.7 to 0.5 in December and α is 0.5 from January to March. Break-up denotes the period when mechanical breakage of landfast ice normally takes place. The oceanic heat flux was specified to increase linearly from 5 to 20 W m-2 in summer; otherwise it is kept fixed as optimized from model–data comparison.

A simple modelling option is to keep the oceanic heat flux constant through summer. However, if the solar radiation is the dominant source of the oceanic heat, then the oceanic heat flux should increase exponentially from 5 W m-2 at the end of the growth period to ~25 W m-2 at the time of the ice break-up. A heat flux of 30 W m-2 melts ice by 1 cm day-1. To examine a variable oceanic heat flux, model simulations were made with several fixed oceanic heat flux levels in summer. Note that melting of ice is nearly additive, i.e. independent of the melting in the previous day or week, so that total melting is provided by the average total heat flux during the period of interest.
Figure 9 shows the sensitivity results for the summer oceanic heat flux. Here the albedo was kept constant at 0.6. Modelled ice thicknesses in February are within 50–120 cm. With a fixed 15 W m-2 oceanic heat flux, the ice thickness minimum is 75 cm, while for 25 W m-2 the minimum ice thickness is 50 cm. It is clear from the simulations that the oceanic heat flux must increase during summer so that in February the level is again at 25 W m-2, both to obtain a realistic ice thickness at breakage and to begin the next ice season early in March.
The sensitivity of oceanic heat flux Q w kept constant in summer simulations. Exp E: Q w=0 W m-2, Exp F: Q w=5 W m-2, Exp G: Q w=15 W m-2 and Exp H: Q w=25 W m-2. Albedo is 0.6.

Discussion
The potential multi-year ice cycle was simulated by HIGHTSI for Prydz Bay (Fig. 10). This theoretical time history would result if the landfast ice did not break in summer. The simulation was realized performing a continuous 7 year simulation without including any mechanical ice losses. The albedo was 0.6, and the oceanic heat flux was as optimized by the model simulations, until 1 December, and from there to the end of summer it was linearly increased to 20 W m-2. The ice approached its equilibrium cycle by the second year of the simulation. The resulting simulation approached 1.8 m at maximum and 0.8 m at minimum. Therefore, this cycle was 32 cm lower than obtained by the analytical model (Eq. 7). The reason is that the analytic model did not account for the oceanic heat flux in the ice growth season.
The theoretical multi-year cycle of ice thickness in Prydz Bay based on model simulation. The forcing repeats the year March 2006 to February 2007.

Sensitivity studies were made for the summer season to close the ice thickness cycle because there were no ice thickness data in summer. The summer albedo of 0.6 and linearly increasing oceanic heat flux from 5–20 W m-2 produced a realistic summer ice thickness in the range of 0.5–1.0 m in February when the ice breaks up and drifts away, thus preventing formation of multi-year ice. In summer, sea ice becomes porous and has a low and variable strength, not well known by measurements; however, when porosity approaches 40–50% the ice loses its strength. Therefore, summer ice of 0.5–1.0 m thick breaks more easily than autumn ice, and it is not possible to predict the breakage thickness with good accuracy for a given forcing.
For the ice growth season, the modelled oceanic heat flux and oceanic heat flux derived from in situ measurements were compared by the heat flux residual method (Lei et al. Reference Lei, Li, Cheng, Zhang and Heil2010) (Fig. 11). The mean oceanic heat fluxes were 10.5 W m-2 and 5.3 W m-2 for HIGHTSI and the heat residual method, respectively. The heat residual method also produced a periodic 1–2 month oscillation, for which there is no clear explanation from the local ice–ocean physics perspective. The monotonically decreasing oceanic heat flux resulting from the HIGHTSI simulations is more consistent with local ice/ocean physics.
Time series of estimated oceanic heat flux by HIGHTSI and the heat residual method. The grey dashed line is the polynomial fit to the results of the heat residual method.

Heil et al. (Reference Heil, Allison and Lytle1996) suggested that the oceanic heat flux increases rapidly in the beginning of the melting season since the convection becomes limited under melting ice. This means that solar heat is trapped in the surface layer and much of that heat can be used to melt the ice from below, as also suggested by our simulations. Assuming that the daily mean of incoming radiation is 200–300 W m-2, the albedo of bare ice is 0.5, and the light attenuation coefficient of ice is 1 m-1, the solar heat flux to the water below the ice would be 20 W m-2 below ice that is 1.7 m thick and 45 W m-2 below 1 m ice. After the ice break-up, due to the low albedo of open water, the heating rate could be 200 W m-2. The heat accumulated in the open water period delays the freezing of Prydz Bay and is thereafter used to decrease the growth rate by an average rate of ~10 W m-2 during the next 9 months. This temporal scheme is consistent with the outcome of our model.
For bare ice, sublimation may also become a significant ice decay factor. It was estimated at ~25 cm in winter in a Tibetan lake (Huang et al. Reference Huang, Li, Han, Niu, Lin and Leppäranta2012), while Leppäranta et al. (Reference Leppäranta, Järvinen and Lindgren2013) recorded sublimation levels of 1–2 mm of snow water equivalent per day in Dronning Maud Land, 125 km from the shelf edge. In Prydz Bay, the ice surface varies between bare state and thin snow cover, and all summer the surface is bare. Uto et al. (Reference Uto, Shimoda and Ushio2006) also noted that the 20 km coastal zone of landfast ice in Lutzow-Holm Bay, East Antarctica, has less snow due to the wind-driven snowdrift.
Conclusions
A one-dimensional, time-dependent thermodynamic snow and ice model (HIGHTSI) was employed to examine the annual cycle of landfast sea ice in Prydz Bay, East Antarctica. The model forcing and calibration was based on data from the CHINARE 2006 expedition, including Zhongshan weather station records and in situ snow and ice thickness measurements. Prydz Bay is a first year sea ice basin, except that in some semi-enclosed small spots ice may occasionally survive over summer. The landfast ice grows to 1.7 m in winter and melts by ~1 m in summer, when it is broken by winds and tides and drifts out of the bay. A new ice season starts in the beginning of March.
In the annual cycle of ice temperature and thickness in Prydz Bay, oceanic heat flux and the radiation balance were the dominant forcing terms. Snow accumulation was a minor factor. New snow accumulation was soon taken away by snowdrift and sublimation. The freezing degree days were 3390°C·day in the ice growth season, and the annual maximum ice thickness was fairly well given by the Zubov’s (Reference Zubov1945) analytic model. Scaling analysis by analytical models was also elaborated for the multi-year ice equilibrium cycle and for the annual maximum ice thickness as a function of the mean oceanic heat flux, which are most valuable results for the interpretation of the outcome of the HIGHTSI model.
In summer, the ice is bare and the albedo was estimated as 0.6 by model simulations. Oceanic heat flux was estimated using the HIGHTSI model and ice thickness measurements. In the growth season (March–November) the mean level was 10 W m-2, decreasing steadily from the maximum of 25 W m-2 down to 5 W m-2. In summer the oceanic heat flux increased back to 20–30 W m-2. The cycle of oceanic heat flux is consistent with primary control by penetration of solar radiation through ice and mixing in the oceanic Prydz Bay water mass in summer, and in the ice growth season the summer heat storage is used to retard the growth rate of the ice. It is not clear whether advection from the ocean further out is needed but that is likely to be less important than the influence of local solar radiation.
In both the growth season and summer, sublimation takes up the total of 10 cm of ice away from the surface, based on the modelled latent heat flux, since the surface is bare and dry. In cold and arid climate zones such as the landfast ice zone in Antarctica, sublimation should be included in models of ice mass balance.
Our results are important for sea ice research and high-resolution sea ice climate modelling in Antarctic seas. Landfast sea ice is an important zone along the Antarctic continent and as a sub-grid-scale phenomenon it is not yet properly included in climate models. The zone may extend further out if sea ice is buttressed by grounded icebergs, forming a key process in sea ice–iceberg interaction. Breakage/stability of landfast ice also influences coastal ocean processes. Recently, an intensified observation programme has been commenced around the whole Antarctic landfast ice zone. The continuation of the present research needs more in situ measurement, in particular, direct eddy flux measurement of the oceanic heat flux and the solar radiation penetrating through the ice. Another critical issue is the understanding of the mechanical breakage of ice, which is a challenging task due to the highly variable strength of the warm summer ice.
Acknowledgements
This research received financial support from the National Natural Science Foundation of China (NSFC) under contracts 51221961, 41376186, 2011DFA22260 and 41376005; the Liaoning Educational Committee Foundation under contract L2013497; and the Research Foundation of State Key Laboratory of Coastal and Offshore Engineering of Dalian University of Technology (No. LP1217). This study was initialized by Yu Yang in Helsinki with support of a CIMO scholarship from the Ministry of Education in Finland. Matti Leppäranta was funded by the Academy of Finland (contract 122412). The work of Bin Cheng was funded by the Academy of Finland (contract 263918). We are grateful to Dr Laurie Padman, Editor of Antarctic Science and one anonymous referee for their constructive comments. The weather station measurements and field work was supported by Chinese Arctic and Antarctic Administration under the sustainable Chinese National Antarctic Research Expedition (CHINARE) programme.
Author contribution
Yu Yang carried our model simulations and analysis (50%), Zhijun Li the literature review and field data analysis (10%). Matti Leppäranta carried out the analytical modelling and analysis of results (20%), Bin Cheng numerical model parametrizations (10%), Liqiong Shi field data and model data processing (5%) and Ruibo Lei field data (5%).



