Introduction
Future agricultural vehicles will be required to operate throughout extensive fields, such as broad-acre crops, with limited human supervision, while preserving safety (Ball et al., Reference Ball, Ross, English, Patten, Upcroft, Fitch, Sukkarieh, Wyeth and Corke2015). One of the challenges in this context is the ability to perceive and analyze the traversed ground. The knowledge of the type of terrain can be beneficial for a vehicle to deal with its environment more efficiently and to better support Precision Farming (PF) tasks. Terrain estimation also contributes to increase the safety of agricultural vehicles during operations near ditches or on hillsides and cross slopes and on hazardous highly-deformable terrain, as well as to predict the risk of soil compaction from farm machinery (Stettler et al., Reference Stettler, Keller, Weisskopf, Lamand, Lassen and Schjnning2014).
Previous work on terrain estimation in the context of vehicle mobility mostly relies on the use of sensors, such as vision (Ross et al., Reference Ross, English, Ball, Upcroft and Corke2015; Reina and Milella, Reference Reina and Milella2012), radar (Milella et al., Reference Milella, Reina and J. Underwood2015), and lidar (Kragh et al., Reference Kragh, Jorgensen and Pedersen2015). However, given the variety of conditions that can be encountered in the field, no single sensor can guarantee reliable measurements in every scenario (Reina et al., Reference Reina, Milella, Rouveure, Nielsen, Worst and Blas2016). Instead, a combination of multiple sensor inputs is generally needed to reach high levels of reliability and robustness.
This paper presents latest research by the authors in the development and implementation of advanced perception systems based on multi-sensor platforms and sensor processing algorithms to be integrated onboard agricultural vehicles. The aim of this research is to facilitate operations on a narrow scale with a smaller environment footprint that may be useful to increase precision during farming applications, including selective treatment and spraying, to provide fast automated safety responses or traversability assessment, and for controlled traffic purposes in general.
A modular imaging system that incorporates complementary sensors to generate multi-modal terrain maps including geometric, visual, hyperspectral and IR features is presented. The sensor suite comprises two visual cameras forming a stereo couple, a VIS-NIR sensor and a thermal camera. The idea is that, by registering and integrating all data, an accurate multi-modal representation of the terrain can be built. Stereovision provides a range representation of the environment in the form of 3D point cloud. The visual appearance of each 3D point can be obtained in the visible, near-infrared and infrared spectrum. As a result, a rich source of information can be drawn and made available to the user for precision farming purposes. Maps of the traversed environments can be generated augmenting the geometric 3D content with multi-spectral layers. The resulting terrain maps could be successively processed by using supervised or unsupervised classification methods to generate a semantic representation of the environment and specifically of the supporting terrain.
The idea of combining different optical systems for multi-modal environment and object modelling has been little investigated in the past. For instance, in (Nieto et al., Reference Nieto, Monteiro and Viejo2010) the fusion of laser and hyperspectral data is proposed to generate 3D geological models of the environment. In (Rangel et al., Reference Rangel, Soldan and Kroll2014), thermal, visual and depth information obtained from a thermography camera and a Microsoft Kinect depth camera are integrated to obtain 3D-thermal models for inspection tasks. The use of imaging spectroscopy and thermal imaging also in combination with lidars and stereo cameras has been investigated for remote soil monitoring and mapping (Mulder et al., Reference Mulder, de Bruin, Schaepman and Mayr2011). The application of such techniques for terrain estimation by a ground vehicle at a local level in the context of precision farming represents a novel and original contribution of this work.
In the rest of the paper, first, the sensor suite is introduced, then, the registration of the different data sources and the generation of augmented terrain maps are outlined. Finally, the results obtained in the field for acquisitions on different terrain surfaces are reported to validate the proposed methodology.
Materials and methods
Experimental test bed
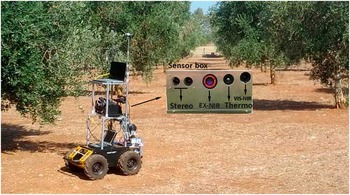
In this research, a robotic test bed is employed for sensor data collection (see Figure 1). The robotic base is a Husky A200 that is a non-holonomic 4-wheel drive skid-steer vehicle. It is equipped with a custom-built sensor box that is shown in the inset of Figure 1, comprising five cameras: two Basler DART DaA1600-60uc for stereo vision with 40mm baseline; thermal camera Micro Epsilon ThermalImager160; hyperspectral extended NIR Headwall X Series with Stingray optics 550-1700 nm; hyperspectral VIS-NIR Specim V10 on a Basler ACA1920-155 um 400-1000 nm. Both hyperspectral cameras are line-scan systems, therefore the spatial dimension is collected through vehicle movement.
Off road vehicle used for experimentation and close-up of the on board multi-modal imaging sensor box.

Stereo camera delivers up to 1600×1200 at 60 Hz, which was reduced to 7 Hz in the experiment. ThermalImager can deliver 160×120 at 120 Hz, reduced to 15 Hz. The Headwall is 320 pixels line scan with 8 nm waveband resolution at 90 Hz, while the VIS-NIR setup was 1920 pixel lines with 2 nm digital resolution at 128 Hz, optically limited to 8 nm usable bands. 2 nm actual resolution would require the significantly larger V10E spectrograph. The thermal camera and both hyperspectral cameras grab 16-bit images, while the color cameras are 8-bit. Note that processing of Headwall data is not included in this work.
The box also contains DC/DC conversion from 9-36 V to 12 V, has under-voltage protection and voltage balancing between two inputs, making it safe and easy to hotswap between two 4 S LiPo batteries. The embedded computer is Advantech MIO 5271 I5 dual core processor running Windows 10 IoT, and two system fans. Furthermore, it has an X-Imu and Emlid Reach RTK GPS. The weight of the system without battery is 5Kg, and it fits in a carry-on luggage with its 32×28×14 cm dimensions.
Sensor calibration
In order to register all sensor data with respect to a common reference frame, a calibration phase is needed to estimate the intrinsic and extrinsic parameters of the sensors. For the given sensor setup, the calibration process comprised the following steps.
-
1. Calibration of stereo device: the stereo pair was calibrated using the Camera Calibration Toolbox for MATLAB (Bouguet, Reference Bouguet2008). Both intrinsic (i.e., focal length, principal point, radial and tangential distortion coefficients) and extrinsic parameters (i.e., the relative position and orientation of the cameras with respect to each other) were estimated based on a set of images of a planar checkerboard that was appropriately moved across the field of view of each camera of the stereo device. The calibration functions also returned the rectification matrices to rectify the images as a preliminary step before applying the stereo-matching algorithm. An additional calibration step was successively performed to estimate the position and orientation of the stereo device with respect to a reference frame attached to the vehicle. To this aim, the calibration pattern was positioned at a known location with respect to the vehicle. Then, the extrinsic parameters relative to the pattern and, consequently, the position and orientation relative to the vehicle were inferred, using a least-squares optimization process.
-
2. Calibration of thermal camera: the procedure employed for the calibration of the visual cameras was adapted to estimate the intrinsic parameters of the thermal device. In particular, to make corners visible, the checkerboard was placed under a heat lamp.
-
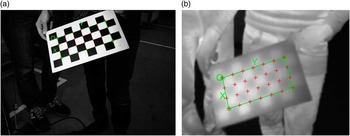
3. Calibration of thermal with respect to stereo camera: this calibration step was aimed to estimate the position and orientation of the thermal camera with respect to the stereo device. In particular, the transformation matrix relating the position and orientation of a reference frame attached to the thermal camera and a reference frame attached to the left camera of the stereo system was estimated. To this end, the calibration pattern was positioned at different locations in the environment, and images of the pattern were simultaneously acquired by the left camera of the stereo device and by the thermal camera. Sample calibration images are shown in Figure 2. Then, the extrinsic parameters of each camera relative to the pattern and, consequently, the position and orientation of the two cameras with respect to each other were inferred using a least-squares optimization process. Such a relationship is the basis for the back-projection of thermal image data onto the stereo reconstructed map, as will be described in the next section.
-
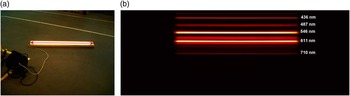
4. Calibration of VIS-NIR with respect to stereo camera: this calibration step was aimed to find the position of the scan line of the VIS-NIR sensor in the visual image. A fluorescent lamp was employed for this calibration task, as shown in Figure 3. The position of the scan line was found by moving the lamp across the floor so as to match the full field of view, i.e., the scan line, of the VIS-NIR camera. The aim was to find the line in the RGB that the VIS-NIR overlaps, in order to later map the VIS-NIR on top of the stereo image at that line.
Sample images acquired for calibration of (a) visual and (b) thermal cameras.

Sample images acquired during calibration of VIS-NIR with respect to the visual sensor: (a) visual image with overlaid the position of the VIS-NIR scan line; (b) VIS-NIR image with overlaid wavelength information.

Stereo-based mapping
Stereo data provides color and geometric information that can be used to generate a 3D map of the environment. Specifically, each stereo pair is, first, rectified, so as to reduce the problem of computing correspondences from a 2D to a 1D search problem. Then, the Semi-Global Matching (SGM) algorithm is applied to compute the disparity map. This algorithm combines concepts of local and global stereo methods for accurate, pixel-wise matching with low runtime (Hirschmuller, Reference Hirschmuller2005). Being the stereo pair calibrated both intrinsically and extrinsically, disparity values are converted in depth values and 3D coordinates are computed in the reference camera frame for all matched points. Point coordinates are successively transformed from camera frame to vehicle frame, using the transformation matrix resulting from the calibration process. A statistical filter is applied to reduce noise and remove outlying points. Finally, to decrease the computational burden, the number of points is reduced using a voxelized grid approach. Subsequent point clouds are stitched together to produce a 3D map. To this aim, the visual odometry library libviso2 (Geiger et al., Reference Geiger, Ziegler and Stiller2011) is employed to estimate the motion occurred between subsequent frames, based on the minimization of the reprojection error of sparse feature matches.
Integration of stereo and thermal data
A thermal 3D point cloud is obtained as follows. First, knowing the position and orientation of the thermal sensor with respect to the stereo device, 3D point coordinates are transformed from stereo to thermal reference frame. Then, knowing the intrinsic parameters of the thermal camera, 3D points are projected in the thermal image, and their thermal values are extracted and assigned to the corresponding 3D points in the stereo map. That originates what we refer to as the 3D thermal cloud. Based on vehicle motion information provided by the visual odometry algorithm subsequent thermal point clouds are then stitched together, to form an additional layer, i.e., the thermal layer, to the stereo-based map.
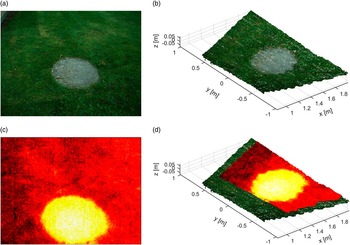
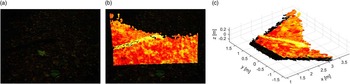
The result of stereo-thermal integration for a sample image is shown in Figure 4. Specifically, Figure 4 (a) shows the visual image acquired by the left camera of the stereo device, while Figure 4 (b) displays the stereo reconstructed point cloud. The synchronized thermal image is reported in Figure 4 (c). Finally, the stereo point cloud with overlaid thermal data is shown in Figure 4 (d). The latter provides a multi-modal 3D representation of the terrain, with stereovision information representing geometric and visual appearance properties of the ground, and thermal data providing temperature features.
Thermal and stereo integration for a sample test case: (a) visual image from left camera of the stereo system; (b) stereo reconstructed 3D point cloud; (c) thermal image; (d) thermal data overlaid on the stereo 3D point cloud. In (c) and (d), brighter colors corresponds to regions with higher temperature. Please refer to the online version for a clearer visualization.

The integration of the two sensor sources is beneficial in many ways. For instance, the stereo reconstruction helps in differentiating between terrain and obstacles, by adding height information, whereas the use of temperature data simplifies the identification of thin objects or living beings thanks to their different emissivity and temperature. It also helps discriminating different parts of the scene overcoming problems related to color similarities or poor lighting conditions typical of visual systems. An example is shown in Figure 5 for a sample image acquired in a forest environment. A thin trunk laying on the ground is clearly visible when adding thermal information, whereas it is not easily detectable using visual data only, due to low contrast and critical illumination conditions.
Integration of thermal and stereo data for a sample image: (a) visual image; (b) visual image with overlaid thermal data; (c) thermal data overlaid on the stereo 3D point cloud. A trunk lays on the ground in front of the vehicle and is clearly visible in the thermal point cloud, while it is not easily detectable in the visual image due to low contrast and poor illumination condition. Please refer to the online version for a clearer visualization.

Integration of stereo and VIS-NIR data
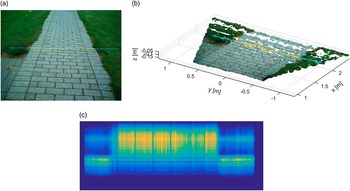
A 3D environment map augmented with VIS-NIR information is obtained by integrating the stereo reconstructed map with VIS-NIR data. Specifically, based on calibration information, the scan line of the VIS-NIR sensor is projected onto the image acquired by the reference (left) camera of the stereo device. Then, the corresponding 3D points reconstructed by stereovision are extracted, and they are assigned the spectral signature returned by the VIS-NIR sensor. An example is shown in Figure 6. In particular, Figure 6 (a) displays the visual image with overlaid the VIS-NIR scan line that is located at approximately 2 m ahead of the vehicle. The corresponding three-dimensional reconstruction is shown in Figure 6 (b). The VIS-NIR image is displayed in Figure 6 (c), where the light wavelength content and the horizontal scan distance are shown respectively along the vertical and horizontal axis. Note that, for visualization purposes, in Figure 6 (a) and (b) each point of the projected VIS-NIR scan line is assigned a false color where the red channel value is given by the average of the first 100 bands of the VIS-NIR image, the green channel value is given by the average of the successive 100 bands, and the blue channel value corresponds to the average of the last 100 bands. Using motion information provided by stereo visual odometry, subsequent scan lines can be stitched together, thus producing an additional layer, i.e., VIS-NIR layer, to the 3D map, as will be shown in the next section.
Integration of stereo and VIS-NIR data. (a) Visual image with VIS-NIR scan line overlaid. (b) 3D stereo reconstruction with VIS-NIR scan line overlaid. (c) VIS-NIR image. Note that, for visualization purposes, in (a) and (b), each point of the projected VIS-NIR scan line is assigned an RGB color where the red channel value is the average of the first 100 bands of the VIS-NIR image, the green channel value is the average of the successive 100 bands, and the blue channel value is given by the average of the last 100 bands. Please refer to the online version for a clearer visualization.

Results and discussion
In this section, the results obtained from the proposed multi-modal sensing and mapping system are presented. Tests were performed by driving the vehicle on different terrains, as the onboard sensors acquired data from the surrounding environment. Then, the proposed algorithm for multi-modal terrain mapping was applied offline.
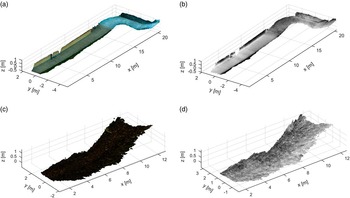
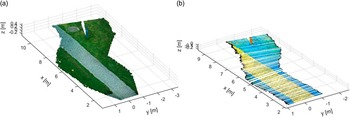
Figure 7 shows the 3D visual map (left) and its corresponding thermal layer (right) for two different tests. In these tests, three different terrain types were encountered, namely paved road, grass and agricultural terrain. Figure 8 refers, instead, to the integration of stereo and VIS-NIR data for a test comprising two different terrains (i.e., grass and paved road). Specifically, Figure 8 (a) shows the 3D stereo map, while in Figure 8 (b) its corresponding VIS-NIR layer is displayed with false colors. In all tests, the integration of the different sensor modalities led to maps containing multiple information including, geometry, color, thermal and spectral signatures. Such maps can be used to support any precision application that relies on the accuracy of terrain knowledge and representation at local level, such as variable rate applications, identification and removal of infected plants, or controlled traffic farming. They can also serve to increase vehicle mobility and safety, providing information about the terrain characteristics at various levels.
(a) Visual and (b) thermal layer of a 3D map obtained for a test including two different types of paved road, grass, a lateral wall, and some small obstacles (i.e., poles). (c) Visual and (d) thermal layer of a 3D map obtained for a test on agricultural terrain. Please refer to the online version for a clearer visualization.

(a) Visual and (b) VIS-NIR layer (displayed in false colors) of a 3D map obtained for a test including two different types of terrain (i.e., grass and paved road). Please refer to the online version for a clearer visualization.

Conclusion and future work
In this paper, a modular imaging system that incorporates visual, thermal and hyperspectral sensors for mapping unstructured arbitrary terrain is proposed. It is intended to be used on board an agricultural vehicle to support precision farming tasks. The design and implementation of the sensor suite on an off-road vehicle were discussed. Then, a method to integrate all sensor data into 3D models was presented. Results obtained from real sensor data were included to demonstrate the feasibility of the methods to produce accurate maps of different terrain types.
Future work will include the processing of the maps using supervised or unsupervised classification methods to generate semantic representations of the environment, and for terrain traversability assessment. Research efforts will also target the integration of the output maps into Farm Management Information Systems (FMIS) to enable map-based control of farming applications.
Acknowledgements
The financial support of the FP7 ERA-NET ICT-AGRI 2 through the grant Simultaneous Safety and Surveying for Collaborative Agricultural Vehicles (Id. 29839) (S3-CAV) is gratefully acknowledged. The authors would also like to thank the National Research Council, Italy, for supporting this work under the CNR 2016 Short Term Mobility program.