1. Introduction
Skarn is widely known to host important W, Cu, Fe, Zn, Pb, Ag, Au and Sn deposits (Hedenquist & Lowenstern, Reference Hedenquist and Lowenstern1994; Meinert et al. Reference Meinert, Dipple, Nicolescu, Hedenquist, Thompson, Goldfarb and Richards2005). Numerous economic geologists have studied the mineralization, metallogenic specialization and metallogenic models of skarn deposits (Newberry and Swanson, Reference Newberry and Swanson1986; Xie et al. Reference Xie, Mao, Zhu, Yao, Li, Li and Zhao2015). Recent studies indicate that the development and fertility of a particular skarn deposit depend on various parameters, such as the acidity and alkalinity of the magma (Meinert et al. Reference Meinert, Dipple, Nicolescu, Hedenquist, Thompson, Goldfarb and Richards2005; Ren et al. Reference Ren, Sun, Han, Liu, Wang, Gu, Zhao and Yu2017), the degree of crystallization differentiation (Meinert et al. Reference Meinert, Dipple, Nicolescu, Hedenquist, Thompson, Goldfarb and Richards2005; Fei et al. Reference Fei, Zhang, Cheng, Santosh, Jin, Wen, Li and Xu2018), the emplacement depth of the magma (Zhang et al. Reference Zhang, Zhou, Wan, Xi and Li2007), the volatile content (Zhong et al. Reference Zhong, Feng, Reimar, Li and Dai2018) and the oxygen fugacity (Chappell & White, Reference Chappell and White2001). Therefore, to evaluate the resource potential of a particular deposit, analyses of the magmatic properties of the metallogenic system and the constraints of magmatism on mineralization have become major topics in this field (Sun et al. Reference Sun, Zhang, Han, Men, Li, Chai and Yang2013).
The Lesser Xing’an Range is located in the eastern part of the Central Asian Orogenic Belt (CAOB) and is one of the areas with skarn deposits in China. In recent years, we have observed that in the Lesser Xing’an Range, with the exception of the large Cuihongshan Fe-polymetallic deposit (Fe: 68.35 Mt, 48 %); Hu et al. Reference Hu, Ding, He, Yao, Zhu, Shen and Chen2014 a), most skarn deposits have small reserves, such as the Baoshan Cu-polymetallic deposit (Cu: small-sized; Ren et al. Reference Ren, Sun, Han, Liu, Wang, Gu, Zhao and Yu2017), Daxilin Fe deposit (Fe: small-sized; Li et al. Reference Li, Han, Niu, Zhang, Wang, Cheng and Zheng2015), Da’anhe Au deposit (Au: medium-sized; Yang, Reference Yang2013), Xulaojiugou Pb–Zn deposit (Pb: 54 707 t, 2.18 %; Zn: 107 259 t, 2.06 %; Hu et al. Reference Hu, Ding, He, Yao, Zhu, Shen and Chen2014 b) and Ergu Fe–Zn polymetallic deposit (Fe: 17.31 Mt, 35 %; Ren et al. Reference Ren, Sun, Han, Liu, Wang, Gu, Zhao and Yu2017). Numerous scientific studies have focused on the chronology and metallogenic dynamics of these deposits to establish the metallogenic dynamics framework of the area and to determine the timing and spatial scope of the Palaeo-Asian and Circum-Pacific tectonic systems (Tan, Reference Tan2013; Xu et al. Reference Xu, Xu, Wang, Gao and Yu2013). However, the core problem concerning which magmatic properties can restrict mineralization and resource potential is seldom discussed.
The Ergu Fe–Zn polymetallic deposit, located in the central Lesser Xing’an Range, is a representative skarn deposit and a good candidate for determining the constraints that magmatism imposes on skarn polymetallic deposits. In this study, we report new data on the geochronology, geochemistry and Sr–Nd–Pb–Hf isotopic compositions of intrusives in mining areas. Based on these data, in combination with previous work, we conclude that the magmatism and mineralization of the Ergu deposit occurred during the Early Jurassic and were likely related to the magmatic arc system of the continental margin in eastern China where the Palaeo-Pacific Plate was subducting beneath Eurasia in the Mesozoic. In addition, we determined that the high water content, high oxygen fugacity and medium-deep emplacement of the granodioritic magma were the key factors in the formation of the medium-sized Fe–Zn polymetallic skarn deposit in this area.
2. Regional geology
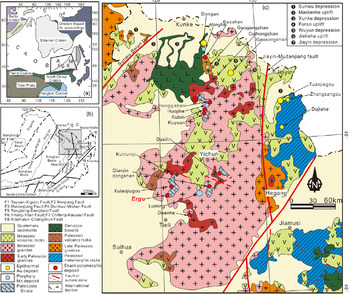
The central Lesser Xing’an Range is located in the eastern segment of the CAOB, sandwiched between the Siberian Craton, North China Craton and Pacific Plate (Fig. 1a). The area has a complex tectonic history, including the evolution of the Palaeo-Asian Ocean, the effects of the Mesozoic subduction of the Palaeo-Pacific Plate, and Cenozoic supracrustal faulting (Jahn et al. Reference Jahn, Wu and Chen2000; Windley et al. Reference Windley, Alexeiev, Xiao, Kröner and Badarch2007; Sun et al. Reference Sun, Zhang, Xing, Zhao, Zhang, Bai, Ma and Liu2012), resulting in a large number of magmatic, structural and mineralization events in this region (Fig. 1b, c).
(a) Location of NE China with respect to the main tectonic units of China and Russia, modified after Wu et al. (Reference Wu, Yang, Lo, Wilde, Sun and Jahn2007). ‘A’ and ‘M’ represent the Altaids and Manchrids. (b) Tectonic sketch maps of NE China, modified after Wu et al. (Reference Wu, Jahn, Wilde and Sun2000). (c) Simplified geological map of the Lesser Xing’an range, modified after Wu et al. (Reference Wu, Sun, Ge, Zhang, Grant, Wilde and Jahn2011).

The stratigraphy (Fig. 1c) of this region is dominated by the gold-bearing silicoferrite of the Dongfengshan Formation (821–801 Ma; Gao et al. Reference Gao, Wang, Xu and Yang2013) and the overlying Cambrian–Ordovician neritic facies clastic rocks (limestone, dolomite marble, carbonaceous slate, etc.; ˜500 Ma; Li, Reference Li1999), Permian terrigenous clastic-carbonate formations (amphibolite, marble, tuff, felsic schist and slate, etc.; Ren, Reference Ren2017), Mesozoic continental volcanic rocks (including two stages: 190–170 Ma and 130–105 Ma), and Palaeogene fluvial and lacustrine clastic sedimentary rocks (Heilongjiang Bureau of Geology and Mineral Resources, 1993). Among them, the Palaeozoic strata are closely related to the mineralization of skarn-type deposits in the study area. The Lesser Xing’an Range is also characterized by voluminous Phanerozoic granitoids, which are distributed along a N–S-trending granite belt and are characterized by four periods: (1) Early Caledonian intrusions (490–417 Ma), (2) Late Hercynian granitoids (272–251 Ma), (3) Late Hercynian and Indosinian – Early Yanshanian plutonic rocks (225–175 Ma) (Wei, Reference Wei2012; Yu et al. Reference Yu, Wang, Xu, Gao and Pei2012; Wang et al. Reference Wang, Xu, Pei, Wang and Guo2016) and (4) Late Yanshanian granitoids (154–101 Ma; Zhang, Reference Zhang2013; Han et al. Reference Han, Sun, Liu, Ren, Wang, Zhang, He, Yu and Lu2019). Of these, the Late Hercynian and Indosinian – Early Yanshanian plutonic rocks are the most common and are closely related to skarn polymetallic deposits (Sun et al., Reference Sun, Arculus, Kamenetsky and Binns2004; Wu et al. Reference Wu, Sun, Ge, Zhang, Grant, Wilde and Jahn2011; Hu et al. Reference Hu, Ding, He, Yao, Zhu, Shen and Chen2014 a, b). The dominant regional structures are oriented to the NE and nearly N–S and include the Yitong–Yilan Fault, Dunhua–Mishan Fault and Jiayin–Mudanjiang Fault. These structures jointly control the distribution of igneous rocks and deposits, such as porphyry Mo deposits (e.g. Luming (Chen & Zhang, Reference Chen and Zhang2018); Huojihe (Hu et al. Reference Hu, Yao, Zeng, Liu and Zhang2019); Cuiling and Gaosongshan (Hao et al. Reference Hao, Ren, Yang, Duan, Sun, Fu and Li2015)), epithermal gold deposits (Dong’an (Zhang et al. Reference Zhang, Mao, Wang, Pirajno, Liu and Zhao2010); Gaosongshan (Liu et al. Reference Liu, Sun, Han, Ren, Gu, Zhao and Wang2019); Yongxin (Zhao et al. Reference Zhao, Sun, Li, Xu, Lv, Wu, Guo, Liu and Ren2019)) and skarn deposits (Cuihongshan (Zhang et al. Reference Zhang, Sun, Xing and Zhang2018); Ergu and Baoshan (Ren, Reference Ren2017)). Among them, the porphyry Mo deposits occur in the porphyry or in the late lithofacies of the granitic complex, with formation ages concentrated in the Early Jurassic (176–186 Ma). The epithermal deposits are mostly developed in the Early Cretaceous volcanic, subvolcanic or hypabyssal porphyry areas, with the mineralization mainly occurring from 110 to 95 Ma. Skarn deposits are mainly developed in the contact zone between the Palaeozoic strata and Mesozoic granite. Except for the Baoshan deposit, which formed in the Early Triassic (250.3 Ma), most skarn deposits formed in the Early–Middle Jurassic (179.9–203 Ma) (Fig. 1c).
3. Ore deposit geology
The Ergu Fe–Zn polymetallic deposit is located in the central Lesser Xing’an Range, NE China. The deposit was discovered by aeromagnetic anomalies in the ground in 1960 and yielded proven resources of 15.8 Mt Fe, 0.021 Mt Cu, 0.03 Mt Mo, 0.23 Mt Zn and 0.13 Mt Pb, with average grades of 34.66 % Fe, 0.54 % Cu, 0.05 % Mo, 3.9 % Zn and 3.4 % Pb. Additionally, the skarn deposits contain other economic components, such as In, Ga and Ag (Ren, Reference Ren2017).
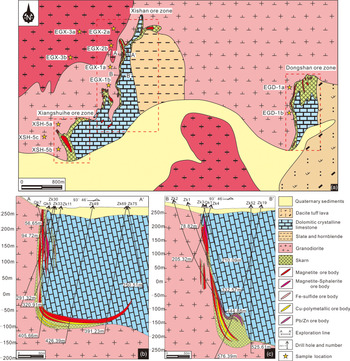
The exposed strata in the mining area are typically the lower Cambrian Qianshan and Laodaogoumiao Formations, which consist of crystalline limestone and marble, silty slate and hornstone, respectively. In addition, the Permian Wudaoling Formation and Quaternary are also well developed in the mining area, consisting of dacitic tuffaceous lava and alluvial sediments, respectively (Fig. 2a). The unit closely related to mineralization is the Qianshan Formation. Because the early Palaeozoic strata in the mining area were destroyed by the influence of magmatic and structural activity, they are mostly in the form of captured bodies with scattered and irregular distributions. The intrusions in the mining area are widely distributed, occupying c. 80 % of the mining area. The main lithologies are Early Jurassic medium-grained granodiorite and porphyry granite, which are different lithofacies evolved from the magma of the same period, and all occur in the shape of rock stock (Ren, Reference Ren2017). In addition, there are a few late diorite dikes. The main ore-controlling structure in the mining area is the Xulaojiugou–Ergu anticline oriented in the N–S direction. The ore bodies mainly occur at the contact between the Qianshan Formation and the granodiorite, and there are three ore zones, including Xishan, Xiangshuihe and Dongshan (Fig. 2a).
(a) Simplified geological map of the Ergu Fe–Zn polymetallic deposit; (b, c))cross section of the Ergu Fe–Zn polymetallic deposit (sketch modified after Ren, Reference Ren2017).

To date, a total of 21 cystiform, lenticular or veined ore bodies have been discovered, with a length of 30–887 m, a width of 0.92–13.9 m and a maximum extension depth of 556 m. These ore bodies occur in the inner, middle and outer zones of the contact zone between the granodiorite and carbonate rocks of the lower Cambrian Qianshan Formation (Fig. 2). The developed ore bodies are magnetite ore bodies; magnetite–sphalerite ore bodies formed by quartz veinlets containing sphalerite-penetrating magnetite; pyrrhotite–pyrite–arsenopyrite ore bodies; copper polymetallic ore bodies; and galena–sphalerite ore bodies. Of these, the magnetite ore bodies and magnetite–sphalerite ore bodies are relatively developed. Therefore, the Ergu deposit is a skarn Fe–Zn polymetallic deposit. The attitudes of the deposits are obviously controlled by associated structures, and the ore bodies feature a wavy distribution in cross section. Generally, when the contact zone between the granodiorite and the carbonate of the Qianshan Formation exhibits a shallower dip or curves, the thickness of the ore body clearly increases. These ore bodies developed in the contact zone near the granodiorite intrusion (1–28 m) are mainly enriched in Fe and Cu, and those far from the granodiorite intrusion (15–87 m) are mainly enriched in Pb and Zn (Fig. 2b, c).
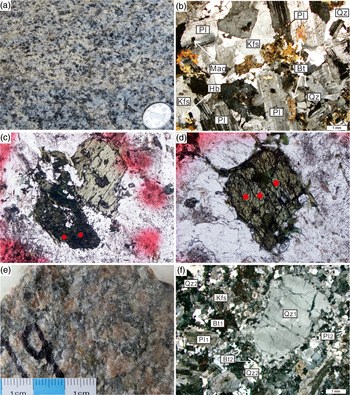
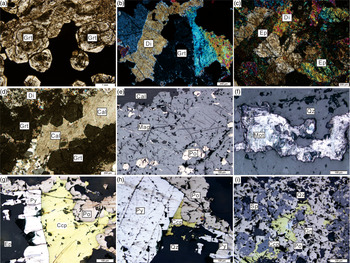
The medium-grained granodiorite related to mineralization has an exposed area of ˜10 km2 and occurs in the form of batholith or stock (Fig. 2a). The medium-grained granodiorite is white-grey in colour, with a medium-grained granitic texture (d = 2–5 mm) and a massive structure. The rock is composed of plagioclase (35–40 %), K-feldspar (20–25 %), quartz (20–25 %), amphibole (5–10 %) and biotite (˜5 %), with accessory magnetite, zircon and apatite (Fig. 3a, b). The amphibole crystals (0.5–1.5 mm) are mainly light green to dark green, occur as isolated crystals and show uniform and weak opacification (Fig. 3c, d), which records the physicochemical information of deep crystallizing magmas (Chambefort et al. Reference Chambefort, Dilles and Longo2013). The porphyritic granite is off-white to light pink in colour and has a fine-grained porphyritic texture defined by 35–40 % phenocrysts. Phenocrysts are composed of K-feldspar (35–40 %), quartz (25–30 %), plagioclase (20–25 %) and biotite (˜5 %). The groundmass is dominated by quartz, K-feldspar plagioclase and biotite. The porphyritic granite also contains accessory zircon and apatite (Fig. 3b, d). The main wall-rock alterations are silicification, skarnization, epidotization, carbonation and fluoritization, and there is a small amount of chloritization, potassium and sericitization. Generally, the closer to the skarn belt, the stronger the wall-rock alteration. The gangue minerals consist of garnet (Fig. 4a, d), diopside (Fig. 4c, d), epidote (Fig. 4b, c, g), quartz and calcite (Fig. 4d, e), with minor chlorite, fluorite, phlogopite and actinolite. The ore structures are typically massive and disseminated, with some also exhibiting stockwork and banding. The ore minerals are dominated by magnetite (Fig. 4b, e), chalcopyrite (Fig. 4g, h), pyrite (Fig. 4g, h), molybdenite (Fig. 4f), pyrrhotite (Fig. 4g, h) and sphalerite (Fig. 4i), with minor galena (Fig. 4i), scheelite and malachite.
(a) Hand specimen photograph and (b) photomicrographs of granodiorite with massive structures; (c, d) Light green, euhedral amphibole crystals in the granodiorite. (e) Hand specimen photograph and (f) photomicrographs of porphyritic granite with massive structures. Bt = biotite; Kfs = K-feldspar; Pl = plagioclase; Q = quartz; Hb = amphibole; Mag = magnetite.

Photomicrographs of skarn and mineralization features in the Ergu Fe–Zn polymetallic deposit. (a) A typical zoned garnet crystal; (b) epidote and magneitite intergrowth; (c) tufted epidote crystal; (d) early garnet and diopside minerals are cut by calcite veins;(e) microscopic picture of magnetite replaced by pyrrhotite; (f) irregular molybdenite crystal; (g) microscopic picture of paragenetic pyrite and chalcopyrite; (h) mineral assemblage consisting of pyrite, chalcopyrite and pyrrhotite; (i) mineral assemblage consisting of pyrite, galena, sphalerite and chalcopyrite. Grt = garnet; Di = diopside; Ep = epidote; Cal = calcite; Mag = magnetite; Ccp = chalcopyrite; Py = pyrite; Mot = molybdenite; Po = pyrrhotite; Sp = sphalerite; Gn = galena.

4. Samples and analytical methods
On the basis of detailed field geological work and petrographic observations, two medium-grained granodiorite samples (EGX-1 and XSH-5) and two porphyritic granite samples (EGX-2 and EGX-3) were chosen for zircon U–Pb dating, and samples EGX-1, XSH-5 and EGX-2 were chosen for in situ Hf isotopic analysis. Seven medium-grained granodiorite samples and four porphyritic granite samples were collected for major and trace element analyses. Seven medium-grained granodiorite samples (EGX-1 and XSH-5) were collected for electron microprobe analysis of amphibole. A total of four medium-grained granodiorite samples were chosen for Sr–Nd–Pb isotopic analysis (sampling locations are marked in Fig. 2).
4.a. Zircon U–Pb dating and Lu–Hf isotope analyses
Zircons were extracted from representative medium-grained granodiorite samples (EGX-1 and XSH-5) and porphyritic granite samples (EGX-2 and EGX-3) using standard density and magnetic separation techniques followed by handpicking using a binocular microscope at the Langfang Regional Geological Survey, Hebei Province, China. Many zircons were handpicked from the samples pasted on the resin disc under the binocular microscope, and then polished to expose the grain centres. Cathodoluminescence (CL) images of the zircon grains were taken using a Mono CL3 detector (manufactured by Gatan USA) attached to a scanning electron microscope (manufactured by JSM6510, JEOL, Japan) at the Nanjing Hongchuang. Exploration Technology Service Co., Ltd. After CL images were taken with a JEOL scanning electron microscope, the zircon grains were subjected to in situ U–Pb dating and Hf isotope analysis.
Analysis of zircon trace elements was carried out using an Agilent 7900 inductively coupled plasma mass spectrometer (ICP-MS) instrument coupled with a 193 nm ArF excimer laser (COMPexPro 102, Coherent, DE) with the automatic positioning system at the MLR Key Laboratory of Mineral Resources Evaluation in Northeast Asia, Jilin University, Changchun, China. During analysis, the laser spot size was set to 32 μm for most analyses, the laser energy density was set to 10 J cm−2 and the repetition rate was set to 8 Hz, with data acquired over a duration of 80–120 s. Calibrations for elemental concentration analysis in zircon were performed using NIST 610 glass as an external standard and 29Si as an internal standard. U–Pb isotope fractionation effects were corrected using the zircon standard Plesovice (337 Ma) as an external standard. The zircon standard 91500 was used as a secondary standard to monitor the deviation in age measurement/calculation. The trace element compositions of zircons were calibrated against NIS610 combined with the internal standardization of Si. Isotopic ratios and element concentrations of zircons were calculated using GLITTER (ver. 4.4.2, Macquarie University). Concordia diagrams were constructed using Isoplot/Ex (3.0) (Ludwig, Reference Ludwig2003). Common lead was corrected using (laser ablation) LA-ICP-MS Common Lead Correction (ver. 3.15), following the method of Andersen (Reference Andersen2002). The analytical data are presented on U–Pb concordia diagrams with 2σ errors. The mean ages are weighted means at 95 % confidence levels.
In situ zircon Hf isotopic analyses were conducted on the same spots or on the same zircon zones where U–Pb age determinations were made. In situ Hf isotope ratio analysis experiments were conducted using a Thermo Finnigan Neptune (multicollector) MC-ICP-MS system coupled to a New Wave UP 193 nm laser ablation system at the Laboratory of Isotope Geology, Tianjin Institute of Geology and Mineral Resources, Tianjin, China. A laser repetition rate of 11 Hz at 100 mJ was used for ablating zircons, and the laser beam diameter was 50 um. Helium was used as the carrier gas for the ablated aerosol. Details of the instrumental conditions and analytical procedures for Lu–Hf isotope analyses are described by Geng et al. (Reference Geng, Qiu, Gou and Yu2017). Isotopes, including 177Hf, 178Hf, 179Hf, 180Hf, 172Yb, 173Yb, 175Lu, 176(Hf + Yb + Lu), and 182W, were measured during the analytical process. All Lu–Hf isotope results are reported with 2σ uncertainties. In this study, the detailed operating conditions for the laser ablation system and the MC-ICP-MS instrument and analytical method were the same as those described by Geng et al. (Reference Geng, Qiu, Gou and Yu2017).
4.b. Electron microprobe analysis of amphibole
The rock-forming minerals (three amphiboles) from two granodiorite samples (EGX-1 and XSH-5) were analysed for their chemical composition using a JEOL JEOL-8100 electron microprobe (EPMA) at the Electron Probe Laboratory of Northeast Asia, Ministry of Land and Resources of China, Changchun, China. Measurements were performed using a voltage of 20 kV and a current of 1 × 10⁻⁸ A. The measuring time was 10 s and the results were corrected using the ZAF algorithm. The following mineral standards, recommended by the American National Standard Mineral Bureau, were used for quality control: rutile for Ti; diopside for Si, Mg and Ca; orthoclase for K; albite for Na and Al; almandine for Fe; and crocoite for Cr.
4.c. Major and trace element determinations
The whole-rock sample analysis experiment was completed in the Geological Laboratory of Hebei Regional Institute of Geology and Mineral Resources. Prior to geochemical and isotopic analysis, the rock samples were washed with pure water, dried and crushed into powder of less than 200 mesh. Major and trace elements were obtained at the Beijing Research Institute of Uranium Geology, Beijing, China. Major element analyses were determined by X-ray fluorescence using a Rigaku RIX 2100 spectrometer with analytical uncertainties of 1–5 %. Trace element compositions were determined using a PEE lan 6000 ICP-MS with analytical uncertainties of 1–3 %. Details of the analytical technique are described by Rudnick et al. (Reference Rudnick, Gao, Ling, Liu and McDonough2004) and Li et al. (Reference Li, Qi, Liu, Liang, Tu, Xie and Yang2005).
4.d. Sr–Nd–Pb isotopic analyses
The Rb–Sr, Sm–Nd and Pb isotopic compositions were determined by isotope dilution methods. The measurements were performed on a Finnigan MAT thermal ionization mass spectrometer (Triton TI) at the State Key Laboratory for Mineral Deposits Research, Nanjing University, China. Dissolution and chemical separation of Sm–Nd and Rb–Sr samples were performed using a procedure similar to that described in Pu et al. (Reference Pu, Gao, Zhao, Ling and Jiang2005). All Sr data are corrected for mass fractionation to 86Sr/87Sr = 0.1194 and reported relative to a value of 87Sr/86Sr = 0.705018 ± 0.000003 (2σ) for the BCR-2 standard. In the Nd isotopic analysis, 146Nd/144Nd = 0.7219 was taken as the standard for mass fractionation correction, and Nd isotopic ratios were normalized to a value of 143Nd/144Nd = 0.511842 ± 0.000004 (2σ) for La Jolla. The ϵNd(t) values and fSm/Nd and Nd model ages were calculated assuming 147Sm/144Nd and 143Nd/144Nd ratios for average chondrite and the depleted mantle at the present day to be 0.1967 and 0.512638 and 0.2137 and 0.51315, respectively (Hamilton et al. Reference Hamilton, O’Nions, Bridgwater and Nutman1983). λRb and λSm are 1.42 × 10⁻¹¹ year−1 and 6.54 × 10⁻¹² year−1, respectively (Lugmair & Harti, Reference Lugmair and Harti1978).
Whole-rock Pb isotopic measurements were conducted with a MAT-261 thermal ionization mass spectrometer. First, to remove surface contamination, c. 50–80 mg of powder for each whole-rock sample was leached in acetone. Second, the samples were washed with distilled water and dried at 60 °C in an oven. Third, each whole-rock sample was dissolved in distilled HF + HNO3 (150 °C, 168 h). Fourth, the Pb was separated on Teflon columns using an HBr–HCl wash with an elution procedure and then loaded with a mixture of Sigel and H3PO4 onto a single Re filament (1300 °C). The measured Pb isotope ratios were corrected by repeated analyses of the NBS-981 Pb standard. The total procedural blanks for Pb was were lower than 200 pg. In this study, the detailed operating conditions and analytical method were the same as those described by Xu et al. (Reference Xu, Sun, Liang, Xu and Chu2020).
5. Results
5.a. Zircon LA-ICP-MS U–Pb dating
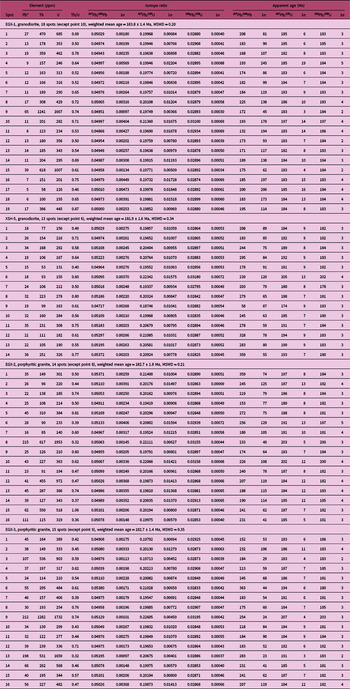
Medium-grained granodiorite samples (EGX-1 and XSH-5) and porphyritic granite samples (EGX-2 and EGX-3) were selected for zircon U–Pb geochronology study. The results of zircon U–Pb dating are given in Table 1, and the corresponding CL images, concordia diagrams, weighted ages and chondrite-normalized rare earth element (REE) patterns of the zircon are shown in Figures 5, 6 and 7.
LA-ICP-MS zircon U–Pb of granodiorite (EGX-1 and XSH-5) and porphyritic granite (EGX-2 and EGX-3) from the Ergu Fe–Zn polymetallic deposit

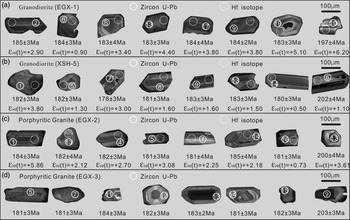
Cathodoluminescence (CL) images of representative analysed zircons from granodiorite (a, b) and porphyritic granite (c, d) of the Ergu Fe–Zn polymetallic deposit. Full line represents U–Pb age analytical spot; dashed line represents Hf isotope analytical spot.

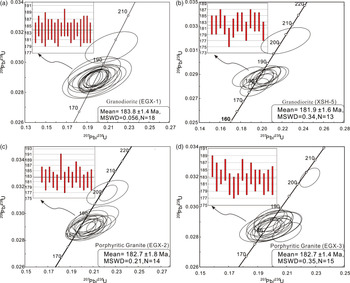
Concordia diagrams of zircon U–Pb ages and the weighted mean diagrams for granodiorite (a, b) and porphyritic granite (c, d) of the Ergu Fe–Zn polymetallic deposit.

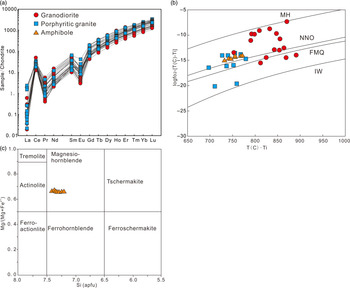
Chondrite-normalized REE patterns of zircon grains (a), magma oxygen fugacity (fo2) of the granodiorite, porphyritic granite and amphibole of granodiorite in the Ergu deposit (b), and classifications and compositions of amphiboles (c). MH = magnetite–hematite buffer; NNO = Ni–NiO buffer; FMQ = fayalite–magnetite–quartz buffer; IW = iron–wustite buffer. The calculation method of lgfo2 and T (Ti-in-zircon thermometer) is based on Ferry & Watson (Reference Ferry and Watson2007) and Qiu et al. (Reference Qiu, Yu, Santosh, Zhang, Chen and Li2013).

In the CL images, the characteristics of the zircon grains from the medium-grained granodiorite and porphyritic granite are similar. The zircons are columnar or short columnar, with good crystal shapes and clear edges and corners (80–250 μm long; length/width ratios of 1:1 to 3:2), and display clear oscillatory growth zoning in the CL images (Fig. 5). The U and Th contents and the Th/U ratios of the zircons are 131–1667 ppm, 53–1241 ppm and 0.40–0.87 (average value 0.63) for the granodiorite and 140–1732 ppm, 85–1282 ppm and 0.32–1.06 (average value 0.55) for the porphyritic granite, respectively, indicating that the zircons are of magmatic origin (Hoskin & Schaltegger, Reference Hoskin and Schaltegger2003).
The zircon grains collected from EGX-1 yield 206Pb/238U ages of 183–186 Ma, with a weighted mean 206Pb/238U age of 183.8 ± 1.4 Ma (2σ; n = 18; MSWD = 0.056; Fig. 6a). The zircon grains collected from XSH-5 yield 206Pb/238U ages of 178–184 Ma, with a weighted mean 206Pb/238U age of 181.9 ± 1.6 Ma (2σ; n = 13; MSWD = 0.34; Fig. 6b). However, there is one zircon with older 206Pb/238U ages of 197 Ma and 202 Ma in each sample (Fig. 5). These grains may be inherited or were captured by early magmatic events. The REE patterns (Fig. 7) of the medium-grained granodiorite and porphyritic granite are typically characterized by heavy REE (HREE) enrichment and light REE (LREE) depletion with distinct positive Ce anomalies and strongly negative Eu anomalies. Therefore, we believe that the granodiorite and porphyry granite are comagmatic and formed in the Early Jurassic (181.9–183.8 Ma).
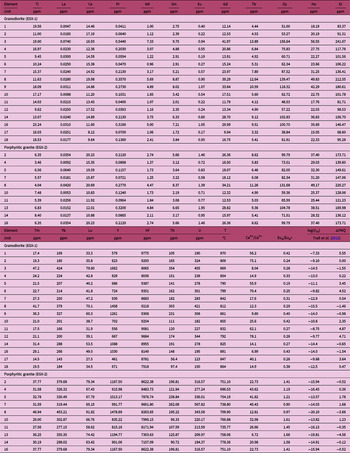
In addition, the variation in crystallization temperature and oxygen fugacity of granodiorite and porphyritic granite with the trace element content in zircon was estimated using software developed by Li et al. (Reference Li, Cheng and Yang2019). On the basis of zircon trace element and whole-rock geochemical data, Ce4+/Ce3+, magmatic temperature and oxygen fugacity were calculated as functions of REE and Ti concentrations in zircons. Appropriate zircons with low La contents (<1 ppm) were selected for estimation to avoid the influence of mineral inclusions such as monazite in zircons (Zou et al. Reference Zou, Qin, Han, Li, Evans, Li and Yang2019). The estimated results are presented in Table 2. The granodiorite has high magmatic temperatures ranging from 790 °C to 891 °C (mean = 854 °C) and variable ΔFMQ values of –1.55 to +5.55 (mean = +1.82). Compared with the granodiorite, the porphyritic granite has a relatively lower crystallization temperature (697–813 °C; mean = 778 °C) and oxygen fugacity (ΔFMQ = –4.56 to +1.78; mean = −0.47).
Zircon grains trace elements of granodiorite (EGX-1) and porphyritic granite (EGX-2) from the Ergu Fe–Zn polymetallic deposit

5.b. Electron microprobe analysis of amphibole
Three amphibole crystals (seven analyses) from two granodiorite samples collected from the surface are Mg–hornblende in composition (Fig. 7c), and show little compositional variation in their major elements, with 47.97–49.70 wt % SiO2, 0.52–0.97 wt % TiO2, 5.54–6.26 wt % Al2O3, 15.84–16.71 wt % FeO, 11.58–12.22 wt % MgO and 10.70–1.22 wt % CaO (Table 3). The equations proposed by Ridolfi et al. (Reference Ridolfi, Renzulli and Puerini2010) were used to estimate the T, H2O content and fO2 of the magma from which amphiboles crystallized. The calculated temperatures and pressures of amphibole grains have narrow ranges of 732–772 °C (753 ± 18 °C) and 0.77–0.93 kbar (0.83 ± 0.09 kbar), respectively; therefore, we infer that these amphiboles crystallized at depths of 2.90–3.49 km (3.13 km; assuming conditions of lithostatic pressure with ρ = 2.7 g m−3) (Table 3). These computations were performed with the Geo-fO2 software (Li et al. Reference Li, Cheng and Yang2019).
Composition of amphibole from the Ergu granodiorites

* The structural formulae of the amphibolite were calculated on the basis of 23 oxygen atoms.
5.c. Whole-rock geochemistry
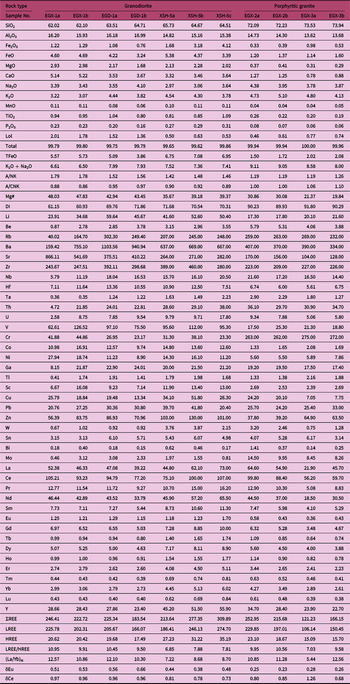
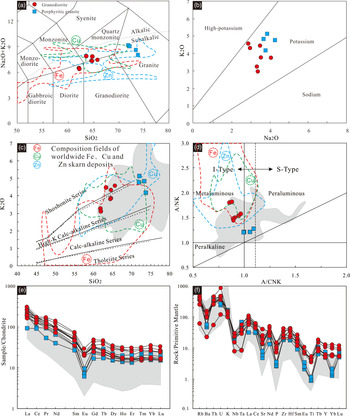
The major and trace element concentrations of the seven medium-grained granodiorite and four porphyritic granite samples analysed in this study are presented in Table 4. The granodiorites have the following composition: SiO2 = 62.02–65.73 wt %, Al2O3 =14.82–16.99 wt %, K2O = 3.07–4.54 wt %, and Na2O + K2O = 7.40–8.31 wt %. Compared with the granodiorites, the porphyritic granite has higher concentrations of SiO2 (72.09–73.94 wt %) and K2O (4.13–5.10 wt %) and lower concentrations of Al2O3 (13.62–14.73 wt %). In the plot of the total alkalis vs SiO2 (TAS) diagram, the granodiorite samples plot on the boundary lines separating the quartz monzogranite, diorite and granodiorite fields, and the porphyritic granite plots within the granite field (Fig. 8a; Middlemost, Reference Middlemost1994) and is classified as subalkaline (Irvine & Baragar, Reference Irvine and Baragar1971). The granodiorite and porphyritic granite samples are classified as potassic suites based on the K2O vs Na2O diagram (Fig. 8b; Middlemost, Reference Middlemost1972). In the SiO2 vs K2O diagram (Fig. 8C; Peccerillo & Taylor, Reference Peccerillo and Taylor1976), most samples plot in the high-K calc-alkaline series field, and a few samples plot in the shoshonite series. Their A/CNK and A/NK values range from 0.86 to 0.97 and 1.42 to1.79, respectively, falling in the metaluminous and weakly peraluminous regions (Fig. 8d; Maniar & Piccoli, Reference Maniar and Piccoli1989). In addition, the granodiorite samples plot on the junction of Fe, Cu and Zn deposits in the TAS diagram (Fig. 8a), SiO2 vs K2O diagram (Fig. 8c) and A/CNK vs A/NK diagram (Fig. 8d).
Whole-rock geochemical data of intrusions from the Ergu Fe–Zn polymetallic deposit (major elements wt %; trace elements ppm)

Note: LOI: Loss on ignition; A/CNK = molecular [Al2O3/(CaO + Na2O + K2O)]; A/NK = molecular [Al2O3/(Na2O + K2O)]; δEu = EuN/(GdN + SmN)1/2; (La/Yb)N = (La/0.237)/(Yb/ 0.17); Mg# = 100 molecular Mg2+/(Mg2+ + Fe2+).
(a) SiO2 vs (Na2O + K2O) plot (Middlemost, Reference Middlemost1994). (b) Na2O vs K2O plot (Middlemost, Reference Middlemost1972). (c) SiO2 vs K2O plot (Peccerillo & Taylor, Reference Peccerillo and Taylor1976). (d) A/CNK vs A/NK plot (Maniar & Piccoli, Reference Maniar and Piccoli1989). (e) Chondrite-normalized REE patterns (normalized values are from Boynton, Reference Boynton and Henderson1984). (f) Primitive-mantle-normalized trace element patterns (normalized values are from Sun & McDonough, Reference Sun, McDonough and Saunders1989). Average values of major element contents and the compositional fields of plutons associated with Fe, Cu, Zn and skarn deposits worldwide (Meinert, Reference Meinert1995; Pons et al. Reference Pons, Franchini, Meinert, López-Escobar and Maydagán2010) are shown for comparison (a, c, d). The shaded areas represents the Early Jurassic granite data in the Lesser Xing’an Ranfe area and are modified after Xu et al. (Reference Xu, Xu, Wang, Gao and Yu2013) and Han et al. (Reference Han, Sun, Liu, Ren, Wang, Zhang, He, Yu and Lu2019).

The granodiorite samples and porphyritic granite have high contents of large-ion lithophile elements (LILEs; such as Rb and Ba) and LREEs and are relatively depleted in high field strength elements (HFSEs; Nb, Ta, Hf and Th). These rocks are rich in LREEs but depleted in HREEs (Fig. 8e; Boynton, Reference Boynton and Henderson1984). The granodiorite samples are moderately fractionated, yielding LREE/HREE ratios of 6.85–10.95 (with a mean of 9.05), and clearly negative Eu anomalies (δEu = 0.38–0.66, with a mean of 0.51). In comparison, the porphyritic granite samples have higher degrees of fractionation between LREEs and HREEs, with LREE/HREE ratios of 7.03–10.56 (with a mean of 9.28) and strongly negative Eu anomalies (δEu = 0.23–0.28, with a mean of 0.26). In a primitive mantle-normalized trace element spider diagram (Fig. 8f; Sun & McDonough, Reference Sun, McDonough and Saunders1989), the samples are enriched in Rb, Th, U and LREEs and depleted in Sr and HFSEs, such as Nb, Ta, P and Ti.
5.d. Zircon Lu–Hf isotopic data
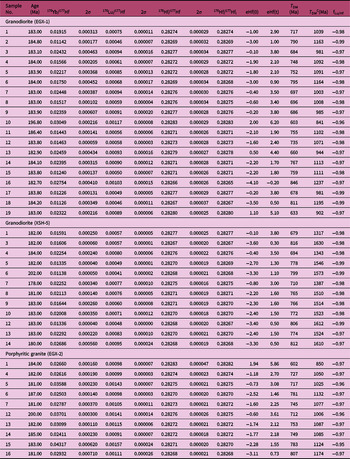
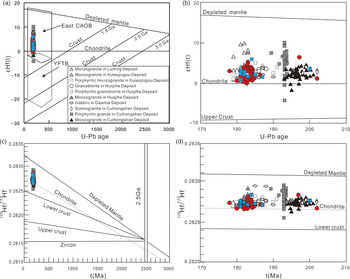
The results of the Lu–Hf isotope analysis of the granodiorite (EGX-1, XSH-5) and porphyry granite (EGX-20) zircon U–Pb spots are listed in Table 5. The 29 magmatic zircons from the granodiorite, all of which yield similar ages (178.0–186.4 Ma), have initial 176Hf/177Hf ratios of 0.282656–0.282804, ϵ Hf(t) values of −0.5 to +5.1 and T DM2 ages ranging from 902 to 1630 Ma. Two zircons with ages of 196.8 Ma (EGX-1-10) and 202 Ma (XSH-5-06) have initial 176Hf/177Hf ratios of 0.282679–0.282829, with ϵ Hf(t) of +1.1 to +6.2 and T DM2 ages of 841 to 1573 Ma, respectively. The nine magmatic zircons from the porphyry granite, all of which yield ages of 181 to 187 Ma, have initial 176Hf/177Hf ratios of 0.282684–0.282827, ϵ Hf(t) values of +0.73 to +5.86 and T DM2 ages of 850 to 1174 Ma. One zircon with an age of 200 Ma (EGX-2-12) has initial 176Hf/177Hf ratios of 0.282750, with ϵ Hf(t) and T DM2 values of +3.61 and 1006 Ma, respectively. The Lu–Hf isotopic characteristics of the granodiorite and porphyry granite are similar to those of typical porphyry–skarn deposits in NE China. The analysed zircons plot in the field formed by Phanerozoic igneous rocks in the eastern CAOB in the plot of age vs ϵ Hf(t) (Fig. 9a, b) and between depleted mantle and young lower crust in the plot of age vs 176Hf/177Hf (Fig. 9c, d).
Hf isotopic data for zircons of intrusions from the Ergu Fe–Zn polymetallic deposit

ϵ Hf(t) vs crystallization age of zircons from granodiorite and porphyritic granite of the Ergu Fe–Zn polymetallic deposit (Vervoort et al. Reference Vervoort and Blichert-Toft1999; Yang et al. Reference Yang, Wu, Shao, Wilde, Xie and Liu2006). Luming and Xulaojiugou deposit data are from Hu et al. (Reference Hu, Ding, He, Yao, Zhu, Shen and Chen2014b), Huojihe deposit data from Hu et al. (Reference Hu, Yao, Zeng, Liu and Zhang2019), Da’anhe data (unpublished) from our team, and Cuihongshan deposit data from Chen et al. (Reference Chen, Liu, Zhang, Yang, Yang and Wu2014) and Fei et al. (Reference Fei, Zhang, Cheng, Santosh, Jin, Wen, Li and Xu2018).

5.e. Sr–Nd–Pb isotopes
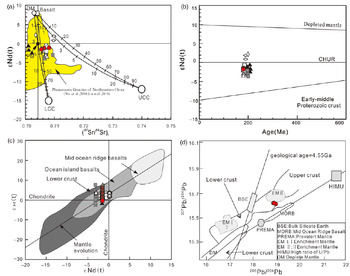
The whole-rock Sr–Nd isotopic compositions of the granodiorites are presented in Table 6 and plotted in Figure 10. The four granodiorite samples have whole-rock initial (87Sr/86Sr)i ratios from 0.7060 to 0.7090 and calculated ϵNd(t) values of −1.7 to −1.4, corresponding to depleted mantle model ages (T DM2) of 1078–1108 Ma. All these rocks have similar Sr–Nd isotopic compositions within the range of ore-related granitoids associated with typical porphyry–skarn deposits in NE China and in the CAOB reported by previous studies (Fig. 10a, b, c; Wu et al. Reference Wu, Jahn, Wilde and Sun2000, Reference Wu, Jahn, Wilde, Lo, Yui, Lin, Ge and Sun2003). The Ergu granodiorites also define a restricted range of radiogenic Pb isotopic compositions with (206Pb/204Pb)t, (207Pb/204Pb)t and (208Pb/204Pb)t values of 18.3944–18.7603, 15.5825–15.6040 and 38.1262–38.4679 (Table 6), respectively. In the 207Pb/204Pb vs 206Pb/204Pb diagram (Fig. 10d), the granodiorite samples plot within the field of the lower crust.
Sr–Nd–Pb isotopic data for granodiorites from the Ergu Fe–Zn polymetallic deposit

Sr–Nd–Pb–Hf discrimination diagrams of the Early–Middle Jurassic granitoids in the Lesser Xing’an Range skarn–porphyry deposits: (a) ϵNd(t) vs (87Sr/86Sr)i diagram (Jahn et al. Reference Jahn, Capdevila, Liu, Vernon and Badarch2004); (b) ϵNd(t) vs crystallization age of zircons diagram (Wu et al. Reference Wu, Jahn, Wilde and Sun2000); (c) plot of ϵHf(t) vs ϵNd(t) (Vervoort & Blichert-Toft Reference Vervoort and Blichert-Toft1999); (d) 208Pb/204Pb vs 206Pb/204Pb diagram (after Zartman & Doe, Reference Zartman and Doe1981). Luming and Xulaojiugou deposit data are from Hu et al. (Reference Hu, Ding, He, Yao, Zhu, Shen and Chen2014 b), Huojihe deposit data from Hu et al. (Reference Hu, Yao, Zeng, Liu and Zhang2019), Da’anhe data (unpublished) from our team, and Cuihongshan deposit data from Chen et al. (Reference Chen, Liu, Zhang, Yang, Yang and Wu2014) and Fei et al. (Reference Fei, Zhang, Cheng, Santosh, Jin, Wen, Li and Xu2018).

6. Discussion
6.a. Ages of magmatism and mineralization
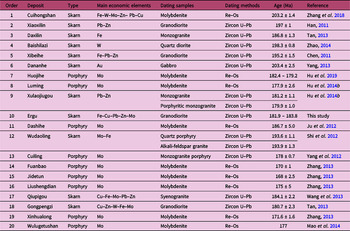
In the field of hydrothermal deposit research, it is very important to accurately define the timing of diagenesis and mineralization when discussing the genesis and metallogenic dynamic background and when providing prospecting guidance. To date, numerous studies have collected geochronological data on hydrothermal deposits in the Lesser Xing’an Range, and it is widely believed that the porphyry and skarn deposits formed in the Early–Middle Jurassic, especially within the range 175–186.8 Ma (Fig. 11; Table 7), indicating that the large-scale skarn and porphyry deposits in the study area formed in the Early Jurassic (Sun et al. Reference Sun, Wu and Gao2004; Wu et al. Reference Wu, Sun, Ge, Zhang, Grant, Wilde and Jahn2011; Xu et al. Reference Xu, Xu, Wang, Gao and Yu2013).
Compilation of age data of diagenesis and skarn–porphyry deposit mineralization age in the LXZR. The LXZR granites are from Han et al. (Reference Han, Sun, Liu, Ren, Wang, Zhang, He, Yu and Lu2019). Sketch modified after Han et al. (Reference Han, Sun, Liu, Ren, Wang, Zhang, He, Yu and Lu2019). Published data are from Table 7.

Geochronological data for the Early–Middle Jurassic porphyry and skarn deposits from the Lesser Xing’an Range

As described above, the zircon grains analysed in this study are euhedral–subhedral and exhibit oscillatory growth zoning (Fig. 5) and high Th/U ratios, indicating a magmatic origin and suggesting that the zircon U–Pb ages represent the crystallization ages of their host rocks. Our new age data for the medium-grained granodiorites and porphyritic granites are 181.9–183.8 Ma and 182.7 Ma, respectively. These ages are consistent with the geochronological characteristics of Early Jurassic magmatism in the Lesser Xing’an Range. Moreover, Ouyang & Che (Reference Ouyang and Che2016) found that the 40Ar–39Ar age of phlogopite in the altered rock of the Ergu deposit is 181.0 ± 4.2 Ma. These findings, combined with field geological observations, confirm not only that the magmatism related to the mineralization was granodioritic magma but also that the diagenesis and mineralization age of the Ergu deposit is in accordance with those of the regional large-scale skarn deposits and porphyry deposits that formed in the Early Jurassic.
6.b. Petrogenesis
6.b.1. Rock types and differentiation characteristics
Evaluating the genetic type of granitoids is significant for revealing the magma source region, magmatic process, deep geodynamic process and their constraints on mineralization (Pearce et al. Reference Pearce, Harris and Tindle1984; Sylvester, Reference Sylvester1998; Barbarin, Reference Barbarin1999). Since Chappell & White (Reference Chappell and White1974) proposed dividing granites into S-type and I-type granites according to their sources, it has been generally accepted that the granites can be divided into four types: A-type, I-type, S-type and M-type, according to the nature of their protoliths (Pitcher, Reference Pitcher1997).
The petrographic characteristics of the granodiorite in the Ergu deposit show that the granodiorite and porphyritic granite do not contain the special Al-rich minerals (Chappell, Reference Chappell1999) (such as muscovite and cordierite) present in S-type granite and do not contain the alkali mafic minerals (such as riebeckite, sodic pyroxene and annite) present in A-type granite. The granodiorite and porphyritic granite are metaluminous with A/CNK values ranging from 0.86 to 1.10 and are distinguishable from the typical S-type granites which possess strongly peraluminous affinity with A/CNK values much higher than 1.1 (Chappell & White, Reference Chappell and White2001). Moreover, in the plot of A/CNK vs A/NK (Fig. 8d), most samples plot within the area of the I-type granite area instead of the S-type granite area. Moreover, the decreasing P2O5 concentration with increasing SiO2 concentration in the Ergu samples (Fig. 12a) indicates that the Ergu intrusions are I-type granite. Chappell & White (Reference Chappell and White1992) pointed out that Th concentrations reveal a positive correlation with Rb in I-type granites and opposition in S-type granites. Therefore, the Th/Rb value can be used to distinguish S-type granite from I-type granite. Th concentrations increase with increasing Rb contents in Ergu intrusions (Fig. 12b), which can also exclude the characteristics of S-type granites. This conclusion is also supported by the FeOt/Mg ratios (1.90–7.27) and MgO contents (0.29–2.98 %) of these intrusions. In contrast, typical A-type granites generally contain higher FeOt/Mg ratios (10.87–64.00; Sun et al. Reference Sun, Wu and Gao2004) and lower MgO contents (MgO wt % < 0.1 %; Whalen et al. Reference Whalen, Currie and Chappell1987). Additionally, it is noteworthy that the 10 000 × Ga/Al values (0.95–2.68; mean of 2.38) of these granodiorites and porphyritic granite are below those of typical A-type granites (Whalen et al. Reference Whalen, Currie and Chappell1987), further confirming their I-type affinity (Fig. 12c–f).
(a) SiO2 vs P2O5 plot. Trends of the I- and S-type granites are from Chappell & White (Reference Chappell and White1992). (b) Th vs Rb plot. Trends of the I- and S-type granites are from Chappell & White, Reference Chappell and White1992. (c)–(f) Discrimination diagrams of K2O + Na2O vs 10 000 Ga/Al, TFeO/MgO vs 10 000 Ga/Al, Ce vs 10 000 Ga/Al, Y vs 10 000 Ga/Al (Whalen et al. Reference Whalen, Currie and Chappell1987).

Although the granodiorite and porphyry granite are I-type granite, they have different major and trace element characteristics, which indicates that they have undergone different degrees of fractional crystallization. In terms of the FeOt/Mg ratio, the granodiorite exhibits values less than 4, corresponding to the ratio range of weakly differentiated granite, but the porphyritic granite exhibits values mostly greater than 4 and less than 16, corresponding to the range of differentiated granite (Whalen et al. Reference Whalen, Currie and Chappell1987). In Figure 12d, the granodiorite and porphyritic granite samples plot within the undifferentiated and differentiated granite areas, respectively. Combined with the differentiation index calculation, the granodiorite (DI = 60.93–71.86) in the Ergu mining area can be considered a moderately differentiated granite, while porphyritic granite (DI = 89.93–91.80) can be considered highly differentiated granite. Therefore, we believe that the granodiorite in the study area is a moderately differentiated high-K calc-alkaline I-type granite and that the porphyry granite is a highly differentiated high-K calc-alkaline I-type granite.
6.b.2. Petrogenesis
As described above, the intrusive rocks in the Ergu mining area are high-K calc-alkaline I-type granitoids. There are three possible interpretations for the generation of intermediate to felsic high-K calc-alkaline granitoids: (a) partial melting of ancient or juvenile basaltic lower crust (Hou et al. Reference Hou, Zheng, Yang, Rui, Zhao, Jiang and Sun2013); (b) fractional crystallization of mantle-derived basic magma or magma crystallization formed by mixing with acidic magma (Soesoo, Reference Soesoo2000; Fowler et al. Reference Fowler, Kocks, Darbyshire and Greenwood2008); and (c) partial melting of a subducted oceanic slab (Martin et al. Reference Martin, Smithies, Rapp, Moyen and Champion2005).
According to current research, in the Ergu metallogenic system and the Lesser Xing’an–Zhangguangcai Range (LXZR), the intrusions in this period (182–186 Ma) are mainly granodiorite and monzogranite, with a small amount of contemporaneous mafic rocks (gabbro and diorite) (accounting for less than 5 %) (Yu et al. Reference Yu, Wang, Xu, Gao and Pei2012; Han et al. Reference Han, Sun, Liu, Ren, Wang, Zhang, He, Yu and Lu2019). Consequently, it is clearly impossible to explain how such a large-scale granite is derived from the fractional crystallization of basic magma. The granodiorite and porphyry granite have relatively homogeneous Hf isotopic compositions, and the hornblende composition in granodiorite is relatively homogeneous; all of them are magnesio-hornblende. Thus, the mixing of a basic magma and an acidic magma during magma ascent can be ruled out. We also excluded the possibility of magma mixing because of no associated field and petrological evidence including mafic enclaves, basic plagioclase and quenching acicular apatite.
Experimental petrology has shown that high-K calc-alkaline I-type granitoids are generally produced by the partial melting of hydrous calc-alkaline to high-K calc-alkaline, basaltic to intermediate metamorphic rocks within the crust (Patiño Douce & Harris, Reference Patiño Douce and Harris1998). The samples of granodiorite and porphyritic granite in the Ergu mining area have high SiO2 (62.02–73.94 %) and total alkali (Na2O + K2O = 6.50–9.11 %) contents and low Mg# values (19.84–48.03), indicating that their initial magma was generated by partial melting of the lower crust or by a silica melt that experienced multistage evolution (Barbarin, Reference Barbarin1999). In terms of trace element composition, the granodiorites and porphyritic granites show negative Nb, Ta, P and Ti anomalies, positive Rb, Th and K anomalies and enrichment of LILEs and LREEs (Fig. 8e, f), which are similar to patterns of crust-derived rocks. This similarity is supported by the ratios of certain trace elements, such as Rb/Sr = 0.05–2.59, La/Nb = 1.33–9.05 and Th/Nb = 0.82–3.17 (Saunders et al. Reference Saunders, Norry and Tarney1988). As we can see from Figure 9 and Table 5, zircon Hf isotopic data from the granodiorite and porphyritic granite are similar to the Hf isotopic compositions of the Phanerozoic igneous rocks in the CAOB, which suggests that the primary magmas originated from the partial melting of lower crust that formed during the Mesoproterozoic to Neoproterozoic (Han et al. Reference Han, Sun, Liu, Ren, Wang, Zhang, He, Yu and Lu2019). The granodiorite closely related to the mineralization of the Ergu deposit features moderate initial 87Sr/86Sr values (0.70599 to 0.70897), weak negative ϵNd(t) anomalies (−1.7 to −1.4) and relatively young model ages (T DM1, Nd =919–966 Ma; T DM1, Nd = 1080–1102 Ma), which are similar to those of typical skarn–porphyry deposits in the Lesser Xing’an Range ((87Sr/86Sr)i = 0.70071–0.70962, ϵNd(t) = −4.9 to +0.8, and T DM2, Nd = 812–1615 Ma; Fig. 10a, b). Moreover, in the plot of ϵ Hf(t) vs ϵNd(t) (Fig. 10c), all the analysis points plot within the area of oceanic island basalt and lower crust, signifying that the granodiorite was probably formed by partial melting of lower crust. These results are also supported by the Pb isotopic compositions: in the plot of 207Pb/204Pb vs 206Pb/204Pb (Fig. 10d), all samples plot within the lower crust region. It is worth noting that the Sr–Nd isotope and Hf isotope data of the Ergu deposit display weak decoupling, which is similar to that of Early Jurassic intrusive rocks in the Lesser Xing’an Range area (Fig. 10). Wu et al. (Reference Wu, Jahn, Wilde and Sun2000) pointed out that there is a kind of granite in NE China that was emplaced within the Precambrian basement and shows negative ϵNd(t) values (0 to −8) and high initial 87Sr/86Sr ratios. Wang et al. (Reference Wang, Xu, Gao, Zhang, Pei, Zhao and Yang2014) discovered the remnant ancient basement material within the Songnen–Zhangguangcai Range Massif. In addition, Fei et al. (Reference Fei, Zhang, Cheng, Santosh, Jin, Wen, Li and Xu2018) believed that in the Early Jurassic, there was a metallogenic event in the Lesser Xing’an Range area, which related to Early Jurassic granite that originated from mixed sources including juvenile and Precambrian crustal materials. Therefore, we think that the intrusive rocks in the Ergu mining area were possibly generated by partial melting of crustal materials from mixed sources containing varying degrees of juvenile and Precambrian crustal materials.
Compared with granodiorite, the porphyry granite lacks Sr–Nd–Pb isotopic data, but the silicon content of porphyritic granite is obviously higher, the contents of Ba, Sr, Nb, P and Ti are obviously lower and the Eu anomaly is more obvious, which indicates that the degree of evolution of the latter is higher. Combined with the same crystallization age and similar Hf isotopic characteristics, it is very likely that the porphyry granite and granodiorite formed by comagmatic evolution controlled by different degrees of fractional crystallization. Furthermore, Han et al. (Reference Han, Sun, Liu, Ren, Wang, Zhang, He, Yu and Lu2019) described many intermediate-acid intrusions with genetic relationships in the LXZR, and these intrusions were controlled by fractional crystallization and successively emplaced at different stages during magma evolution. Therefore, it is reasonable to conclude that the granodiorite magma in the Ergu mining area differentiated and evolved into the porphyry granite. Notable depletion of Eu concentrations (Fig. 8e) is considered to be associated with fractionation of plagioclase or K-feldspar (Hanson, Reference Hanson1978). The Rb/Sr ratios of the Ergu intrusion samples decrease with increasing Sr concentration (Fig. 13a), which may be closely related to K-feldspar differentiation or to the crystallization differentiation of plagioclase and biotite (Hanson, Reference Hanson1978). Biotite fractionation will induce a negative correlation between Sc/Yb and SiO2/Al2O3 (Liao et al. Reference Liao, Sun, Huan-Zhao Chi, Jia, Ze-Yu Nan and Wen-Na Zhou2019); the negative correlation between Sc/Yb and SiO2/Al2O3 in these granites indicates that biotite is a major fractionation mineral there (Fig. 13b). Hornblende fractionation will induce a negative correlation between Dy/Sm and Zr/Sm (Sisson, Reference Sisson1994). There is no obvious linear relationship between these two parameters in these granodiorite and porphyry granite samples (Fig. 13c), excluding hornblende as a major fractionation phase. The depletion of HFSEs (such as Nb, Ta, Ti, Zr) and P in the Ergu intrusive rocks indicates that Ti-bearing minerals (such as ilmenite and sphene) and apatite are crystallized during magmatic differentiation, which is consistent with the result obtained in the diagram of La vs (La/Yb)N (Fig. 13d).
(a) Rb/Sr vs Sr plot. (b) Sc/Yb vs SiO2/Al2O3, (c) Dy/Sm vs Zr/Sm and (d) (La/Yb)N vs La (after Liao et al. Reference Liao, Sun, Huan-Zhao Chi, Jia, Ze-Yu Nan and Wen-Na Zhou2019) diagrams. Pl = plagioclase; Kfs = K-feldspar; Bt = biotite; Hbl = hornblende; Zr = zircon; Sph = titanite; Ap = apatite; Mon = monazite; Allan = allanite.

Therefore, the porphyry granite and granodiorite in the Ergu mining area shared the same initial magma originating from the partial melting of crustal materials from mixed sources containing varying degrees of juvenile and Precambrian crustal materials. The porphyritic granite was probably derived from the fractional crystallization of granodiorite magma, with a subsequently extensive fractional crystallization of plagioclase, K-feldspar, biotite, apatite, Ti-bearing phases, ilmenite and sphene before the final emplacement.
6.c. Tectonic setting
The Lesser Xing’an Range, located in the eastern segment of the CAOB, underwent the evolution and final closure of the Palaeo-Asian Ocean and the amalgamation of multiple microcontinental massifs in the Palaeozoic, during which it was characterized by a large island arc system and continental margin accretion (Ren et al. Reference Ren, Niu and Liu1999). The available data show that during the Late Permian to Early Triassic, with the final closure of the Palaeo-Asian Ocean, the North China Craton collided with the Songnen block along the Xilamulun–Changchun–Yanji line in NE China (Xiao et al. Reference Xiao, Windley, Hao and Zhai2003; Sun et al. Reference Sun, Wu and Gao2004; Wu et al. Reference Wu, Yang, Lo, Wilde, Sun and Jahn2007). In the Mesozoic–Cenozoic, the study area became part of the evolution of the Circum-Pacific and Mongol–Okhotsk Ocean tectonic systems (Tomurtogoo et al. Reference Tomurtogoo, Windley, Kroner, Badarch and Liu2005; Sun et al. Reference Sun, Zhang, Han, Men, Li, Chai and Yang2013).
For the whole of NE China, Shu et al. (Reference Shu, Chang, Lai, Zhou, Sun and Yan2016) indicated that magmatic–hydrothermal deposit (porphyry, skarn and epithermal deposits) formation had a younging trend towards the northwest from 200 to 140 Ma and this trend is consistent with the time–space trends of intrusive and extrusive igneous rocks. It was interpreted that the early Yanshanian period reflected advancing Palaeo-Pacific subduction. In addition, the Early Jurassic ophiolitic melange has been recognized along the Asian continental margin (Zhou et al. Reference Zhou, Wilde, Zhang, Zhao, Zheng, Wang and Zhang2009) and geophysical data have identified a residual of the previous subducted slab at a depth of 660 km beneath eastern China (Van der Voo et al. Reference Van der Voo, Spakman and Bijwaard1999), suggesting that the Mesozoic magmatism in the Lesser Xing’an Range is related to subduction of the Palaeo-Pacific Plate. Han et al. (Reference Han, Sun, Liu, Ren, Wang, Zhang, He, Yu and Lu2019) summarized the geochemical characteristics of the Early–Middle Jurassic intrusive rocks in the Lesser Xing’an Range, suggesting that they were formed in an active continental margin environment related to the subduction of the Palaeo-Pacific Plate. The Ergu intrusive rocks and the Early–Middle Jurassic intrusive rocks in the Lesser Xing’an Range belong to the high-K calc alkaline series (Fig. 8c), and are characterized by enrichment of LILEs and depletion of HFSEs (Fig. 8e, f), indicating that they were formed in an active continental margin environment related to subduction. Moreover, this view is supported by the tectonic discrimination diagram, in which the granitoids in the Lesser Xing’an Range fall within the volcanic arc category or active continental margin category (Fig. 14). Consequently, we consider that the Early–Middle Jurassic (201–163 Ma) magmatic events in the Lesser Xing’an Range took place in an active continental margin setting related to the subduction of the Palaeo-Pacific Plate beneath the Eurasian continent.
(a) Th/Yb vs Ta/Yb plot (Pearce & Norry, Reference Pearce, Norry and Hawkesworth1983). (b) Sr/Y vs Y plot (Defant & Drummond, Reference Defant and Drummond1990). (c) Nb vs Y plot (Pearce et al. Reference Pearce, Harris and Tindle1984). (d) Rb vs Y + Nb plot (Pearce et al. Reference Pearce, Harris and Tindle1984). The shaded areas represents the Early Jurassic granite data in the Lesser Xing’an Ranfe area and are modified after Xu et al. (Reference Xu, Xu, Wang, Gao and Yu2013) and Han et al. (Reference Han, Sun, Liu, Ren, Wang, Zhang, He, Yu and Lu2019).

Therefore, we infer that the diagenesis and mineralization of the Ergu Fe–Zn polymetallic deposit took place in an active continental margin environment related to the subduction of the Palaeo-Pacific Plate beneath Eurasia.
6.d. Magmatism constraints on ore formation
For a long time, the genesis of skarn deposits has been studied in terms of the acidity and alkalinity of the magma, the wall rock properties, the emplacement depth and the oxygen fugacity. A classic concept is that the process of emplacement of hypabyssal rock or porphyry into carbonate strata is metasomatically associated. Therefore, the formation of such deposits has at least two basic conditions, namely, a hypabyssal intrusion and carbonate strata. Previous studies have shown that the intrusive rock phase is related to the precipitation of metallic elements, and the emplacement depth and oxygen fugacity define the size of the deposit (Meinert et al. Reference Meinert, Dipple, Nicolescu, Hedenquist, Thompson, Goldfarb and Richards2005; Jiang et al. Reference Jiang, Jiang, Li, Zhao and Peng2018). The study of carbonate strata closely related to mineralization in this area shows that in the Qianshan Formation, only the contents of W, Mo and Pb are relatively equal to or slightly higher than those in the crust, while the other ore-forming elements are obviously depleted (Ren, Reference Ren2017). Therefore, the strata did not have the ability to provide ore-forming materials to the economic ore bodies, and the main ore-forming materials may have been provided by the associated magmatism. What are the constraints and contributions of magmatism to mineralization? The discussion is as follows.
6.d.1. Composition of the magma
Meinert (Reference Meinert1995) systematically compiled major and trace element data for plutons related to skarn deposits worldwide and noted that the types of intrusive rocks have obvious metallogenic specificity for skarn deposits. As noted above, the granodiorites belong to the high-K calc-alkaline series, have Rb/Sr ratios of 0.85–0.81 < 1 and have high contents of ore elements (e.g. Cr = 23.17–44.86 ppm; V = 62.61–126.52 ppm; Pb = 20.40–41.80 ppm; and Sc = 6.67–16.08 ppm), suggesting that the granodiorites formed conditions favourable to the formation of skarn-type iron polymetallic deposits (Meinert et al. Reference Meinert, Dipple, Nicolescu, Hedenquist, Thompson, Goldfarb and Richards2005). In addition, Figures 8a, c, d and 15 show that the granodiorites are similar to the igneous rocks associated with typical skarn-type Fe, Cu and Zn deposits worldwide (Meinert, Reference Meinert1995). In conclusion, it is appropriate to infer that the granodiorite is suitable for the determination of metallogenic magma in skarn-type Fe–Zn polymetallic deposits.
(a) Nb vs Y and (b) V vs Ni correlation diagrams for intrusions associated with Fe and Cu mineralization at Ergu deposit. Open circles indicate the average compositions of plutons associated with skarn deposit types worldwide (Meinert Reference Meinert1995).

6.d.2. Emplacement depth of the magma
Geological and petrographic studies have revealed that the granodiorites related to mineralization in the Ergu mining area are massive and medium-grained, indicating that the magma was emplaced at a relatively large depth (>3 km) as a medium-grained plutonic intrusive rock, which is consistent with the emplacement depth calculated by amphibole composition (2.90–3.49 km; average value 3.13 km). This conception is contrary to the traditional interpretation of skarn and porphyry mineralization, and large-sized skarn iron polymetallic deposits are not easily formed under such conditions (Sillitoe, Reference Sillitoe2010). We found that the size of the deposit is affected by the depth of magma emplacement, in other words, the shallower the emplacement of the ore-related intrusive rocks, the larger the size of the deposit. Such deposits include the Daxilin skarn Fe deposit (small-sized deposit related to fine-grained biotite monzogranites, which represent deep facies (>3 km; Li et al. Reference Li, Han, Niu, Zhang, Wang, Cheng and Zheng2015), the Ergu skarn Fe–Zn deposit (medium-sized deposit with 17.31 Mt Fe at 35 % associated with moderately deep facies (3.13 km); this study) and the Cuihongshan skarn Fe-polymetallic deposit (large deposit with 68.35 Mt Fe at 48 % associated with porphyritic granite that represents shallow facies (<3 km; Fei et al. Reference Fei, Zhang, Cheng, Santosh, Jin, Wen, Li and Xu2018). This feature is similar to that of skarn-type iron polymetallic deposits in the Qiman Tage area, Qinghai Province, Eastern Kunlun Orogen, China (Zhao et al. Reference Zhao, Feng, Li, Liu, Xiao, Yu and Ma2013; Yao et al. Reference Yao, Lü, Zhao, Pang, Yu, Yang, Li, Liu and Zhao2017). Previous studies have shown that the emplacement depth of the middle magma chamber will affect the size of the deposit by affecting the volume of magma and magma exsolution fluid (Chiaradia & Caricchi, Reference Chiaradia and Caricchi2017; Chiaradia, Reference Chiaradia2020). On the other hand, the intrusion of ore-related rocks in a deeper position is not conducive to the release of CO2 generated by contact metasomatism between the intrusions and carbonate strata, thus affecting the continuous occurrence of mineralization (Ren, Reference Ren2017). Therefore, the metallogenic size of the Ergu Fe–Zn polymetallic metallogenic system is affected by the emplacement depth of the intrusion.
Although the emplacement depth limited the size of the Ergu deposit, the latest research shows that the water-rich and oxidized parent magma can extract more ore-forming materials from the source area, reduce subsolidus of silicate minerals and prolong the magmatic differentiation time, which is conducive to the formation of metal-rich magmatic hydrothermal fluid (Richards, Reference Richards2011; Sun et al. Reference Sun, Huang, Li, Hu, Zhang, Sun, Zhang, Ding, Li, Zartman and Ling2015; Chelle-Michou et al. Reference Chelle-Michou, Rottier, Caricchi and Simpson2017). Therefore, was the formation of the Ergu deposit related to a water-rich and high oxygen fugacity magma?
6.d.3. Water content and oxygen fugacity of the magma
As described above, the Ergu deposit formed in a magmatic arc environment on the active continental margin; in this environment, magma contains a certain amount of water and other components derived from the subducting plates (Hou et al. Reference Hou, Yang, Wang and Zheng2020). Recent studies have shown that the appearance of amphibole in granite indicates that the melt crystallized under relatively rich-water conditions (meltwater contents of more than 4 %) (Zhao et al. Reference Zhao, Xu and Erdmann2017). The H2O content of the melt that formed the granodiorite is estimated by the amphibole compositions to be 5.23–6.17 wt %, with an estimated error of 0.4 wt %, which is also indicative of a water-rich hydrous magma. High water content in magma can also promote the enrichment of iron, and magma with high water content is more likely to dissolve ore-bearing fluid (Cline, Reference Cline, Pierce and Bohm1995; Robb, Reference Robb2005) and volatiles under low pressure. In the early stage, the dissolution of aqueous fluid can prevent the loss of metal elements, so that a large amount of iron ore can be precipitated in the later stage (Mustard et al. Reference Mustard, Ulrich, Kamenetsky and Mernagh2006). Thus, the high water content of mineralized granodioritic magmas may have played a key role in controlling the formation of the Ergu deposit.
Oxygen fugacity plays an important role in the enrichment of Fe and Cu during magma evolution (Meinert et al. Reference Meinert, Dipple, Nicolescu, Hedenquist, Thompson, Goldfarb and Richards2005; Sillitoe, Reference Sillitoe2010; Yao et al. Reference Yao, Lü, Zhao, Pang, Yu, Yang, Li, Liu and Zhao2017). Recent studies have shown that the magma oxidation state can be determined using the trace elements in zircons (Ballard et al. Reference Ballard, Palin and Campbell2002). Calculations show that the granodioritic magma of the Ergu deposit had a high oxygen fugacity (lgfo2 = −15.51 to −7.33, average value = −11.70) with ΔFMQ = −1.55 to + 5.55 (average value = +1.82), which is close to the oxygen fugacity of the parent magma of the porphyry deposit (ΔFMQ = +2) (Sillitoe, Reference Sillitoe2010; Hou et al. Reference Hou, Yang, Wang and Zheng2020). Similar to the zircon calculation results, we estimated that the fO2 of magma using amphibole had a high oxygen fugacity (lgfo2 = −14.94 to −13.92, average value = −14.35) with ΔFMQ = +1.63 to + 1.97 (average value = +1.75), suggesting an oxidizing state during amphibole crystallization from shallow (3.13 km) magma chambers. The higher oxygen fugacity is also reflected in the mineral assemblages of quartz–magnetite–amphibole–biotite in the Ergu granodiorite (Li et al. Reference Li, Wang, Quan, Sun, Zhao and Zhang2016). Figure 7b shows that the Ergu granodiorite oxygen fugacity mainly plots between the fayalite–magnetite–quartz (FMQ) and magnetite–hematite (MH) buffers. Most of the points are concentrated between the Ni–NiO (NNO) buffer curve and the MH buffer line, which also confirms that the magma of the granodiorite had a high oxygen fugacity. Under the condition of high oxygen fugacity, S would have been present as sulphates (SO42−) (Carroll & Rutherford, Reference Carroll and Rutherford1985; Richards, Reference Richards2003), which can prevent the chalcophile elements (such as Fe, Cu and Mo) from being incorporated into silicate minerals (e.g. amphibole, biotite and plagioclase) as sulphide inclusions (Li et al. Reference Li, Zhao, Zhou, Vasconcelos, Ma, Deng, Souza, Zhao and Wu2008). In conclusion, under high oxygen fugacity conditions, these elements can be retained in the magma and hydrothermal fluid and then enriched in the fluid phase after magma crystallization, thus promoting subsequent mineralization.
As a comparison, although the crystallization age of the porphyry granite is similar to that of the granodiorite, the porphyritic structure indicates that the porphyry granite was emplaced in the shallow crust. Compared to the granodiorite, the porphyry granite has lower oxygen fugacity (lgfo2 = −20.10 to −13.57, average value is −16.07) with ΔFMQ = −4.56 to +1.78 (average value = −0.47), which might be related to the fractional crystallization of magnetite and lower Mn apatite (Sun et al. Reference Sun, Wu and Gao2004; Zhong et al. Reference Zhong, Feng, Reimar, Li and Dai2018). In the plot of lgfo2 vs T, the analysis points mainly plot within the area below the NNO buffer line, which also indicates that the porphyry granite magma has a lower oxygen fugacity during crystallization. This may be an important reason why the porphyry granite did not form mineralization.
In summary, we believe that the high water content, high oxygen fugacity and medium-deep emplacement of the granodiorite magma limited the Ergu deposit to being a medium-sized Fe–Zn polymetallic skarn deposit, while the water-rich, reduced and shallowly emplaced granitic magma was not conducive to mineralization.
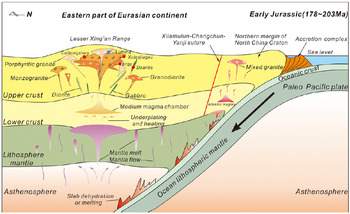
Based on the regional tectonic evolution history, newly obtained geochemical data and geochronology data, we believe that the Ergu deposit was formed in the late Early Jurassic, which corresponded to the beginning of the subduction of the Pacific Plate beneath the Eurasian continent. In this tectonic setting, upwelling of the asthenosphere and decompression of the lithosphere caused partial melting of the lower crust and subsequent formation of the primitive basaltic magma chamber. In the process of ascent, gabbro, granodiorite and granitic magma formed successively by crystallization differentiation and were successively emplaced at different stages (Han et al. Reference Han, Sun, Liu, Ren, Wang, Zhang, He, Yu and Lu2019). When the granodioritic magma was emplaced in the medium-deep position in the upper crust, widespread contact metasomatism occurred with the calcareous carbonate strata of the Qianshan Formation, forming magma fluids containing ore-forming elements such as Fe, Cu, Pb and Zn. Then, in response to reductions in temperature and pressure, crystallization of prograde skarn and retrograde skarn stages occurred. Finally, magnetite ore bodies, magnetite–sphalerite ore bodies, Cu-polymetallic ore bodies and Pb–Zn ore bodies formed in the Ergu deposit (Fig. 16).
Sketch showing the genetic model and tectonic setting for the Early Jurassic porphyry–skarn mineralization in the Lesser Xing’an Range. Modified after Han et al. (Reference Han, Sun, Liu, Ren, Wang, Zhang, He, Yu and Lu2019).

7. Conclusions
Based on the zircon U–Pb ages, element geochemistry, zircon Hf isotopic compositions and Sr–Nd–Pb isotopic compositions of the Ergu intrusions as well as regional geological observations, we arrived at the following conclusions:
-
(1) The Ergu granodiorite and porphyry granite yield U–Pb ages of 181.9 ± 1.6 to 183.8 ± 0.65 Ma and 182.7 ± 1.4 to 182.7 ± 1.8 Ma, respectively. Combined with the 40Ar–39Ar age of phlogopite (181.0 ± 4.2 Ma; Ouyang & Che, Reference Ouyang and Che2016), these ages indicate that the magmatism and mineralization of the Ergu Fe–Zn polymetallic deposit occurred during the Early Jurassic.
-
(2) The geochemical and isotopic data from the Ergu intrusions imply that they were the product of comagmatic evolution with different degrees of fractional crystallization and were possibly generated by partial melting of crustal materials from mixed sources containing varying degrees of juvenile and Precambrian crustal materials. The tectonic environment was an active continental margin related to the continuous subduction of the Palaeo-Pacific Plate beneath the Eurasian continent.
-
(3) The high water content (>4 %), high oxygen fugacity and medium-deep emplacement of the granodioritic magma were key factors in the formation of the Ergu medium-sized Fe–Zn polymetallic skarn deposit, while the water-rich (>4 %), reduced and shallowly emplaced granitic magma was not conducive to mineralization.
Acknowledgements
This work was supported by the National Key Research and Development Program of China (Grant No. 2017YFC0601306) and the Self-determined Foundation of Key Laboratory of Mineral Resources Evaluation in Northeast Asia, Ministry of Natural Resources, Changchun, China (Grant No. DBY-ZZ-19-27), as well as the Program of the China Geological Survey (Grant No. DD20190368).
Conflicts of interest
No conflict of interest exists in the submission of the manuscript. It is approved by all the authors for publication.