The Midland Valley of Scotland (MVS) is a well-known Carboniferous basin in the north of Britain. Like most Carboniferous basins in the region, its origin is situated in the context of the Devonian Rheno-Hercynian back-arc base in the south of Britain, which, during the late Devonian, a phase of north-south rifting affected central and northern Britain (Leeder Reference Leeder1982, Reference Leeder1988).
The MVS is an ENE-trending graben, flanked to the northwest by the Caledonian Highlands, and to the southeast by the Southern Uplands. The latter structure separates the MVS from another classical Carboniferous basin, the Northumberland Trough, whose southern flank, passes southwards into the well-known Alston Block, Stainmore Trough, Askrigg Block and Craven Basin (Fig. 1), whose lithostratigraphy has been studied during decades, and more recently summarised in several compilations (e.g.,Cossey et al. Reference Cossey, Adams, Purnell, Whiteley, Whyte and Wright2004; Waters et al. Reference Waters, Browne, Dean and Powell2007, Reference Waters, Somerville, Jones, Cleal, Collinson, Waters, Besly, Dean, Stephenson, Davies, Freshney, Jackson, Mitchell, Powell, Barclay, Browne, Leveridge, Long and McLean2011; Dean et al. Reference Dean, Browne, Waters and Powell2011). These latter regions are the locus for most Mississippian biostratigraphical data from Britain, as well as contributing to the main standard lithostratigraphical formations used by the British Geological Survey (BGS) (Dean et al. Reference Dean, Browne, Waters and Powell2011).
Location of the main stratigraphic sections mentioned in the text.

The traditional lithostratigraphy of the MVS is composed of myriad local names dating back to the 19th Century (see Wilson Reference Wilson1989). This lack of lithological uniformity has been analysed by numerous authors, who proposed different correlations (e.g., Neilson Reference Neilson1874, Reference Neilson1913; Geikie, Reference Geikie1902; Macnair Reference Macnair1917; Macgregor Reference Macgregor1930; Wilson Reference Wilson1966, Reference Wilson1974, Reference Wilson1979, Reference Wilson1989; Forsyth & Chisholm Reference Forsyth and Chisholm1968, Reference Forsyth and Chisholm1977; Neves & Ioannides Reference Neves and Ioannides1974; Jameson Reference Jameson, Miller, Adams and Wright1987; Owens et al. Reference Owens, McLean, Simpson, Shell and Robinson2005; Cózar et al. Reference Cózar, Somerville and Burgess2010; Dean et al. Reference Dean, Browne, Waters and Powell2011. Within the aims of the BGS to standardize the lithostratigraphy of Britain from the 1990’s, Browne et al. (Reference Browne, Dean, Hall, McAdam, Monro and Chisholm1999) summarized much of the previous knowledge on different successions and their correlations, which constituted a major advance for the lithostratigraphic framework of the MVS, although some problems still remain.
A major challenge in studying the MVS is the lack of a robust biostratigraphy, and frequently, correlations of limestone/sandstone horizons is supported by (i) the record of poorly biostratigraphically contrasted macrofauna, and (ii) the use of sequence stratigraphy and cycles defined in northern England following Ramsbottom (Reference Ramsbottom1973, Reference Ramsbottom1977). The use of event stratigraphy is based on the recognition of cyclical facies changes and associated faunal variations as the basis for the subdivision of the Carboniferous of Great Britain and Ireland and as a powerful tool to aid correlation (Waters, Reference Waters, Waters, Somerville, Jones, Cleal, Collinson, Waters, Besly, Dean, Stephenson, Davies, Freshney, Jackson, Mitchell, Powell, Barclay, Browne, Leveridge, Long and McLean2011). This cyclicity, based on glacioeustasy, has been demonstrated not to be correct for the recognition of true chronostratigraphical units correlatable for hundreds of kilometres in Britain and/or internationally (e.g., Cózar et al. Reference Cózar, Somerville and Hounslow2023). Thus, alternative quantitative biostratigraphic methods have to be used to aid correlation, methods that have been commonly used in the literature, although rarely applied to the Mississippian foraminifers (e.g., Laloux, Reference Laloux1987).
This study is focused on limestone horizons of the Lower Limestone Formation (LLF), traditionally interpreted as late Brigantian age (e.g., Browne et al. Reference Browne, Dean, Hall, McAdam, Monro and Chisholm1999), currently known to belong to the early Serpukhovian (Cózar and Somerville Reference Cózar and Somerville2021). On the other hand, the macrofauna of the MVS is rather well-known, and has been used as biostratigraphic markers for local correlations, although, usually, it is not based on fossil groups or taxa with contrasted biostratigraphic use in other regions of Britain and elsewhere. This definition of local faunal associations for each limestone or marine band, internationally, is of a low biostratigraphic importance, because it is not calibrated with other biostratigraphically relevant microfossil groups, such as conodonts, foraminifers, or palynomorphs. Thus, the point of contention is: does this macrofauna form a really well-contrasted local zonal scheme or is it simply a result of facies and ecological controls?
1. Sections and database
In order to analyse the succession in the MVS, the main source of foraminiferal data are those published in Cózar et al. (Reference Cózar, Somerville and Burgess2008, Reference Cózar, Somerville and Burgess2010) and Cózar & Somerville (Reference Cózar and Somerville2020). The material included in those publications has been revised and new thin-sections have been prepared to determine more precisely some questionable identifications previously made, as well as contribute new occurrences of taxa. In addition to the foraminifers, three algal genera have been also included, Saccamminopsis, Falsocalcifolium and Calcifolium, because in some cases, they have been used as markers in the MVS (e.g., Burgess Reference Burgess1965). Following the original Geological Survey mapping campaigns, ten composite sections have been selected: south Ayrshire (Muirkirk), Glenbuck (Douglas), north Ayrshire, south Lanarkshire, east Kilbride (Calderwood), Glasgow (Paisley), Bathgate (West Lothian), central Fife (Kirkcaldy to Kinghorn), east Fife (St Monans to Pittenweem) and east Lothian (Catcraig to Barns Ness) (Fig. 1). The database is included in the Supplementary information (Appendix A).
Foraminiferal information varies significantly from the same local limestones horizons, mostly due to dolomitization, recrystallization and siliciclastic content. In many cases, limestone horizons were sampled in two or three localities of the regions. For the compilation of the dataset, and composite sections, localities with richer foraminiferal assemblages were selected, which provide wider information.
In terms of uniformity and consistency of correlations, the MVS can be divided in two distinct areas, the western MVS (from south Ayrshire to Glasgow) and the eastern sections (Fife and East Lothian) (Figs 1–2). In a geographically intermediate position is the Bathgate section, which is distinctive for the thick sequence of volcanic rocks separating the limestone bands (Fig. 2). Unlike most other Carboniferous sections in the Midland Valley which comprise cyclothemic sequences of thin limestones and thick clastic intervals of shales, siltstones, sandstones and coal seams, the Bathgate Hills, in West Lothian, are composed primarily of volcanic rocks up to 600 m in thickness with occasional interbedded limestone units, of which the Petershill Limestone is well exposed in quarries. The volcanic rocks created a topographic high which separated subsiding basins to the west and east. A prolonged period of volcanic quiescence led to the accumulation of thick shallow-water carbonates (Jameson Reference Jameson, Miller, Adams and Wright1987). The Petershill Limestone is rather distinctive for several reasons: (i) it is one of the thickest limestone units within the Lower Limestone Formation (∼10 m thick); (ii) it represents shallow-water facies rich in solitary and colonial rugose corals; and (iii) it contains bryozoan-brachiopod-sponge-crinoid build-up facies, unique to the Midland Valley (Jameson Reference Jameson, Miller, Adams and Wright1987). This exceptional thickness of carbonates resulted from its accumulation in an isolated volcanic platform, away from the influence of clastic shorelines developed elsewhere, and biohermal build-up passing into offshore facies (Smith et al. Reference Smith, Stephenson and Monro1994).
Simplified lithostratigraphical correlation of the Midland Valley of Scotland (mostly based on Browne et al. Reference Browne, Dean, Hall, McAdam, Monro and Chisholm1999) showing the four limestone ‘levels’ (as described in the text), the main marine bands, occurrence of the Cingulizonates capistratus-Bellispores nitidus (CN) Biozone (star), and foraminiferal assemblages (sources discussed in the text). Abbreviations: low – lower; up – upper.

The base of the LLF is better constrained in the western MVS, whereas there are some possible discrepancies in the eastern sections. On the other hand, intermediate and upper levels of the LLF are difficult to correlate between these two regions, mostly due to a poor, or lack of a robust biostratigraphy in the eastern sections, and ambiguous assemblages in intermediate levels across the MVS.
2. Main Marine Bands, palynomorphs and foraminiferal biostratigraphy and correlations
2.1. Marine bands
Five main marine bands with “exclusive” macrofauna have been defined for the LLF: (oldest to youngest) the Abden Fauna (AF), the Neilson Shell Bed (NSB), the Milngavie Marine Band (MMB), the Mill Hill Marine Band (MHB) and the Seafield Marine Band (SMB) (Fig. 2).
The Milngavie Marine and Mill Hill Marine bands are the less persistent strata, and were tentatively correlated by Wilson (Reference Wilson1989) due to their similar stratigraphical position in the successions close to Glasgow and Fife, respectively. Similarly, the Seafield Marine Band is mostly restricted to Fife (Fig. 2).
Macgregor (Reference Macgregor1930) proposed the Abden Fauna for the Alum Shale described by Macnair (Reference Macnair1917). This latter author proposed numerous correlations currently admitted for the base of the LLF, although he proposed the Blackbyre Limestone as a better level of correlation than the base of the Hurlet Limestone, and thus, as the base for the Lower Limestone Group (now formation). Nevertheless, there is a much wider consensus to consider the base of the Hurlet Limestone as the base for the formation. In general, the Abden Fauna is recorded just below the base of limestones of the LLF, although in central Fife the Abden Fauna is recorded below the two oldest limestones in the region, the First Abden and Second Abden limestones (Fig. 2). Macnair (Reference Macnair1917) recognised this fauna in most parts of the MVS, except for the southwest regions (Douglas and Muirkirk, Fig. 2). Wilson (Reference Wilson1989) noted that the debris of fishes recorded by Macnair (Reference Macnair1917) below the First Abden Limestone (named as bone beds) is rather common in some other stratigraphical positions, and thus, he proposed the Second Abden Limestone as the base for the formation in this region, as well as to rename the “Abden Fauna” as “Mcnair Fauna”. The correlation of the Main, Broadstone, Upper Longcraig and Hurlet limestones is widely accepted since early studies, but their correlation with supposed lateral equivalents have been changing (depending on the author), including the Hawthorn, First Abden, Second Abden, St Monans White, St Monans Brecciated and Seafield Tower limestones. Similar small changes in the correlation of local limestones have been rather frequent (Geikie Reference Geikie1902; Macgregor Reference Macgregor1930; Forsyth & Chisholm Reference Forsyth and Chisholm1968, Reference Forsyth and Chisholm1977), even in more recent studies (Wilson Reference Wilson1989; White Reference White, Cossey, Adams, Purnell, Whiteley, White and Wright2004).
On the other hand, Wilson (Reference Wilson1966) named the other main marine band in the MVS as the Neilson Shell Band, a marine band lithologically and faunistically described by Neilson (Reference Neilson1874, Reference Neilson1913) close to Glasgow. Forsyth & Wilson (Reference Forsyth and Wilson1965) and Wilson (Reference Wilson1966) recognized the Neilson Shell Band in a much wider region of the MVS, and absent only in sections in Ayrshire and Fife. Subsequently, this band has been recognized in other regions, above the Dockra, Upper and Middle Skateraw limestones (Wilson Reference Wilson1974, Reference Wilson1979), and currently, the band is considered to be present in the entire MVS, except for Muirkirk and Douglas, coinciding with the areas where the Abden Fauna is also not recorded (Fig. 2).
These marine bands have been used as markers for the correlation of limestone beds in the MVS, although their definitions based on the exclusivity of macrofauna species of low/absent worldwide biostratigraphic relevance, as well as a complete lack of calibration with other fossil groups used in most common zonal schemes, have not been contrasted.
2.2. Palynomorphs
Apart from the above-mentioned macrofaunal bands, the MVS is traditionally known for the improvements in the palynomorphs zonal scheme, although these studies have been mostly focused in East Lothian and along the Fife coast (e.g., Neves & Ioannides Reference Neves and Ioannides1974; Neves et al. Reference Neves, Gueinn, Clayton, Ioannides, Neville and Kruszewska1973; McLean et al. Reference McLean, Owens, Neves, Collinson, Evans, Holliday and Jones2005). Previously, it was considered that the entire LLF was represented by a single palynomorph biozone, the Tripartites vetustus-Rotaspora fracta (VF) Biozone, whose base is recorded from levels below the base of the LLF (e.g., Neves et al. Reference Neves, Gueinn, Clayton, Ioannides, Neville and Kruszewska1973, text-figs. 5, 8, 9, 15). However, more recently, work in Britain (Owens et al. Reference Owens, McLean, Simpson, Shell and Robinson2005) has redefined the first occurrence of markers for the overlying Cingulizonates capistratus-Bellispores nitidus (CN) Biozone, previously proposed for Pendleian rocks, and currently redefined from the Five Yard Limestone in lower levels of the late Brigantian in northern England. Markers of this CN biozone were recorded by Neves et al. (Reference Neves, Gueinn, Clayton, Ioannides, Neville and Kruszewska1973) and Owen et al. (Reference Owens, McLean, Simpson, Shell and Robinson2005) above the Second Abden, St Monans Little and Upper Skateraw limestones (Fig. 2). These records allowed Owens et al. (Reference Owens, McLean, Simpson, Shell and Robinson2005) to confirm the correlation between the Second Abden and St Monans Little limestones (Fig. 2).
Certainly, the palynomorphs of the lower part of the succession in the MVS (mostly composed of shales) are more useful than for the middle parts of the LLF, with scarce resolution for the number of local names and potential levels of correlation.
2.3. Foraminifers
Foraminifers in the LLF are abundant in some limestone beds and outcrops, although dolomitization and excess of siliciclastics explain their absence in many others (e.g., Cózar et al. Reference Cózar, Somerville and Burgess2010). Thus, it can be considered that, in general, foraminiferal assemblages of the MVS are poor, and much scarcer than those in northern England. It can be highlighted that the diversity is approximately half that in the Pennines and the Solway-Northumberland Basin, and if diversity is compared section by section, the individual diversity of sections in the MVS is even much lower.
It is rather questionable if this low diversity recorded in many sections is a matter of poor preservation, or a low amount of sampling and sectioning, or if it could correspond perhaps to real palaeoecological and palaeobiogeographical constraints. Individual limestone horizons may or may not contain representative foraminiferal assemblages, as well as their assumed lateral equivalents.
Foraminiferal data, as mentioned above, are based mostly on Cózar et al. (Reference Cózar, Somerville and Burgess2008, Reference Cózar, Somerville and Burgess2010) and Cózar & Somerville (Reference Cózar and Somerville2020), with some biostratigraphic modifications published by Cózar & Somerville (Reference Cózar and Somerville2021). More details of the foraminiferal assemblages, as well as illustrations of the most important taxa can be found in those publications, and data included in Appendix A.
2.3.1. Limestones generally assigned to the “Hurlet level” and immediately below
The Productus Limestone (south Ayrshire) contains mostly typical early Brigantian foraminifers. However, it is highlighted by the first occurrences of “Millerella” tortula and Endothyranopsis sphaerica. Although both taxa are rarely recorded from Assemblage 6 (upper) in northern England (Cózar & Somerville Reference Cózar and Somerville2021), their co-occurrence suggests that the limestone horizon should be assigned to Assemblage 7 (lower) (Fig. 2), where they are found to be more abundant.
The Broadstone Limestone (north Ayrshire) presents a similar scenario to the previous limestone horizon, where some taxa which are rarely recorded from Assemblage 6 (upper), such as Asteroarchaediscus baschkiricus, Endothyranopsis sphaerica and Praeostaffellina sp. nov. (cf. Cózar & Somerville Reference Cózar and Somerville2016), but these forms co-occur together with Climacammina, Eostaffella mirifica, Howchinia subplana, Neoarchaediscus postrugosus, Tubispirodiscus cornuspiroides and T. attenuatus, are typical markers of Assemblage 7 (lower) (Fig. 2).
The Main Limestone (Glenbuck, south Lanarkshire and east Kilbride) contains the most important markers: Asteroarchaediscus baschkiricus, Climacammina, Endothyranopsis sphaerica and Tubispirodiscus attenuatus, which are typical of Assemblage 7 (lower). However, depending on the outcrops, the suite of foraminifers recorded in each section is not as complete. Assemblage 7 (lower) in south Lanarkshire is well contrasted by common Climacammina and Endothyranopsis sphaerica, and in Calderwood (east Kilbride) by Asteroarchaediscus baschkiricus, Endothyranopsis sphaerica and Tubispirodiscus attenuatus. However, in Glenbuck, the Main Limestone only contains Endothyranopsis sphaerica as a marker, which could belong to either Assemblage 6 (upper) or 7 (lower). In addition, the unnamed thin limestone lying closely below the base of the Main Limestone contains Praeostaffellina sp. nov., which although in the Pennines is typical of Assemblage 7 (upper), but in the Northumberland Trough the taxon is recorded from Assemblage 6 (upper) (Cózar & Somerville Reference Cózar and Somerville2020, Reference Cózar and Somerville2021).
The Hurlet Limestone in Paisley contains the following markers: Endothyranopsis sphaerica, Parabradyina pararotula and Praeostaffellina sp. nov. The stratigraphic range of P. pararotula is poorly known, although in Ireland, it is associated with rocks included in the late Brigantian (e.g., Cózar et al. Reference Cózar, Somerville and Somerville2005). However, Climacammina, Planospirodiscus and the alga Archaeolithophyllum lamellosum are recorded in the Hurlet Limestone at the Bridge of Weir, and Asteroarchaediscus baschkiricus at the Nethercraigs Quarry. The entire association, as a whole, is typical of Assemblage 7 (lower) (Fig. 2).
The Inchinnan Limestone (Douglas, south Lanarkshire and Glasgow) and Craigenhill Limestone (east Kilbride) contain poor assemblages, but Endothyranopsis sphaerica and Tubispirodiscus cornuspiroides are recorded, which suggest a continuation of Assemblage 7 (lower) recorded in the underlying limestones (Fig. 2). The Wee Post Limestone does not contain any significant biostratigraphic markers.
The West Kirkton Limestone (Bathgate) contains as the most important taxa: Neoarchaediscus postrugosus and N. gregorii, which allow us to assign the level to Assemblage 7 (lower).
In the eastern sections, such as Kirkcaldy (central Fife), Asteroarchaediscus baschkiricus, common Neoarchaediscus (including N. gregorii), Planospirodiscus minimus and primitive Tubispirodiscus sp. are recorded in the First Abden Limestone. These markers correspond to Assemblage 6 (upper), and unquestionable markers of Assemblage 7 (lower) are not recorded (Fig. 2). The Second Abden Limestone contains Asteroarchaediscus (A. baschkiricus and A. rugosus), Neoarchaediscus postrugosus, N. gregorii and Janischewskina typica. Owing to the occurrence of the latter taxon, this limestone corresponds to Assemblage 7 (upper). This association of the Second Abden Limestone questions the assignment of the First Abden Limestone to Assemblage 6 (upper). Nevertheless, the first occurrence of J. typica from the uppermost levels questionably assigned to Assemblage 7 (lower) in south Askrigg (unpublished), raises the question, since both Assemblage 7 (lower) and 7 (upper) can be certainly distinguished across Britain, should they not be considered as a single biozone? If we admit that both are a single biozone, the First Abden Limestone might be certainly Assemblage 6 (upper), as suggested by the foraminifers, which would confirm the opinion of Wilson (Reference Wilson1989), that the Abden Fauna below the First Abden Limestone is not the true Abden Fauna, and thus, the base of the LLF should be located in the Second Abden Limestone. There is insufficient foraminiferal data to decide if the base of the LLF should be located at the base of the First Abden or Second Abden limestones.
The most significant taxa in the St Monans White Limestone (east Fife) are Asteroarchaediscus baschkiricus and common Neoarchaediscus, which can be assigned to Assemblage 6 (upper) (Fig. 2). The succeeding St Monans Brecciated Limestone contains, in addition to the previous taxa, the first record of Biseriella parva, a marker of Assemblage 7 (lower). This is in agreement with considering the St Monans Brecciated Limestone as the base of the LLF. The younger St Monans Little Limestone records the occurrence of Endothyranopsis sphaerica, which does not contribute too much biostratigraphic significance, and thus, can also be assigned to Assemblage 7 (lower).
In East Lothian, limestones below the Middle Longcraig Limestone are too poor, and do not contain any representative suite of foraminifers. Foraminifers recorded by us from the Middle Longcraig Limestone are also poorly representative, but Karbub (Reference Karbub1993) recorded Neoarchaediscus gregorii and Asteroarchaediscus, which suggests Assemblage 6 (upper).
The Upper Longcraig Limestone contains a typical Assemblage 7 (lower), including markers such as Biseriella parva, Climacammina, Endothyranopsis sphaerica, common Asteroarchaediscus, “Millerella” tortula, Parabradyina pararotula, Praeostaffellina sp. nov., and Howchinia acutiformis. The succeeding Lower Skateraw Limestone contains a similar association (see Cózar & Somerville Reference Cózar and Somerville2020), and in addition, Janischewskina typica, which might suggest Assemblage 7 (upper).
2.3.2. Limestones generally assigned to the “Blackhall level”
The Hawthorn Limestone (south Ayrshire, Douglas and south Lanarkshire) is rich in taxa from the underlying Assemblage 7, but it also contains new markers, such as the Miliolata Ammovertella inversa (south Lanarkshire), rare Archaediscus at tenuis stage (south Lanarkshire), Tubispirodiscus simplissimus (south Lanarkshire), Biseriella paramoderata/Biseriella scotica (south Ayrshire and Douglas) and Trepeilopsis minima (south Ayrshire). In addition, representatives of the Eostaffella postmosquensis and E. pseudostruvei groups are recorded in other geological sections exposing this limestone. These foraminifers enable us to assign the Hawthorn Limestone to Assemblage 8.
The Dockra Limestone (north Ayrshire) contains as the main markers Biseriella scotica and B. paramoderata, which taken into account its distribution in the Hawthorn Limestone, seem to be useful local markers for Assemblage 8. In other outcrops, the Miliolata Calcivertella and Calcitornella are recorded (Cózar et al. Reference Cózar, Somerville and Burgess2010), which confirm the overall Assemblage 8 for this limestone.
The Blackhall Limestone (east Kilbride and Glasgow) was assigned to Assemblage 8 by Cózar et al. (Reference Cózar, Somerville and Burgess2010) based mainly on the occurrence of peaks of the alga Calcifolium okense, which first occurs from Assemblage 7, but it is only abundant in Assemblages 8 to 10. However, foraminifers are only representative of Assemblage 7 (upper), and surprisingly, peaks of Calcifolium have not been recorded in the Hawthorn nor in the Dockra limestones. Thus, the biostratigraphy of this limestone remains questionable (Fig. 2).
As mentioned by Cózar & Somerville (Reference Cózar and Somerville2020), the Seafield Tower and Charlestown Main limestones in Fife only contain markers of Assemblage 7. In the case of the Seafield Tower Limestone, it might be assumed to be Assemblage 7 (upper), because this assemblage is recorded from the older Second Abden Limestone, but the Charlestown Main Limestone might be assigned to the Assemblage 7 (lower), as designated for the underlying St Monans Little and St Monans Brecciated limestone horizons (Fig. 2).
The Middle Skateraw Limestone in East Lothian, contains rich assemblages, highlighted by the occurrence of Cepekia cepeki, which first occurs from Assemblage 8 (Fig. 2). Neoarchaediscus shugorensis described by Cózar & Somerville (Reference Cózar and Somerville2020), another marker of Assemblage 8, is not confirmed herein, and it is reidentified as Neoarchaediscus bykovensis (a species with less evolute final whorls), whose stratigraphic range is poorly known in Britain. In the Upper Skateraw Limestone, Eolasiodiscus donbassicus, a very rare taxon, is the only new first occurrence which, to date, has not been recorded below Assemblage 8 in Britain (Cózar & Somerville Reference Cózar and Somerville2021).
The youngest limestones in these eastern sections are very poor in foraminifers, and generally, only contain unrepresentative assemblages. Only in East Lothian, does the occurrence of Biseriella paramoderata and B. scotica (in Chapel Point Limestone) and Calcivertella (Dry Burn Limestone) suggest that those horizons should be assigned to Assemblage ≥8 (Fig. 2). As mentioned above, sampling in the Kinniny limestones (lower, mid and upper) and Barns Ness Limestone did not yield any significant foraminifers (Fig. 2).
2.3.3. Limestones generally assigned to the “Main/Mid Hosie level”
The Main Hosie Limestone (north Ayrshire, south Lanarkshire, east Kilbride and Glasgow) contains rather poor assemblages, usually representative only of a late Brigantian age, but in north Ayrshire Tubispirodiscus simplissimus was recorded. This taxon was considered as local marker of Assemblage 9 by Cózar et al. (Reference Cózar, Somerville and Burgess2010), but the new records from the Hawthorn Limestone (in south Lanarkshire; see Appendix A), allow us to amend this position to an Assemblage 8, as recorded in other successions in northern England.
The Mid Hosie Limestone is the most widely distributed limestone in the west and southwest of the MVS (Fig. 2). Like the Main Hosie Limestone, the Mid Hosie Limestone usually contains poor foraminiferal assemblages, and in most cases, are unrepresentative of its assumed stratigraphic position. The most important taxa recorded are Tubispirodiscus simplissimus and T. hosiensis in north Ayrshire. The latter taxon is the only species which enables us to consider an Assemblage 9 for this limestone, whereas the other outcrops of the limestone does not enable to confirm the assigned biostratigraphy.
Limestone A (Glenbuck) is considered also as a lateral equivalent of the Mid Hosie Limestone (Fig. 2), and it contains similar poor assemblages, of which, the most evolved taxon is Tubispirodiscus simplissimus (≥ Assemblage 8).
The Petershill Limestone (Bathgate), in contrast, contains rich foraminiferal assemblages including numerous Asteroarchaediscus, Calcitornella, Biseriella, Endothyranopsis sphaerica, Eostaffella postmosquensis group, Janischewskina, Parajanischewskina and also, Eostaffella acutiformis. This latter taxon was considered as a marker of Assemblage 9.
2.3.4. Limestones generally assigned to the “Second/Top Hosie level”
The MacDonald Limestone (south Ayrshire and Glenbuck) contains common Eostaffella postmosquensis and E. pseudostruvei groups, Archaediscus at tenuis stage, Tubispirodiscus and Euxinita pendleiensis, as well as the first occurrence of Eostaffella mutabilis and Eostaffellina paraprotvae (see full association in Appendix A). Most of the taxa are typically recorded from Assemblages 8 and 9, but E. paraprotvae is a marker of Assemblage 10 (Fig. 2).
The Anvil Limestone (east Kilbride) contains, as more important taxa, common Archaediscus at tenuis stage, common calcivertellids, Endothyranopsis plana, Eostaffella angusta, E. mutabilis, E. acutiformis, E. postmosquensis group, common Euxinita pendleiensis, common Cepekia cepeki, and common Tubispirodiscus. The assemblage is rather similar to that in the MacDonald Limestone, and in this case, the occurrence of E. plana is also a marker of Assemblage 10. The overlying Cement Limestone does not contain foraminifers (Fig. 2).
The Second Hosie Limestone in north Ayrshire (Fig. 2) contains common Archaediscus at tenuis stage, calcivertellids, Eostaffella postmosquensis group, E. mutabilis, Eostaffellina paraprotvae and common Tubispirodiscus (including the first occurrences of T. swanni and T. absimilis). This suite of foraminifers is assigned to Assemblage 10. On the other hand, this limestone in south Lanarkshire is poor in foraminifers and are unrepresentative.
The Top Hosie Limestone has been only sampled in north Ayrshire, and shows similar assemblages to those recorded from the Second Hosie Limestone (slightly poorer). Neoarchaediscus shugorensis is confirmed in this section, a taxon which first occurs from Assemblage 8, but is much more common in younger assemblages. Nevertheless, the same Assemblage 10 is assigned to the Top Hosie Limestone due to its similar composition to the Second Hosie Limestone.
The Wardlaw Limestone (Bathgate) (Fig. 2) contains a typical assemblage of the late Brigantian (≥ Assemblage 8), including Asteroarchaediscus and Eostaffella postmosquensis group. However, it is highlighted by the first occurrence of Millerella variabilis. The genus Millerella s.s. has been only recorded from Assemblage 10 in northern England.
In summary, the position of some limestone beds is questioned in some parts of the MVS, such as the base of the LLF in central Fife, the position of the Petershill Limestone, the position of most of the upper limestones in eastern MVS, and the correlation of the Blackhall Limestone with other limestones supposedly lateral equivalents.
3. Results of the quantitative biostratigraphical methods
In order to solve these discrepancies, as well as the lack of many taxa, three methods of biostratigraphic correlation and seriation have been used: Ranking and Scaling (RASC), Unitary Associations (UA’s) and Constrained Optimization (CONOP). These methodologies are briefly summarized below.
3.1. Ranking and scaling (RASC)
This method was described by Gradstein et al. (Reference Gradstein, Agterberg, Brower and Schwarzacher1985) and in numerous publications later (see historical review in Agterberg et al. Reference Agterberg, Gradstein, Cheng and Liu2013, where the software is available). Since the method is probabilistic, the general database including all the recorded taxa in the MVS have been used. The Mississippian foraminifers are excellent biostratigraphic markers, nearly exclusively, utilizing their first occurrences, since they can be long-ranging taxa, and generally extend for several biozones or more. In fact, many of the taxa recorded in the LLF of the MVS are well-known from the middle Visean elsewhere (and in some cases even from the late Tournaisian; e.g., compare stratigraphic ranges in Conil et al. Reference Conil, Longerstaey and Ramsbottom1980; Poty et al. Reference Poty, Devuyst and Hance2006; Hance et al. Reference Hance, Hou and Vachard2011; Vachard Reference Vachard and Montenari2016). In contrast, some still persisted to the early Bashkirian. Owing to the limitation of the foraminifers and their poor presence in the assemblages in the MVS, the first common and last common occurrences and last occurrences (as used for instance by Agterberg & Gradstein Reference Agterberg and Gradstein1999 or Agterberg et al. Reference Agterberg, Gradstein and Liu2007) is not recommended for the MVS, and only the first occurrences (FOD) have been used (Appendix B).
In the resulting Ranked optimum sequence for 96 taxa (Fig. 3), it is difficult to recognize the foraminiferal assemblages described for northern Britain. Owing to this scarcity in foraminifers, it has been necessary to define the maximum twenty Unique Events (FOD of taxa that are biostratigraphically significant, but that only occur in low number of pairs of co-occurrences, i.e. one or two; e.g., Howchinia subplana which only occurs in North Ayrshire). In some cases, important taxa could not be included, such as Endothyranopsis plana. The lower part of the Ranked optimum sequence seems to be the most realistic, probably because the sampling from the lower limestone levels is more comprehensive, even including some limestones below the base of the LLF. Taxa 74 to 96 (in Fig. 3) are typical foraminifers that can be found from the early Brigantian or older levels, and thus, they do not contribute anything significant to the correlation of the MVS. The base of the LLF in the MVS can be established in this Ranked optimum sequence by the occurrence of Endothyranopsis sphaerica close to Howchinia subplana (taxa 73 and 68 respectively in Fig. 3), which are recorded earlier from the Broadstone Limestone (north Ayrshire). Other typical taxa recorded in younger horizons included in the same interval are Climacammina, Parabradyina pararotula and “Millerella” tortula. These taxa characterize the “Hurlet level” (including also the thin limestones above, such as Inchinnan, Craigenhill and Wee Post limestones). The first group of taxa might be representative of Assemblage 6 (upper) in northern England (Single Post and Cockle Shell limestones), but together with the second group, they are characteristic of Assemblage 7 (lower), which usually first occurs from the late Brigantian levels in the Scar Limestone (Cózar & Somerville Reference Cózar and Somerville2021). In the MVS, this assemblage is interpreted as the basal late Brigantian at the “Hurlet level”, and thus, representative of Assemblage 7 (lower) (Fig. 3).
Ranked optimum sequence of the foraminifers (and some algae) from the MVS based on RASC. From left to right columns is shown: the assigned limestone horizon (1), foraminiferal assemblage (2), position in the ranked optimum sequence (3), possible permutations (4), order in the dataset (5), Unique Events (20, marked with double asterisk in column 6), names of taxa (7), number of stratigraphic sections where the taxa is recorded (8), the standard deviation numerically (9) and graphically (10).

Above, the following group of taxa (taxa 22 to 49 in Fig. 3) includes those taxa that have been considered by us as typical of the “Blackhall level”. The most important species are (sub-group A) Neoarchaediscus postrugosus, Asteroarchaediscus baschkiricus, Eostaffella mirifica, Janischewskina typica, Neoarchaediscus gregorii, Biseriella scotica, Biseriella paramoderata, Planospirodiscus minimus and Calcifolium okense. Due to their more frequent co-occurrences, RASC has also intercalated many Unique Events, including (sub-group B) Howchinia acutiformis, Ammovertella inversa, Planospirodiscus taimyricus, Eolasiodiscus donbassicus, Semiendothyra phrissa, Millerella variabilis, Eostaffella pseudostruvei group and Parajanischewskina brigantiensis. These assemblages and sequence are based in the most common pairs of events, and the rare occurrences have been ignored by the method, but in many cases, those species have been recorded from the “Hurlet level”, but the most common records in the horizons of the “Blackhall level” has been preferred by the method. The position of Semiendothyra phrissa and Millerella variabilis (taxa 35 and 36) is rather unusual. The latter taxon only occurs in the Wardlaw Limestone (in the youngest part of the Bathgate section, Fig. 2), but is accompanied by foraminifers typically recorded from the “Blackhall level”. The resulting association has to be considered as an Assemblage 8 in northern Britain (mostly recognized by the taxa in group B, e.g., P. taimyricus, T. simplissimus, E. pseudostruvei group), although composed mainly of taxa typical of Assemblage 7 (upper) (i.e., those of sub-group A).
In the upper part of the succession, the “Main-Mid Hosie level” is considered herein to be characterized by Archaediscus at tenuis stage (although it shows a high standard deviation), Eostaffella postmosquensis group, Calcivertella (Unique Event), Euxinita pendleiensis (Unique Event) and Biseriella parva. The “Main-Mid Hosie level” is usually correlated with the Four Fathom Limestone in northern England (Cózar et al. Reference Cózar, Somerville and Burgess2008; Cózar & Somerville Reference Cózar and Somerville2021), but those taxa are mostly representative of Assemblage 8. Only E. pendleiensis (taxon 21) is a marker of Assemblage 9, which has been used to define the base of this interval (Fig. 3). These taxa are commonly recorded in horizons which have been assigned to the Second Hosie Limestone.
The Second and Top Hosie limestones (and lateral equivalents) are mostly composed of Unique Events, some of them well-known from Assemblage 8 in northern England (Cózar & Somerville Reference Cózar and Somerville2021). In addition, the resulting taxa in the Ranked optimum sequence are of low reliability, because Tubispirodiscus cornuspiroides is a more primitive form than Tubispirodiscus attenuatus (located at the “Blackhall level”), Cepekia cepeki (taxon 4) first occurs from Assemblage 8, but it is more common in Assemblages 9 and 10, whereas Tubispirodiscus hosiensis (taxon 2) is first recorded from the Mid Hosie Limestone in north Ayrshire. Only evolved Eostaffella angusta and E. acutiformis ((taxa 10 and 16) are typical forms of Assemblage 10, although recorded from levels assigned to Assemblage 9. On the other hand, only Eostaffellina paraprotvae (taxon 3) is considered as a good marker of Assemblage 10 (apart from some of the Unique Events).
In conclusion, the probabilistic approach provided by the RASC does not solve problems of correlation in the MVS. Due to the scarcity in foraminifers, the resulting sequence, when compared with the biostratigraphy previously assigned to the limestone levels is one zone out of phase. This fact is a result of the more common occurrence of taxa, but certainly, does not consider the well-contrasted biostratigraphic knowledge on those foraminifers, nor their first rare occurrences.
3.2. Unitary associations (UA)
In order to use this method described by Guex (Reference Guex1991), the program PAST, current version 4.17 (Hammer Reference Hammer2024) has been used, which is a more friendly software than the original package. The method gives a sequence of intervals with unknown associations (Guex Reference Guex1991). The UA method is based on associations of taxa and not only on events (as in RASC and CONOP). All the co-occurrences of taxa, virtual or observed, are considered of similar importance and taken into account for the final associations. In consequence, any co-occurrence introduced in the database is considered with the same importance and relevance for the resulting biostratigraphic scale.
The inclusion of all the taxa in the database gives many inconsistencies generated by artificial co-occurrences and associations. Many of these problems are related to the scarce and poorly preserved assemblages (from the oldest levels in the MVS). To avoid this problem, well-known taxa from much older limestones than those of the LLF can be artificially added to the base of the stratigraphic sections, and thus, assuming that their first occurrences is solely a problem of scarce sectioning/sampling. On the other hand, all those “older” taxa can be removed from the database, to avoid inconsistencies, and to use the most relevant taxa (Appendix B). Here, this second option is adopted, and 51 taxa only known from the early Brigantian or younger levels in northern England (see Cózar & Somerville Reference Cózar and Somerville2021) were selected.
In total, nineteen UA are established, of which the stratigraphically older UA are based on higher number of co-occurrences and larger associations, whereas the stratigraphically youngest UA are less consistent and based on smaller associations, and frequently, conditioned by the co-occurrence of rare taxa (Fig. 4).
Unitary Associations recognized in the MVS. Recognized standard lithological levels, in the bottom, and foraminiferal assemblages in left column.

UA 1 to 3, as mentioned above, are the most consistent with larger numbers of co-occurrences (Fig. 4), based on twenty-two taxa, of which, representatives of Assemblage 6 (upper) are grouped under UA 1, but also contains Biseriella parva, Tubispirodiscus attenuatus and Climacammina, which are only recorded from Assemblage 7 (lower) (Cózar & Somerville Reference Cózar and Somerville2021). Thus, this method does not allow to recognize Assemblage 6 (upper). UA 2 is a mixture of taxa of Assemblages 7 (lower) and 7 (upper), which the database does not allow to distinguish. This fact was also questioned with RASC, if Assemblage 7 (lower) and (upper) should be considered as a single biozone. In contrast, UA 3 is notable for the occurrence of Calcifolium okense, which first occurs in Assemblage 7 (lower), but it is much more common in younger limestones including Assemblage 8 (and even Assemblage 9 in northern England).
UA 4 to 6 are considered another group. UA 5 is never recorded above UA 4, and are lateral associations, commonly recorded in the western sections (Fig. 5), whereas UA 6 is recorded from the top horizons in the same beds. Within the new occurrence of taxa in these UA, most noteworthy is the first occurrence of Miliolata (Trepeilopsis and Ammovertella), Tubispirodiscus simplissimus, Planospirodiscus taimyricus, Biseriella scotica and B. paramoderata. These taxa together with those previously recorded from UA 1-3, can be included as typical Assemblage 8.
Correlation proposed by the Unitary Associations. Unitary Associations with a single number (in bold) are those whose first and last UA coincide, whereas the Unitary Associations with two numbers are those whose first and last proposed UA do not coincide (see Appendix B). Solid lines are confirmed correlations, and dotted lines are questionable correlations based on more ambiguous Unitary Associations. Abbreviations as in Figure 2.

UA 7 to 9 are only recognized in the Petershill Limestone of Bathgate (Fig. 5). Taxa are mostly representative of Assemblage 8 elsewhere, although the occurrence of Eostaffella acutiformis was only recorded in Assemblage 9 in northern England (Cózar & Somerville Reference Cózar and Somerville2021). Thus, the final assignment of these associations is ambiguous.
UA 10 to 16 are considered another group of associations. However, as has been observed in the RASC, UA 12 is considered as unusual, and out of place. It is only recorded in the Wardlaw Limestone and is based on the co-occurrence of Millerella s.s. with rather primitive taxa (Figs 4–5). This genus is rare in northern England, but when it occurs, it is first recorded from Assemblage 10 (Great Limestone to Little Limestone). Stratigraphically, the Wardlaw Limestone seems to occupy the same position to that of the Great Limestone and thus, laterally equivalent to the “Second/Top Hosie level”. This apparent older position is due to the accompanying assemblage, which does not contain any of the taxa recorded in UA 13 to 19. Apart from this unusual UA 12, the other associations are representative of Assemblage 9 in northern England, with some well-contrasted markers (e.g., Tubispirodiscus hosiensis UA 10, Euxinita pendleiensis UA 13, Endothyranopsis plana UA 14), as well as other taxa that first occurs from Assemblage 8, but that they are much more common in Assemblage 9 (e.g., Cepekia cepeki, Eostaffella pseudostruvei group, calcivertellids, Archaediscus at tenuis stage).
The final UA 17 to 19 are typical of Assemblage 10, including the most evolved Tubispirodiscus as well as Eostaffellina paraprotvae. The last UA 19 is a little unusual, as it is characterized by the first occurrence of Neoarchaediscus shugorensis, a taxon which is typical from assemblages 8 and 9, but that in the MVS is considered to be the last one to occur, because it has been only recorded in the top sample of the Top Hosie Limestone in north Ayrshire (Fig. 5).
This method, taken into consideration the co-occurrence of taxa, allows us to recognize unquestionable unitary associations for individual horizons (highlighted by bold numbers in Fig. 5), and other more ambiguous associations, where the method gives the possible associations variations (highlighted by regular numbers in Fig. 5) (see also Appendix B). The UA 1 to 3 are associated with the “Hurlet level”. UA 1 is only recognized in the Upper Longcraig Limestone, UA 2 in the Broadstone Limestone, and UA 3 in the Lower Skateraw Limestone (Fig. 5). In contrast, in the other levels supposedly laterally equivalent, the associations vary from 1 to 15, but mostly 2-3 to 2-5 (Fig. 5). These associations confirm the classical correlation of the base for the LLF mostly for the western sections, although it questions the inclusion of the St Monans White Limestone as the base for the Formation in east Fife. Another unusual record is that in the first unnamed limestone below the Main Limestone in Douglas, which is also assigned to an indeterminate UA 2 to 6 (Fig. 5). It is noteworthy that in the standard lithological succession close to Glasgow, it is the least representative and the UA method does not recognize clear associations.
Above, UA 4 to 6 are considered characteristic of the “Blackhall level”, although in most parts of this horizon, it is assigned to the UA 4 to 19 (Fig. 5). Rarely, the UA 2 is recognised at the base of the Hawthorn Limestone in Douglas, which is a result of poor foraminiferal assemblages in that level (Fig. 5). From Bathgate to the eastern sections, the correlation of this level is rather ambiguous also, although this is probably due to the fact that the sections in Kirkcaldy and St Monans are little representative, and the method does not recognize unquestionable associations (Fig. 5). Thus, the limestones corresponding to the “Blackhall level” can be correlated with the Seafield Tower Limestone, whereas the Charlestown Main Limestone only contains vague associations, and might be located in the “Hurlet level”, because at the base of the limestone, the UA are 2-3 and in the upper part of the limestone the UA are 1-9 (Fig. 5). In the East Lothian section, the Middle Skateraw Limestone might coincide with this “Blackhall level”. However, the Upper Skateraw Limestone shows an apparent younger UA 10, which is considered here as part of the following cycle. This fact contrasts with some authors, who considered that the Upper Skateraw Limestone is part of the Middle Skateraw cycle (e.g., Wilson Reference Wilson1974), and thus, it would constitute an independent cycle.
UA 7 to 9 are only recorded together in the Petershill Limestone, and according to the occurrence of Eostaffella acutiformis, this should be assigned to Assemblage 9, and thus, belong to the “Main/Mid Hosie level” (see below). Nevertheless, these associations might suggest that the real stratigraphic position of the Petershill Limestone is slightly older than the typical Main Hosie Limestone, a similar result to that using the RASC method. It is also worth noting that the Petershill Limestone is one of the thickest limestones with rich and diverse foraminiferal assemblages.
UA 10 to 16 are considered representative of the paired “Main/Mid Hosie level”. As discussed above, the inclusion in this group of UA 10 questions the position of the Upper Skateraw Limestone, but this is based on the record of Tubispirodiscus hosiensis in the Mid Hosie Limestone in north Ayrshire, which contrasts with the occurrence of Eolasiodiscus donbassicus and Cepekia cepeki in the Upper Skateraw, but those two taxa are associated with T. hosiensis. In general, the Main Hosie Limestone is little representative, and the associations are more clearly recognized in the Mid Hosie Limestone (Fig. 5). These associations are poorly recognized in the eastern sections, and it could not be confirmed that the Lower Kinniny Limestone belongs to this interval. Another small anomaly is that observed at the base of the MacDonald Limestone in south Ayrshire, which records UA 13, although most of the limestone is representative of UA 18.
The youngest UA 17 to 19, are considered representative of the “Second/Top Hosie level”. Apart from the anomaly in the Wardlaw Limestone with a UA 12, sections in the western MVS show the expected correlation, whereas in the eastern sections, the base of this cycle might correspond with the Mid Kinniny Limestone in Kirkcaldy-Kinghorn (Fig. 5).
In conclusion, the Unitary Associations seem to work better in the western sections of the MVS, whereas in the eastern sections (and Bathgate) they show more anomalies and uncertainties compared to the expected correlation, although the base of the LLF does not seem to be a major problem, but higher up in the succession, individual limestone horizons do not correlate as in the classical lithostratigraphical scheme. Possibly, the main problems are the position of the Upper Skateraw Limestone, the Petershill Limestone, and the uncertainties in the correlation of the Main/Mid Hosie limestones.
3.3. Constrained optimization (CONOP)
Similar to the case of the Unitary Associations, the database used in the Constrained Optimization (Kemple et al. Reference Kemple, Sadler, Strauss, Mann and Lane1995) has been reduced to the biostratigraphically relevant taxa (Appendix B). In general, the sequence of events recognized by CONOP is possibly the most similar to the expected results compared to the assemblages recognized in northern England (Fig. 6), although it does present some problems/anomalies.
Sequence of events resulting with CONOP. Taxa with arrow are those whose stratigraphic range has been extended down. Taxa with asterisk are those whose stratigraphic range is considered younger than their well-known records in northern England.

In the lower part of the sequence, the assemblage of events is mostly representative of Assemblage 6 (upper), and the sequence contains the first occurrences (in stratigraphical order) of Endothyranopsis sphaerica, Praeostaffellina sp. nov., Climacammina, Parabradyina pararotula and Asteroarchaediscus baschkiricus (Fig. 6). This assemblage is noteworthy for the inclusion of the first Miliolata (Ammovertella), which the CONOP method interprets should first occur, but in reality, it never occurs in such stratigraphically low horizons in the sections (it only occurs from the Hawthorn Limestone upwards). The inclusion of Climacammina in this group, as suggested by Cózar & Somerville (Reference Cózar and Somerville2021), might be possible from Assemblage 6 (upper), and thus, it could be interpreted that this group of taxa are also representative of Assemblage 7 (lower). Nevertheless, Assemblage 6 (upper) is preferred because this suite of foraminifers is considered as being present from horizons below the Main Limestone (Glenbuck), St Monans White Limestone (St Monans), and below the Upper Longcraig Limestone (East Lothian) (Appendix B).
The following group of events (in stratigraphical order) is composed of Howchinia subplana, Eostaffella mirifica, Tubispirodiscus attenuatus, Neoarchaediscus postrugosus, “Millerella” tortula, Tubispirodiscus cornuspirodes and Biseriella parva (Fig. 6). Those taxa are typical markers of Assemblage 7 (lower). The only unusual taxon is the inclusion of other Miliolata (Trepeilopis), which, like Ammovertella, is only recorded from younger levels.
The first occurrence of Planospirodiscus taimyricus, Janischewskina typica, Calcifolium okense, Biseriella scotica and B. paramoderata (in stratigraphic order) in the following group of events, which suggest Assemblage 7 (upper). Within the association, there are common taxa that in northern England are known from older levels, but that due to the poor assemblages of the MVS, their first records are in slightly younger levels: Asteroarchaediscus rugosus, Howchinia convexa, Neoarchaediscus gregorii and Planospirodiscus minimus (Fig. 6).
Assemblage 8 is recognized on the basis of Eostaffella postmosquensis group, Parajanischewskina brigantiensis, Eostaffella pseudostruvei group, Eolasiodiscus donbassicus and Cepekia cepeki (Fig. 6). Within the assemblage, Eostaffella acutiformis and Tubispirodiscus simplissimus are included. The extension down of the observed first occurrence of Tubispirodiscus simplissimus is in agreement with its record in northern England, although Cózar et al. (Reference Cózar, Somerville and Burgess2010) only recorded the taxon in levels equivalent to Assemblage 9. The extension downwards of Eostaffella acutiformis to Assemblage 8 is also plausible, and is in agreement with its inclusion in Unitary Association 8 (Fig. 4), which suggests an earlier first occurrence in the MVS than in northern England. On the other hand, Parajanischewskina brigantiensis is also included in this group, a fact which contrasts with the original definition of the genus (in Cózar & Somerville Reference Cózar and Somerville2006) from the base of the Brigantian. The taxon was later recorded also from the latest Asbian (Waters et al. Reference Waters, Cózar, Somerville, Haslam, Millward and Woods2017), and more commonly in the late Brigantian. Nevertheless, it has to be mentioned that specimens recorded from the latest Asbian-early Brigantian should be described as a different species, whereas P. brigantiensis, of which the type material comes from the Petershill Limestone, is only recorded from the late Brigantian, although its precise first occurrence needs to be further investigated. It is also noteworthy that Cepekia cepeki occurs near the top of the assemblage, which suggests the poverty of this taxon in the MVS below the most typical occurrences within Assemblage 9. On the other hand, analysing the results in CONOP, it can be also interpreted that Endothyranopsis plana might be present from Assemblage 8, near the top also (Fig. 6), although this species has not been recorded yet at those horizons anywhere in Britain. To explain this unusual distribution, the species is included in Assemblage 8 (and not in Assemblage 9) because of its inferred occurrence in the Hawthorn, Dockra, Charlestown Main and Upper Skateraw limestones (Appendix B).
Assemblage 9 is assigned to the first occurrences of Tubispirodiscus hosiensis, Archaediscus at tenuis stage and Euxinita pendleiensis (Fig. 6). Here, A. at tenuis stage is a taxon that might also first occur in Assemblage 8, although usually it is recorded from Assemblage 9 (Cózar & Somerville Reference Cózar and Somerville2021). The other two taxa typically first occur in Assemblage 9.
The rare occurrence of some taxa in the MVS also conditioned the group of events assigned to Assemblage 10 (Fig. 6). In this interval, the later occurrence of some taxa is recorded and compared with their distribution in northern England: Calcitornella, Calcivertella, Eostaffella mutabilis, E. postproikensis and Neoarchaediscus shugorensis. The most significant taxa for the recognition of this assemblage are Tubispirodiscus swanni, T. absimilis, Eostaffellina paraprotvae and Millerella variabilis (Fig. 6).
The diagram of fences produced by the CONOP method, based on the correlations of events, gives many potential lines (Appendix B), in some cases, crossing different levels. The level of correlation of each event (first occurrences) is shown in Appendix B, and the selected correlation lines in Figure 7.

The boundary between Assemblages 6 (upper) -7 (lower) (Fig. 7) is recognized in the lower levels of the limestone horizons classically considered as the base of the LLF, except for south Lanarkshire (above the Inchinnan Limestone; Fig. 7). It must be highlighted though that this succession is rather anomalous, and most lines cross by the Hawthorn Limestone due the anomalous foraminiferal assemblages, and thus, it is recommended to be ignored for the regional correlation. A small discrepancy is also observed in Glasgow, where this boundary is observed at the base of the Inchinnan Limestone, but the Hurlet Limestone in this section contains also very poor assemblages.
The boundary between Assemblage 7 (lower) and 7 (upper) (Fig. 7) is distinguishable in the western sections of the MVS, whereas in the eastern sections (and Bathgate) it is located also in the “Hurlet level” (Fig. 7) suggesting that it is not possible to be distinguished. Usually, this boundary is located at the base of the “Blackhall level” in the western sections, except for east Kilbride, where it is above the Craigenhill Limestone. Owing to these problems, it is better to ignore this correlation line, and to consider a single Assemblage 7.
The boundary between Assemblage 7 (upper) – Assemblage 8 (Fig. 7) is one of the most consistent lines throughout the MVS. It is observed within the lower horizons of limestones generally attributed to the “Blackhall level”, except in the type area of this limestone (Fig. 7). On the other hand, it is noteworthy that in Bathgate, the Petershill Limestone is considered as belonging to Assemblage 8.
In the upper part of the successions in the western outcrops, the upper Assemblages 9 and 10 are well recognized (except for the anomalous south Lanarkshire section) (Fig. 7). Nevertheless, the Main Hosie Limestone is too poor in foraminifers in most sections, and the base of Assemblage 9 is located in the Mid Hosie Limestone and Limestone A (blue line in Fig. 7). The base of Assemblage 10 (Fig. 7) is located within the MacDonald, Second Hosie and Anvil limestones, as expected. However, in the eastern sections, both of the boundaries (9 and 10) are located together within the same limestones, Wardlaw, Mid Kinniny and Chapel Point (Fig. 7). This fact possibly is a result of the foraminiferal assemblages in these youngest limestones, being much poorer compared to their equivalents in the western sections.
4. Comparison of quantitative biostratigraphic methods and correlations
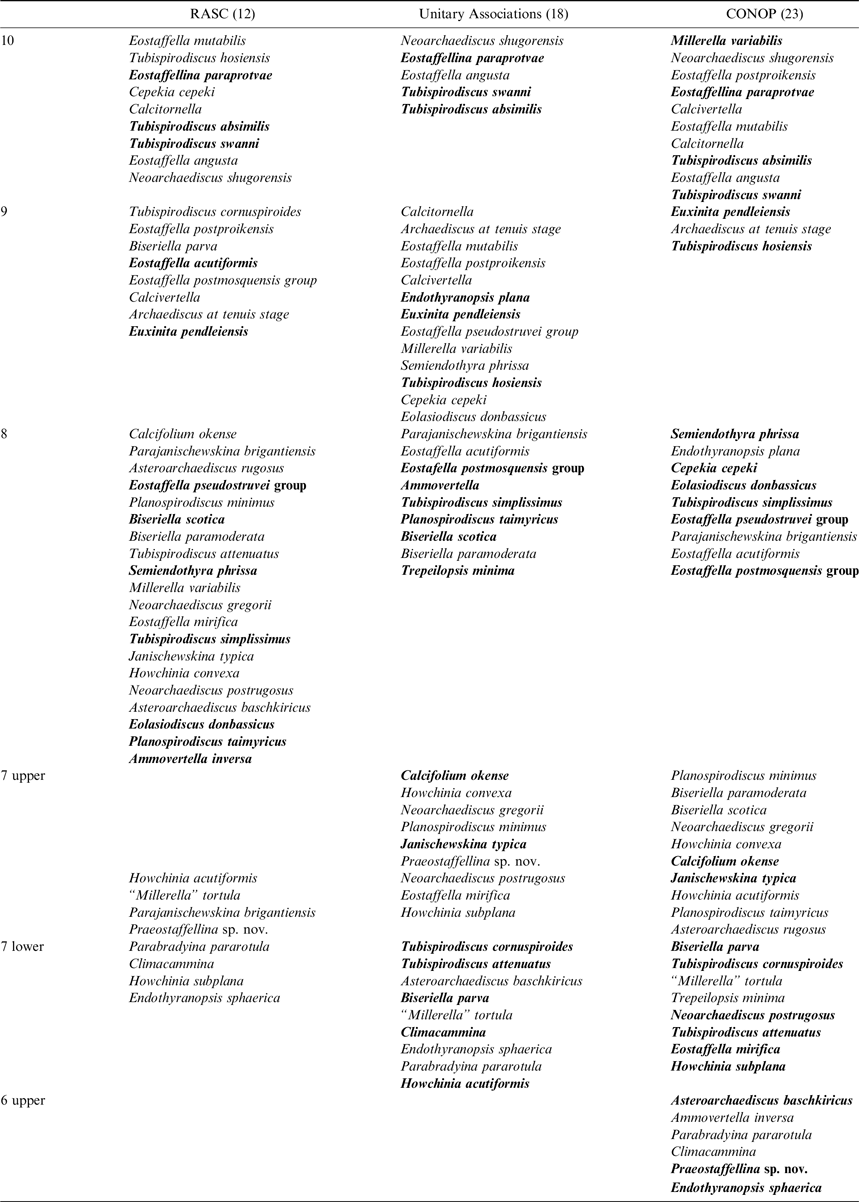
Analysis of the results of the three methods show some advantages as well as some disadvantages. The main advantage with the RASC method is that owing to the analysis employed, it selects the most common distributions, the results for dating isolated samples and low sectioning might give potentially a more correct biostratigraphic position, although from a strict biostratigraphical point of view, the method could give more mistakes. Indeed, this method gives the fewest number of coincidences with the expected sequence, only twelve (Table 1). In addition, the lower part of the succession is poorly subdivided by RASC, and an overall Assemblage 7 (i.e. combined lower and upper parts) could be only defined. Assemblage 6 (upper) is not recognized.
It is worth mentioning that some taxa are recorded in younger horizons than expected in two of the three methods, and it could be assumed that this represents a late first occurrence in the MVS, e.g., Eostaffella mutabilis, E. angusta, Neoarchaediscus shugorensis, Archaediscus at tenuis stage, Cepekia cepeki, Asteroarchaediscus rugosus, Planospirodiscus minimus and Neoarchaediscus gregorii. However, this apparent delay can be also related to random sampling, because N. gregorii was recorded by Karbub (Reference Karbub1993) from the First Abden Limestone, a horizon much older than any of the records included in this study, whereas Cózar & Somerville (Reference Cózar and Somerville2020), who prepared more than 20 thin-sections from the First Abden Limestone (3.5 m thick) were not able to record its presence.
The Unitary Associations method does not allow to recognize Assemblage 6 (upper), and in the lower part of the sequence includes a large number of taxa. In addition, in the upper part of the succession, the associations seem to be too much more conditioned by the rare occurrences of isolated taxa, in cases, with rather unusual results (e.g., UA 12 with Millerella variabilis).
The CONOP method has the most similarities compared with the expected sequence (23; Table 1), although the constrained optimization also presents some extended stratigraphic ranges that have not been recorded anywhere (e.g., Ammovertella and Eostaffella acutiformis). In addition, in some cases, material published by other authors that could not be checked, has documented some rare taxa (e.g., Climacammina).
Comparison of the sequences of first occurrences obtained by means of RASC, UA and CONOP methods. Taxa in bold are those with similar positions to northern England. Foraminiferal assemblages in the left column.

In term of correlations, the RASC method does not allow a good correlation, and owing to the predominance of some taxa, the results are difficult to interpret. For the recognition of the base of the LLF, the CONOP method produces a more realistic correlation (except for the anomalous south Lanarkshire section): Productus – Main – Broadstone – Hurlet – First Abden – St Monans Brecciated – Upper Longcraig limestones (Fig. 7). In contrast, the UA method suggests that the same level could be located below the Main, St Monans White and Lower Longcraig limestones (Fig. 5). In addition, Assemblage 7 (lower) is only recognized in the eastern sections with the UA method, whereas the rest of the basin corresponds mostly to Assemblage 7 (upper) (Fig. 5). This fact contrasts with the possible recognition of Assemblage 7 (upper) with CONOP, more clearly defined in the western sections (Fig. 7). Thus, the use of those two assemblages in the MVS is not recommended.
The base of Assemblage 8 or “Blackhall level” is only recognized in the western sections with the UA method: Hawthorn – Dockra – Blackhall limestones (Fig. 5). Whereas with CONOP, areas close to Glasgow are not representative, but this method gives a more widespread correlation across MVS, from west to east: Hawthorn – Dockra – Petershill – Seafield Tower – Charlestown Main – Middle Skateraw limestones (Fig. 7). It must be highlighted that the Petershill Limestone, depending on the method, gives different stratigraphic positions.
Assemblage 9 or “Main-Mid Hosie level” cannot be consistently correlated with the UA method, whereas with CONOP, it is well established in the western sections, but at the Mid Hosie Limestone base, whereas the Main Limestone is unrepresentative. This correlation line is juxtaposed with that of Assemblage 10 in the eastern sections (Fig. 7).
Assemblage 10 or “Second-Top Hosie level” is well correlated in the western sections with both methods, whereas in the eastern sections, is not recognized with UA.
In summary, CONOP gives a higher number, and more reliable results, of individual sequences of events and correlation lines. Therefore, accordingly, the Petershill Limestone should be reinterpreted as part of the “Blackhall level”. On the other hand, the poor definition of Assemblages 9 and 10 in the eastern sections, the Chapel Point-Dry Burn limestones are considered here as part of the “Main-Mid Hosie level”, as suggested by the UA method, and the Barn Ness Limestone is interpreted as included in the “Second-Top Hosie level”.
Following the results with the CONOP method, the Abden Fauna can be considered as a good marker, and although there is a repetition of facies in central Fife, this marine band is generally located below the inferred “Hurlet level”. Separately, the UA method correlates the Blackhall Limestone in the western sections, and thus, the Neilson Shell Band located above, and the CONOP method correlates the limestones below the Neilson Shell Band in the eastern sections. Nevertheless, none of the methods could confirm that the so-called Neilson Shell Band in the eastern and western sections is exactly the same stratigraphic horizon.
5. Conclusions
The quantitative biostratigraphical methods applied to foraminifers from the Midland Valley of Scotland confirm the poor assemblages recorded in the basin, and thus, the Ranking and Scaling method gives unusual mixed associations and ranked optimum sequence. In contrast, the Unitary Associations and Constrained Optimization methods yielded more reliable sequences and correlations, especially the latter.
These methods confirm the correlation of some limestones, whose stratigraphic position was controversial:
-
The West Kirkton, First Abden and St Monans Brecciated limestones are considered the base of the Lower Limestone Formation in the eastern regions.
-
The Petershill Limestone is considered as the likely lateral equivalent of the Blackhall Limestone. This fact would suggest that the Tartraven Limestone (not sampled in this study), might be laterally equivalent to the Inchinnan Limestone.
-
The correlation of the Seafield Tower, Charlestown Main and Middle Skateraw limestones is confirmed.
-
In spite of duplication of the Abden Fauna in central Fife, this marine band is confirmed just below the base of the Lower Limestone Formation. Its occurrence below the Second Abden Limestone needs further analysis, and to check carefully if the fauna is exactly the same as that recorded in older levels.
-
The correlation of limestones below the Neilson Shell Band is confirmed in the eastern region using the CONOP method, and with the Unitary Associations in the western region. Although the correlation between both western and eastern regions in the MVS could not be confirmed, indirect correlation of limestones by both methods suggests that the Neilson Shell Band might be also an isochronous level across the Midland Valley of Scotland.
6. Supplementary material
To view supplementary material for this article, please visit https://doi.org/10.1017/S1755691025100741
7. Acknowledgements
We thank Keyvan Zandkarimi, an anonymous reviewer and the editor for their many helpful comments and suggestions which has significantly improved the paper.