1. Introduction
The decline in fertility rates has been at the center of both researchers and policy makers' attention. The implications of a fertility rate below the reproduction rate are well known and this has stimulated a large debate about its causes and, especially, about the possible policy interventions.
Recent immigration waves have substantially increased the (potential) supply of child-care services, as many of the low-skilled immigrant women specialize in the provision of domestic services. Search for a provider of domestic services, especially for child rearing, might be complex and likely to generate frictions in the market, leaving potential matches unrealized. The increase in the presence of immigrants might improve the “stance” of the market and help additional vacancies to be filled. The large inflow of migrants might also reduce the reservation wage in the sector of domestic services inducing a further expansion of employment. Increased employment and, possibly, lower wages might reduce the cost of rearing children and thus affect fertility.
If parents care about both the number and the “quality” of their offspring, the impact of a reduction in the cost of children on fertility is ambiguous, as both can be affected by the cost of child rearing. From a theoretical point of view, domestic services performed by non-household members can complement and/or substitute for parental time in the provision of the services necessary for child rearing. They can, therefore, affect the cost of children and parents' (especially, women's) time allocation. In a general model in which both the quality and quantity of children are part of the parents' utility function, a reduction in the cost of children has an ambiguous effect on fertility [see e.g., Becker and Tomes (Reference Becker and Tomes1976), Cigno (Reference Cigno1991)]. Without additional restriction to the model [Cigno (Reference Cigno1991)], we need to resort to empirical analysis in order to assess the capability of child-care services to affect fertility and/or the quality of children.
In this paper, we offer new empirical evidence on this by studying the effect on fertility of the large and unexpected increase in the presence of immigrants, many of them specializing in the provision of domestic services, which occurred in Italy in 2007. To complement the findings on fertility, we also present some results on the possible impact on the “quality” of children, an area that has not been explored yet in the literature. In fact, substituting or complementing parental (mainly maternal) time with marketable services might also affect the accumulation of children's human capital: a measure of children quality. Data limitations allow us to estimate only some reduced form models, but not the channels through which the observed effect might have been generated. The results must, therefore, be considered as indicative and further research will be needed to fully understand them.
In the literature, particular attention has been paid to the availability of, public or private, child-care services.Footnote 1 The role of public provision of child-care services has been widely discussed and recently Bauernschuster et al. (Reference Bauernschuster, Hener and Rainer2016) have shown that in Germany the increase in the availability of publicly provided child-care services did have a sizeable effect on fertility. Similarly, another strand of the literature has focused on the so-called marketization of domestic services and on its effect on household behaviors—especially, fertility and female labor supply. In particular, Bar et al. (Reference Bar, Hazan, Leukhina, Weiss and Zoabi2018) review in detail the marketization hypothesis and also analyze how the increased availability of child-care services bought in the market has positively affected fertility in the USA. d'Albis et al. (Reference D'Albis, Gobbi and Greulich2017), with reference to European countries, show how better access to child care—both private and public—increases the probability to have a second child, contributing to explain the differences in the fertility rates across Europe.
The effects of an inflow of migrants specializing in the provision of household services have been analyzed mainly with reference to the female labor supply. Most papersFootnote 2 found a positive effect of an increase in the number of low-skilled immigrants on women labor supply, especially for the high-skilled or the highly educated ones in Hong Kong [Cortes and Pan (Reference Cortes and Pan2013)], Italy [Barone and Mocetti (Reference Barone and Mocetti2011)], and the USA [Cortes and Tessada (Reference Cortes and Tessada2011)]. Furtado and Hock (Reference Furtado and Hock2010) and Furtado (Reference Furtado2016) look at the (negative) correlation between labor supply and fertility.Footnote 3 They find that the presence of low-skilled immigrants tends to reduce such a correlation, therefore making it more likely for women to both work and raise children.
To our knowledge, only two papersFootnote 4 look directly at the effects on fertility. Romiti (Reference Romiti2018) with reference to the UK finds that immigration did not affect fertility, but increased labor supply of women, especially high skilled. It also increases the probability of working for women with children. Forlani et al. (Reference Forlani, Lodigiani and Mendolicchio2021) for Germany finds some positive, but small, effects on fertility and confirm the positive effects on labor supply.
These results seem to indicate that the domestic services provided by immigrants mainly affect the labor supply of (highly educated) women, rather than their fertility, contradicting the results previously mentioned relative to the effects of the availability of child-care services.
We want to re-examine this issue with reference to Italy. Italy has one of the lowest fertility rates in the worldFootnote 5 and also the one of the lowest levels of public spending on family benefits and of child-care coverage among the high-income countries.Footnote 6 To assess the effect of immigration in a country that largely relies on intra-family (time) transfers and on the private sector to support parents in child care is, therefore, of great interest.
By exploiting the natural experiment generated by the opening of the Italian borders to the “new” European Union (EU) countries in 2007, we contribute to the existing literature with the implementation of a methodology that is robust to several assumptions. The unexpected policy change allows us to implement a double-difference approach producing results that are consistent to any time-invariant heterogeneity across units of analysis—as common with panel data—and also to a general time trend. Such a fortunate framework is quite rare and it ameliorates the other (few) existing results on the effect of immigration on native fertility.
Our case study is also well suited to evaluate the effect of marketable child care on fertility, since Romanian immigrant women, as we will show, work disproportionately in domestic services, representing more than 25% of immigrant workers employed in the sector.Footnote 7 Instead, considering all low-skilled female migrants that do not show the same comparative advantage as the RomanianFootnote 8 could affect the estimates in two ways. On the one hand, an increase in the number of low-skilled immigrants might not be (fully) reflected in a shock to the supply of personal services, leading to a dilution effect. On the other hand, an increase in the supply of low-skilled (female) labor force might change several relative prices in the economy that, in turn, might affect the fertility decisions: therefore, the estimates might not reflect only the effect of a supply shock to domestic services. This distortion is the larger, the lower the share of newly arrived immigrants working in domestic services.
In conclusion, our paper aims to contribute both to literature on the impact of child-care availability and on immigrants specializing in household services by providing novel evidence to an area of particular policy relevance where evidence is, as we have seen, scarce and, to a certain extent, contradictory.
To carry out our analysis, we make use of administrative data at the municipality level aggregated at the level of local market areas (LMAs) as defined by the Italian national statistical institute (Istat)Footnote 9 that contains information on births, the number of native women, and the number of immigrants by country of origin. We use a double-difference approach comparing LMAs where the presence of Romanian immigrant women increased substantially with those that did not experience such an increase. We estimate the impact using both a discrete and a continuous treatment. In the latter case, that is our preferred specification, we use different sets of instruments to address the possible bias due to demand pull factors.
Our results show that the inflow of Romanian women specializing on the provision of domestic services had a sizeable impact on fertility, generating an increase of about 2–4% in the number of births. The impact was mainly concentrated in the Center and in the North West of the country and was mainly due to the first large waves of immigrants. These results are robust with respect to a variety of specifications and instruments used in the estimates.
To assess the potential effect of immigration on children's human capital, we use data on standardized tests relative to the cohorts born from 2008 onward collected by the National Institute for the Evaluation of the Education and Training System (INVALSI) and available at the province level (NUTS-3). The empirical strategy for this part relies on the same difference-in-differences (DiD) approach implemented for the analysis on fertility. Results are tentative and point at a positive effect on children's score where maternal time allocated to child care has increased the most.
The rest of the paper is organized as follows. Next section discusses the consequences of EU enlargement for immigration flows to Italy. We then present the data and our estimation strategy in section 3, followed by the section detailing the results. Section 5 presents some robustness tests and in section 6 we analyze some heterogeneity profiles. Section 7 presents the exploratory analysis on learning achievements and section 8 concludes.
2. Fertility trend and the arrival of immigrants from “new” EU countries in 2007
Fertility in Italy declined substantially from the 1970s to the 1990s falling well beyond replacement rate, where it has remained with some oscillations in the 2000s.Footnote 10 The low-fertility rate has been at center of policy discussion for several years now. According to the latest annual report by the Italian National Statistical Institute [Istat (2020)], the number of desired children exceeds the actual number, indicating that there is room for policy intervention aimed at bringing desired and actual offspring in line. Better access to domestic services provided by the market could, therefore, support such a convergence.
In 2007, Bulgaria and Romania entered the European Union and the Schengen Area of free movement of people. Starting from January 1st, 2007, Bulgarians and Romanians became EU citizens and were allowed to travel and live in all EU-member States without any restriction.Footnote 11
The agreement was reached in 2004, and therefore, the enlargement was well anticipated. Nonetheless, the EU-25 members could restrict access to workers coming from Bulgaria and Romania for a maximum of 7 years following the enlargement. Italy was among the countries that choose a transitory period with the purpose of protecting native workers from the competition of new immigrants.Footnote 12
The free access of Bulgarians and Romanians to the Italian labor market was supposed to start on January 1st, 2012. On December 28th, 2006, however, the new Italian government decided to grant access to workers in agriculture, hotels and restaurants, constructions, manufacture of basic metals and fabricated metal products, and personal service activitiesFootnote 13 from the very beginning of the enlargement—i.e., January 1st, 2007, 3 days after the decision was made.Footnote 14
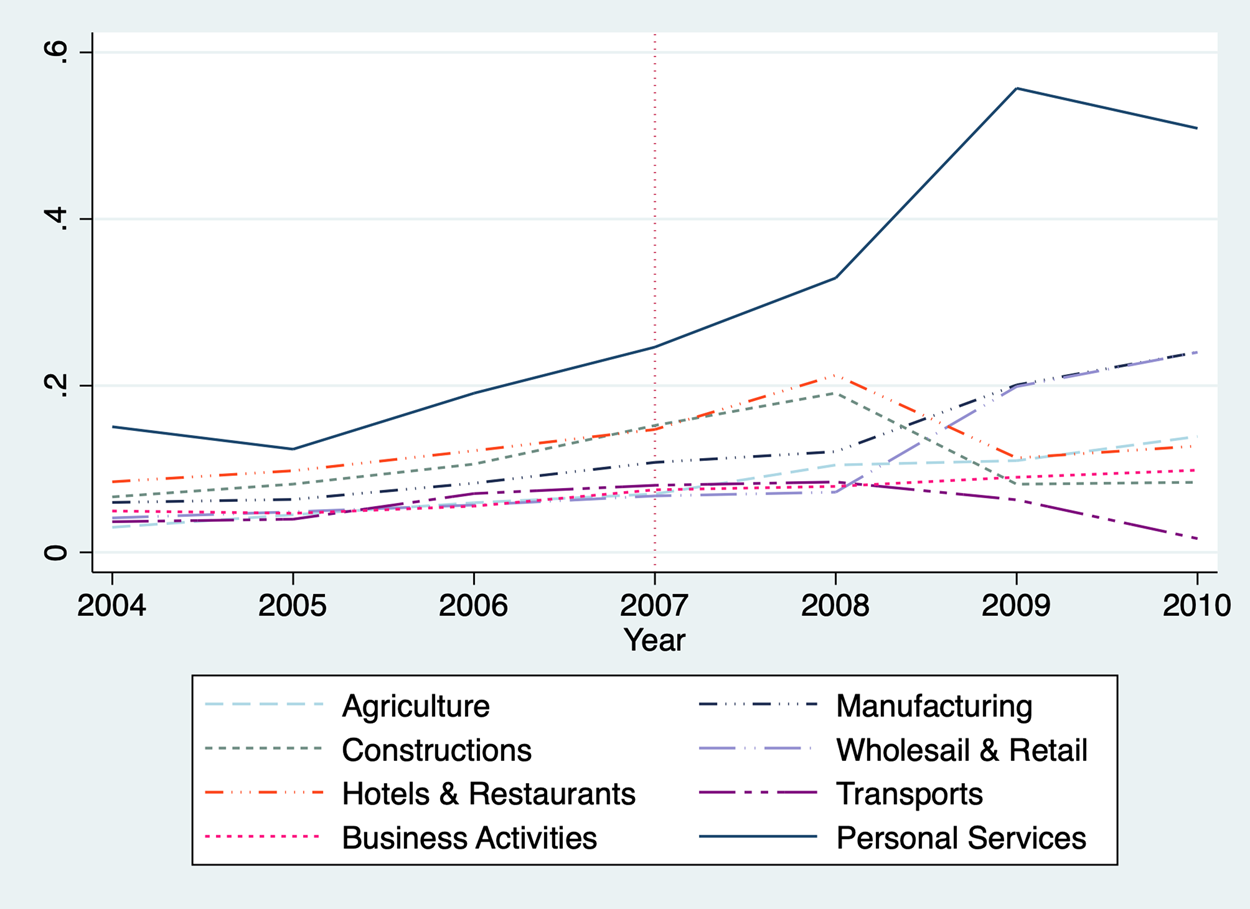
The result was of an unprecedented increase of immigrant workers from Bulgaria and Romania employed in the authorized sectors during 2007. Figure 1 shows the ratio of immigrant to native workers in the sectors where immigrants were relatively more present.Footnote 15 As it is easy to see, the largest increase is observed in the personal service activities (NACE code 96 “Personal and household goods and a variety of personal service activities not elsewhere classified”), making the episode particularly suitable for our study.
Immigrant workers by sector.
Notes: Authors' elaboration on LFS data. Sectors above the average immigration rate in Italy are plotted. On the vertical axis is measured the immigrant rate with respect to native workers.

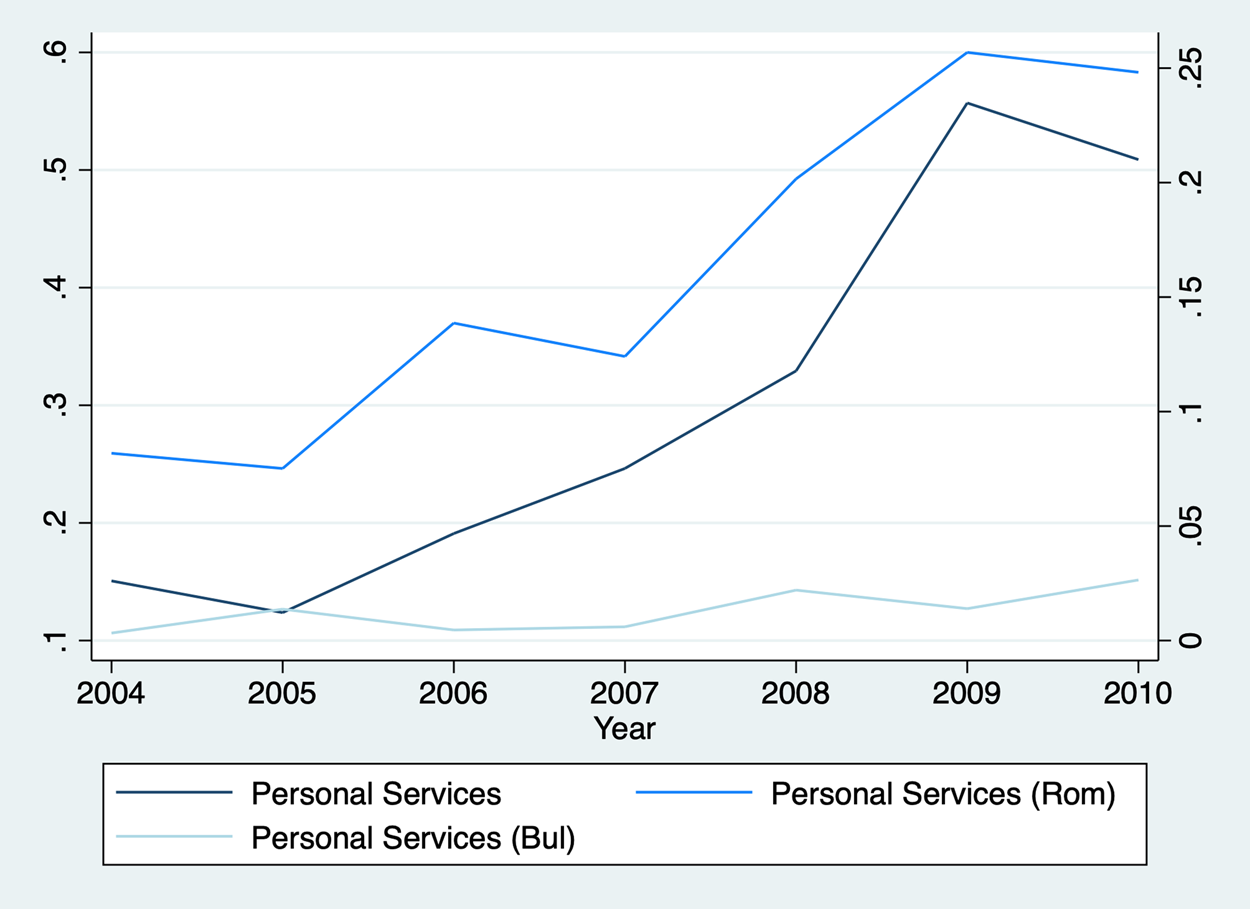
The large increase in the employment of immigrants in personal service activities observed in 2007—with the share of immigrant workers increasing from 0.19 in 2006 to 0.55 in 2009—was associated with a redoubling of the share of Romanians employed in the sector—increasing from about 0.12 to 0.25—whereas the share of Bulgarians in the sector remained fairly constant around the low level of 2006 (see Figure 2). Also, the other ethnic groups specialized in personal services—i.e., Ukrainian, Moroccan, Moldavian, and Philippian—did not change their supply in a relevant way in the period of our analysis.Footnote 16
Shares of immigrant workers in personal service activities.
Notes: Authors' elaboration on LFS data. On the left-hand side vertical axis is measured the ratio of immigrant over native workers in the sector of personal service activities. On the right-hand side vertical axis is measured the share of immigrant workers from Romania and Bulgaria employed in the same sector.

Therefore, in the period considered the supply shock in the sector of personal service activities appears to be mainly due to the arrival of workers from Romania. In fact, there was an overall increase in the employment in the personal service activities of about 20% coupled with an increase of 200% in the number of immigrants, of 400% of Romanians, and a reduction of about 20% of native employment. Moreover, women represented by far the majority (more than 80% in 2006, see Table A1 in Annex A for details) of immigrant workers employed in personal service activities. For all these reasons, in the analysis that follows, we will concentrate on the impact of the sudden increase of Romanian female workers in the personal service sector on the native household fertility choices.
3. The empirical strategy
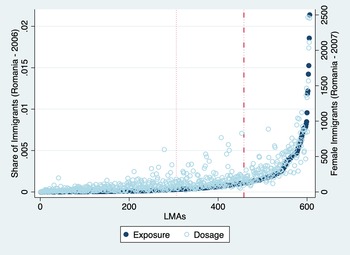
To estimate the effect of immigration on native fertility we exploit the fact that the distribution of new arrivals across the country is influenced, especially for low-skilled workers, by the existing networks of immigrants of the same origin.Footnote 17 Therefore, the share of immigrants from a specific country living in an area is a very good predictor of the likelihood of the area to receive additional immigrants from the same country. As shown in Figure 3, the areas where the share of immigrants from Romania was relatively high in 2006—the year before the enlargement—are also the areas that experienced relatively larger flows in 2007.
Exposure to treatment and dosage.
Notes: Authors' elaboration on Istat data. LMAs are ordered on the basis of the 2006 share of immigrants from Romania. The exposure to the treatment is the share of immigrants from Romania in 2006 and it is measured on the left-hand side vertical axis. The dosage of the treatment is the flow of female immigrants from Romania in 2007 and it is measured on the right-hand side vertical axis. The three most exposed LMAs are excluded from the graph.

On this basis, we use a DiD approach to estimate the impact of immigration of native fertility. In particular, we use both a discrete and a continuous treatment. For the discrete case, we consider as treated the LMAs above the median or above the 75th percentile of the distribution of the share of Romanian immigrants in 2006. The dotted red line in Figure 3 depicts the median LMA according to the distribution of the Romanian-immigrant network in 2006 and the dashed red line is the 75th percentile.
As the selection of a threshold to separate treated and untreated LMAs remains somehow arbitrary, we also estimate a DiD with a continuous treatment—our preferred approach—where the dosage is given by the number of immigrant women from Romania living in the same area.
In particular, in the discrete case we estimate the following model:

where Y i,t is the number of births to Italian women aged 15–49 in LMA i at year t. Post t is a dummy variable equal to 1 for the years after 2007 and Treat i,2006 is a dummy variable equal to 1 for LMAs with a share of immigrants from Romania in 2006 higher than the 50th or the 75th percentile, according to the model specification. Wi,t−1 is a vector containing the number of Italian women aged 15–49 and the age composition of the female population at year t − 1.Footnote 18 Xi,2006 is a vector of pre-treatment controls, λ i and τ t are LMA and year fixed effects, and ɛi,t is the idiosyncratic error term.
As mentioned, in our preferred specification, we use a continuous treatment—lagging immigration by 1 year and estimating the following equationFootnote 19:

where the variables maintain the same meaning and Imm i,t−1 is the number of immigrant women from Romania in LMA i at year t − 1. The estimates are carried out for the period 2005–2010.
Time and space fixed effects are added to all the estimates to control for time invariant location characteristics and common time trends.
We employ a formulation in levels rather than in rates to avoid the well-known issue of spurious correlation due to the presence of the same variable in the denominator of both left- and right-hand side variables. This is a well-known problem probably discussed for the first time in Pearson (Reference Pearson1897). For a more recent discussion (also with reference to fertility), see Kronmal (Reference Kronmal1993) and with reference to the labor-market effects of immigration, see Clemens and Hunt (Reference Clemens and Hunt2019).Footnote 20
As we use data at the municipality level (subsequently aggregated at the LMA level), we can rely on a limited number of controls. We have, however, information on the employment rate, the per capita income, and the per capita expenditure on public services to childhood (mainly kindergarten) that proxy for some income and cost elements possibly affecting fertility choices. We also control for potential biases due to different compositions of the LMA native population by including age-specific female population shares and the share of the population over 65.
3.1 Identification
Estimation of equations (1) and (2) with ordinary least squares (OLS) results in unbiased estimates if the number of immigrants in the LMAs are exogenous to the fertility rate. This hypothesis is violated in the case of omitted variables that are correlated both with the likelihood of attracting new immigrants and the fertility decision of native women. Although non time-varying effects and common trends are absorbed by the fixed effects in the estimates, the problem of bias due to omitted variables that change in the post-treatment period cannot be dismissed. Additionally, we could have a positive bias if immigrants decide to locate where the demand for personal service is growing due to higher (actual or planned) fertility. In both cases—unobservable factors and reverse causality—bias from self-selection into treatment might arise and to obtain an unbiased estimation of the treatment effect we use an instrumental variable (IV) approach.
We use three different sets of instruments to estimate equation (2): all estimates produce very similar results supporting the validity of the inference. In particular, we use a shift-share instrument based on the shares of immigrants from Romania in the pre-treatment period. Because data availability at the LMA level does not allow us to use shares far in the past, raising doubts about the validity of the instrument, we also use the distance from the gateway of entry as an instrument to control for the allocation of immigrants across LMAs. Finally, we aggregate municipal data at provincial level (NUTS 3) and re-estimate our model using the shift-share instrument with the shares of immigrants by province observed in 1991.Footnote 21 We also use the instrument suggested in Barone et al. (Reference Barone, D'Ignazio, De Blasio and Naticchioni2016) as a robustness check.
As mentioned, for the first IV approach we exploit the well-known fact that immigrants of the same origin tend to cluster and that ethnic networks are likely to attract newcomers, so we use a slightly different version of the instrument à la Card (Reference Card2001). The instrument we use closely mimics a shift-share instrument, as it weights the current flows of female immigrants from Romania with the share of Romanians of both genders in each LMA in the year prior the treatment:

Here, $\vartheta _{i, 2006}$ is the share of Romanians—men and women—living in LMA i in 2006 and ΔImm Ita,t is the flow of Romanian women in Italy at time t. Therefore, we allocate women from Romania arrived from 2007 on the basis of the distribution of their countrymen in the pre-treatment period.
As is well known, the shift-share instrument is valid if the shares employed can be considered exogenous to the outcome of interest. Data limitations do not allow us to use shares earlier than 2006 and this might limit the validity of the instrument. We have some elements, however, that help us to reduce these concerns. The distribution of the shares of immigrants from Romania shows a change from 2007 onward, indicating that shares observed before 2007 are not linked to pull factors observed after that year as confirmed by the Epps–Singleton test (see Table B2 in Annex B). Moreover, we employ the shares relative to Romanian immigrants of both genders and not only of women, as it appears reasonable that the network effect is not linked only to women. This should reduce the impact of the presence of any demand-pull factor, as the majority of Romanian immigrants, especially males, works in different sectors (in 2007 only about 17% of the Romanian immigrant men worked in the personal service sector).Footnote 22
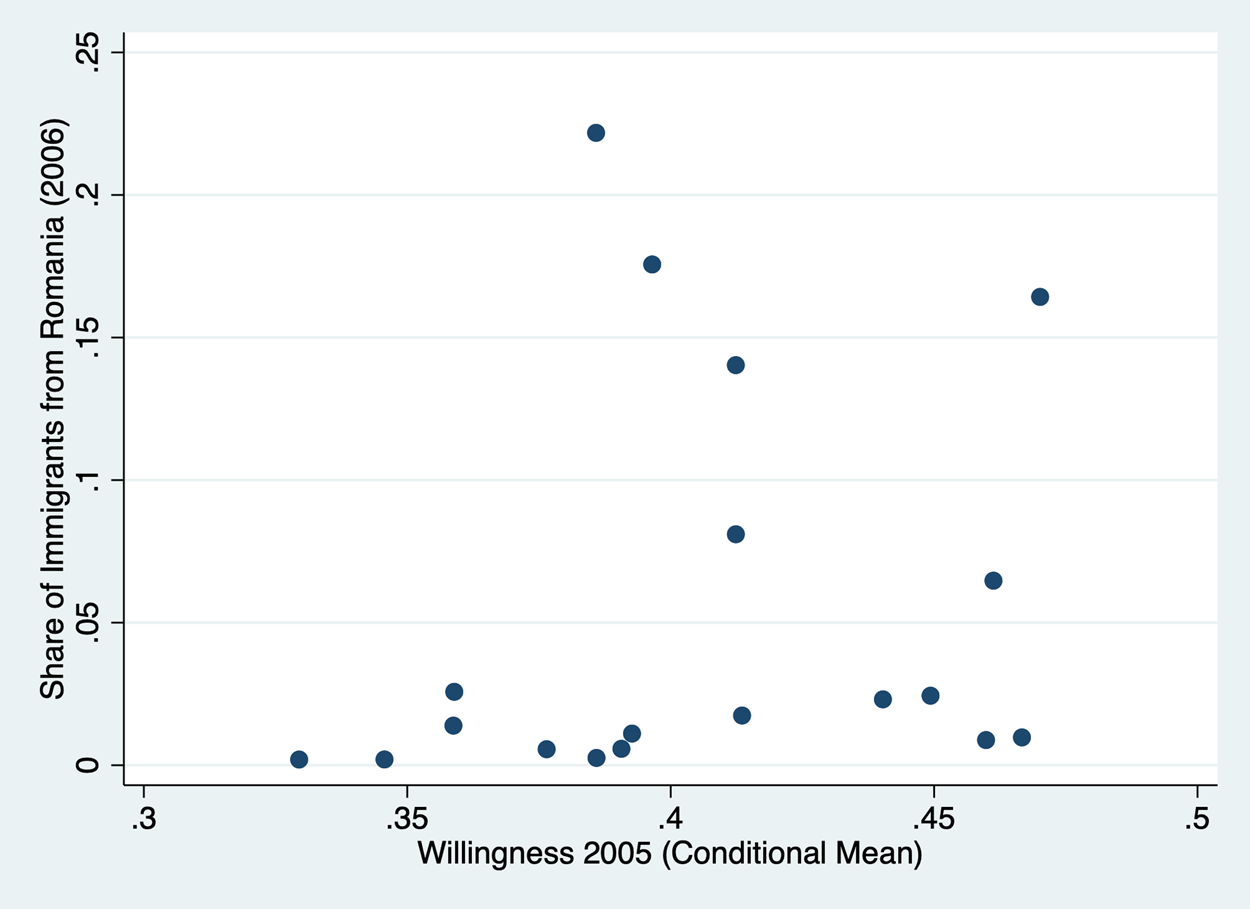
We also look directly at the possible correlation between the immigrant shares and the outcome of interest: the number of births. Using a survey conducted by Istat in 2005 on births and mothers,Footnote 23 we look at the correlation between the Italian women's desire of having additional children in 2005 and the allocation of immigrants from Romania in 2006, which we use to compute our IV. In Figure 4, we plot the shares of Romanians and the percentage of women desiring additional children by region, controlling for age, education, and the number of cohabiting children of native women. It does not appear that the regional allocation of Romanian was in any way correlated with the demand for children, thus offering additional support to the hypothesis that the distribution of Romanians in Italy was not affected by demand-pull factors linked to (desired) fertility.
Correlation between the share of Romanians and the intention to have additional children.
Notes: Authors' elaboration on Istat data. On the horizontal axis we plot the regional shares of native women that intend to have additional children, controlling for the number of children, the level of education, and the age. On the vertical axis we plot the regional shares of immigrants from Romania.

As discussed, we also use as an alternative instrument: the distance to immigrants' entry gateways in Italy. The distance from gateways of entry or from country of origin has been employed as an instrument in several studies, relative to Italy as well as to other countries.Footnote 24 In particular, we use as an instrument the distance between each LMA and the closest gateway multiplied by the flow of women from Romania, in order to generate a time-varying instrument. As gateways of entry have not been changing over time, the instrument can be considered as exogenous.
In particular, the instrument we use is given by:

Here, dist i,clostest gateway is the distance between LMA i and the closest gateway of entry and ΔImm Ita,t is the flow of women from Romania to Italy at time t.
According to the data by the Italian Ministry of Interior, most immigrants from Romania entered Italy from the two main airports (Milano Malpensa and Rome Fiumicino) and from the land route of Slovenia (Valico di San Bartolomeo). For each LMA, we compute the distance to these gateways, and then we consider only the minimum value of the three. Therefore, for LMA i the probability to receive new immigrants at time t is inversely related to the distance to the gateway and proportional to the aggregate flow to Italy.
We also estimated equation (2) using a more standard shift-share instrument based on the shares of immigrants in 1991.Footnote 25 Because of data limitations, for this exercise we had to carry out the analysis at the province level (NUTS3) rather than at the LMA level, substantially reducing the spatial variation. In fact, the data from the 1991 census do not provide information on nationality at the municipal level, but only at the provincial level. Moreover, the information about the immigrants' nationality is limited to the macro areas of originFootnote 26 and, therefore, we consider all immigrants rather than Romanian women only. In formula, the third instrument is:

Here, $\vartheta _{i, 1991}^m \;$ is the share of immigrants from macro area m living in province i in 1991 and $\Delta Imm_{ita, t}^m$
 is the flow of immigrants from macro area m to Italy at time t.
An alternative way to exploit the 1991-Census data is to combine them with data on resident permits by the Italian Ministry of Interior that contain information about the number of immigrants by nationality. Data on resident permits are available at the municipality level and we aggregate them at the LMA level. Following Barone et al. (Reference Barone, D'Ignazio, De Blasio and Naticchioni2016), we distribute the number of immigrants from macro area m across nationalities according to a system of weighs based on the assumption that the “[…] distribution within area of the world is the same for all municipalities in the same province”.Footnote 27 In formula:

where $\vartheta _{i, 1991}^n \;$ is the share of immigrants from nationality n living in LMA i in 1991.Footnote 28
3.2 Data and balance
The data used in the analysis are mainly drawn from the administrative records collected by the Italian National Statistical Institute (Istat). In particular, the number of births and of native women by age group is registered at the municipality level and refers to the inter-census years, i.e., from 2001 to 2010.Footnote 29 Data on immigrants by citizenship are collected at the municipality level from 2003; therefore, data on flows are available from 2004. We then aggregate the data at the LMAs using the 2011 Istat classification.Footnote 30
The employment rate is obtained from the Italian Labour Force Survey (LFS), personal income data are from the tax records of the Italian Ministry of Finance, and the share of public expenditure in child-care services—servizi all'infanzia—is from Istat register data. They are collected at the municipality level and aggregated at the LMA level. Data on employment rate and child-care municipal expenditure are available from 2006 to the end of the period. Given that we need data at the municipality level (subsequently aggregated at the LMA level), the number of possible covariates on which information is available is limited to the aforementioned ones.
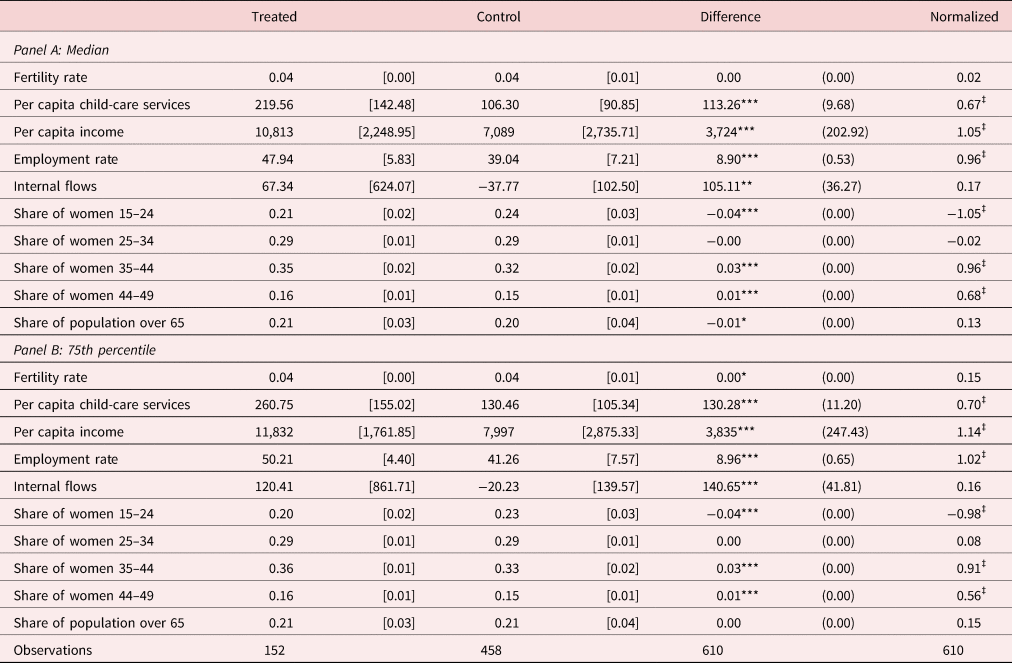
In Table 1, we present the results of the balance test for the outcome variable and the controls just described. Obviously, balance tests can only be carried out for the discrete treatment case, but they serve also as an indication for the balance of basic characteristics of the LMAs in the continuous treatment case. The last column of the same table presents the normalized difference—computed following Imbens and Rubin (Reference Imbens and D. B.2015)—that provides a scale-invariant measure of the size of the difference. Imbens and Rubin (Reference Imbens and D. B.2015) argue that a normalized difference higher than 1 might be a cause of concern, whereas below a value of 0.25 seems to indicate a good balance. In our case, although the outcome variable appears to be well balanced by all criteria, the standard t-test indicates imbalances in some other variables and most of the normalized differences are above 0.25, but below 1.
Balance test (baseline – 2006)

Notes: Authors' elaborations.
*p < 0.10, **p < 0.05, ***p < 0.01, ‡p > 0.25 [Imbens and Rubin (Reference Imbens and D. B.2015)].
For these reasons, we include the covariates at the pre-treatment date of 2006 in all our regressions to control for possible imbalances by stratification. However, this approach has been criticized in the context of randomized experiments [e.g., Bruhn and McKenzie (Reference Bruhn and McKenzie2009)]. Therefore, we also have run all our regressions without controls and the results (not presented here, but available on request) do not differ in any substantial way from those presented here. Table A4 in Appendix A presents the summary statistics on the variables used in the estimates.
4. Results
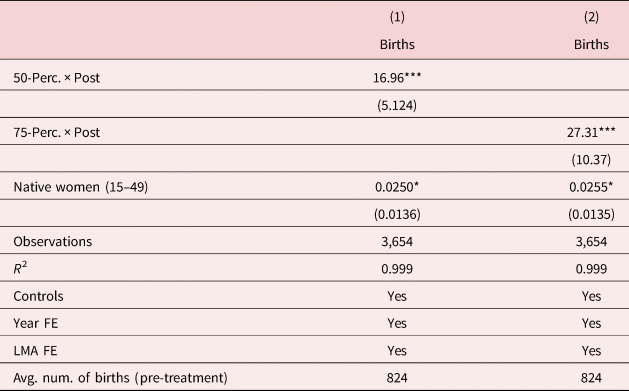
The estimates of the DiD model presented in section 3 [equation (1)] are reported in Table 2. The first column of the table shows that on average after 2007 the LMAs more exposed to the treatment—i.e., the LMAs hosting a share of immigrants from Romania that was above the median in 2006—have experienced an increase in the fertility by 18 additional births. This increase grows to 28 if we consider LMAs above the 75th percentile (column 2 of Table 2). In relative terms, the increase is 2.1% and 3.4%, respectively, of the sample mean at baseline (see the last row of Table 2).
Effect of immigration on native births (binary treatment)
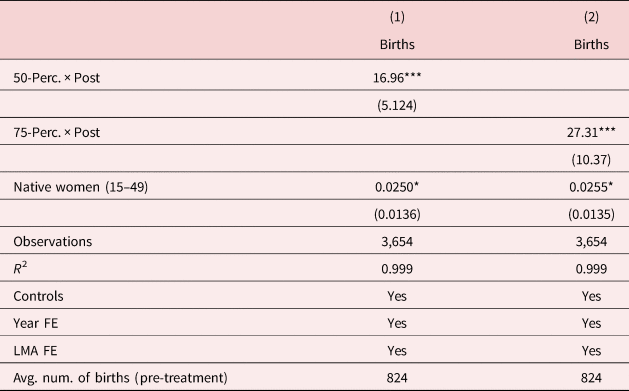
Notes: Authors' elaboration on ISTAT dataset. Controls include yearly age-specific population shares, per-capita income, child-care services, and the employment rate in 2006. Data on per-capita income comes from the Ministry of Finance which uses an older classification for the LMAs, so data on the per-capita income of “Corigliano-Rossano (1845)” LMA are missing. Models in columns 1 and 2 refer to a DiD with a dichotomous treatment in which treated and control groups are defined according to the distribution of ethnic networks in 2006. Robust standard errors are clustered at the LMA level.
*p < 0.10, **p < 0.05, ***p < 0.01.
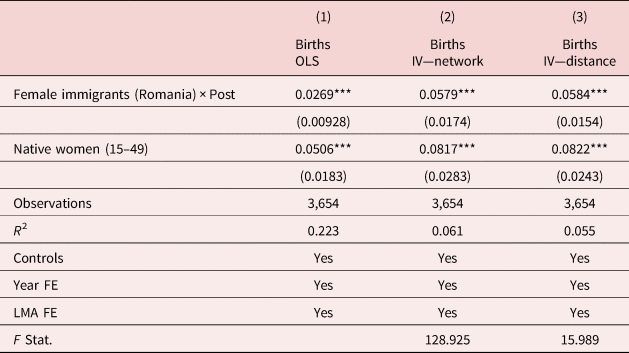
As mentioned, the choice of the threshold for a binary treatment is somehow arbitrary. For this reason, we estimate the DiD model with a continuous treatment. Column 1 of Table 3 shows the result for this model [equation (2) in section 4]. Immigrant women from Romania continue to have a positive effect on the number of births—for every 40 additional immigrants we observe an additional birth after 2007. In percentage terms, immigration from Romania appears to have increased the number of births by about 2%.Footnote 31
Effect of immigration on native births (continuous treatment)
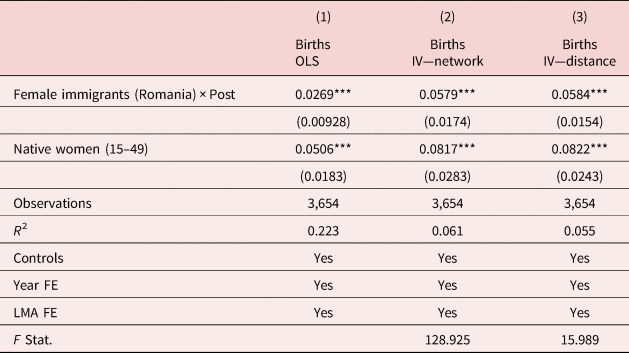
Notes: Authors' elaboration on ISTAT dataset. Controls include yearly age-specific population shares, per-capita income, child-care services, and the employment rate in 2006. Data on per-capita income comes from the Ministry of Finance which uses an older classification for the LMAs, so data on the per-capita income of “Corigliano-Rossano” (1845) LMA are missing. Model in column 1 refers to a DiD with a continuous treatment estimated with an OLS method. Models in columns 2 and 3 refer to a DiD with a continuous treatment estimated with a 2SLS method. In column 2, the IV is the shift-share instrument explained in equation (3). In column 3, the IV is based on the distance to gateways of entry as explained in equation (4). The reported F Statistics is the Kleinbergen–Paap rk Wald F statistics. Table C 1 in Annex C shows the first-stage regression coefficients. Robust standard errors are clustered at the LMA level.
*p < 0.10, **p < 0.05, ***p < 0.01.
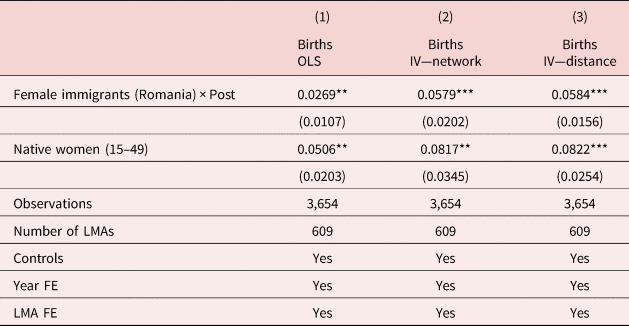
As discussed above, in order to deal with the possible endogeneity of immigration, we implement an IV approach using a slightly different version of the instrument à la card. The results are presented in column 2 of Table 4. The two-stage least squares (2SLS) coefficient remains positive and significant, and of similar magnitude—confirming that immigration from Romania after 2007 have positively affected native fertility. The direction of the bias appears to be downward, as the observed increase in the number of immigrants after 2007 might be the result of an emersion effect of the policy and it might not represent an actual increase in the supply of domestic services. Therefore, our results should be interpreted as a lower bound of the true effect.
Effect of immigration on native births (bootstrapped standard errors)
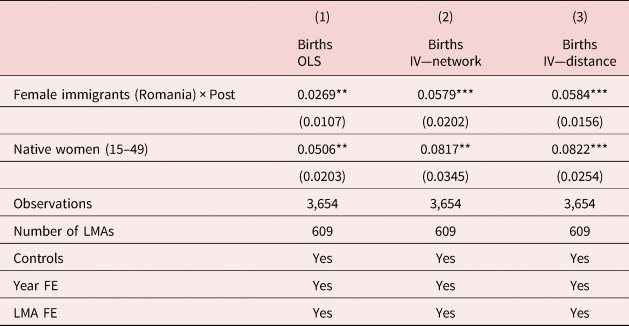
Notes: Authors' elaboration on Istat data. Controls include yearly age-specific population shares, per-capita income, child-care services, and the employment rate in 2006. Data on per-capita income comes from the Ministry of Finance which uses an older classification for the LMAs, so data on the per-capita income of “Corigliano-Rossano (1845)” LMA are missing. Model in column 1 refers to a DiD with a continuous treatment estimated with an OLS method. Models in columns 2 and 3 refer to a DiD with a continuous treatment estimated with a 2SLS method. In column 2, the IV is the shift-share instrument explained in equation (3). In column 3, the IV is based on the distance to gateways of entry as explained in equation (4). The F statistics of the first stage is omitted by the statistical software (Stata) when standard errors are computed with a bootstrap procedure. Bootstrapped standard errors are computed with 200 replications.
*p < 0.10, **p < 0.05, ***p < 0.01.
As mentioned in section 3, in order to address possible identification issues related to the fact that we employ a recent share for the instrument, we have also carried out the estimates using the distance from the gateway of entry of the immigrants as an instrument. The 2SLS coefficient is presented in the last column of Table 3 and it suggests that our estimates are robust both in terms of significance and of magnitude. The first-stage F-statistics drops to 16, but it is still above the customary level of 10.
Moreover, some authors [Jaeger et al. (Reference Jaeger, Ruist and Stuhler2018), Goldsmith-Pinkham et al. (Reference Goldsmith-Pinkham, Sorkin and Swift2020)] indicate that the shares of migrants used in the instrument might be spuriously correlated with the outcome of interest if the latter is serially correlated. In the case of a DiD analysis, what is essential for the identification is that the first differences of the outcome are not serially correlated. The Dickey–Fuller test for autocorrelation reported in Annex B shows that fertility is indeed stationary in the first differences.
Bertrand et al. (Reference Bertrand, Duflo and Mullainathan2004) argue that the estimates of the standard errors, obtained through OLS or 2SLS, of a DiD model whose outcome is serially correlated in the levels are inconsistent. To overcome this problem is possible either to compute standard errors clustered at the level of the unit of analysis or to bootstrap the standard errors. The former is already implemented in our analysis, the results of the latter are presented in Table 4.Footnote 32 The standard errors computed with the two methods are rather similar and do not change the confidence interval of the estimated coefficients. Furthermore, with the use of a bootstrap procedure to compute the standard errors, we avoid making any assumption on the variance-covariance matrix of the residuals. Therefore, our inference method is consistent also in the case of other possible dependence patterns in the error component [Adao et al. (Reference Adao, Kolesár and Morales2019)].
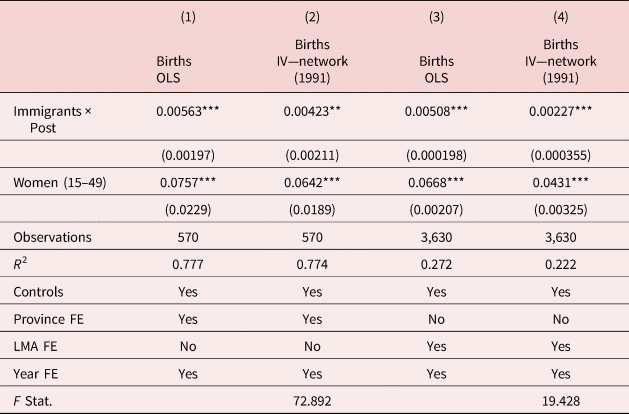
Finally, in Table 5 we present the results estimated at the provincial level using a shift-share instrument based on immigrants' shares from 1991. The coefficient relative to the flow of immigrants is positive and significant. Because we consider here all nationalities and not only women from Romania, the coefficient cannot be directly compared to the estimates presented above. However, we can note that the estimates at the province level (models in columns 1 and 2) imply an increase in births to native women of about 4% close to the results obtained from the other models,Footnote 33 reassuring us that the estimates are robust with respect to the different definitions of the level of analysis. Additionally, the coefficient relative to the flow of immigrant is stable for all the specifications in Table 5, but for the last column, where we use the imputation method proposed by Barone et al. (Reference Barone, D'Ignazio, De Blasio and Naticchioni2016) and we obtain a slightly lower effect.
Effect of immigration on fertility—1991 immigrant shares
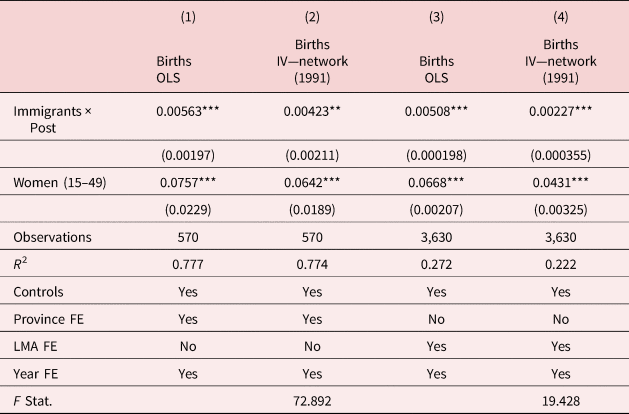
Notes: Authors' elaboration on Istat data. Controls include yearly age-specific population shares, per-capita income, child-care services, and the employment rate in 2006. Models in columns 1 and 2 refer to a DiD with a continuous treatment estimated respectively with an OLS and an IV approach using the 1991-shares by province. Models in columns 3 and 4 refer to a DiD with a continuous treatment estimated respectively with an OLS and an IV approach using the 1991-shares by the LMA. The reported F statistics is the Kleinbergen–Paap rk Wald F Statistics. Robust standard errors are clustered at the LMA level.
*p < 0.10, **p < 0.05, ***p < 0.01.
In conclusion, the results look very robust across different estimations using a variety of instruments, indicating that the unexpected flow of Romanian women specializing in personal services did generate a sizable increase in the fertility of native women.
5. Robustness
In a DiD framework, the parallel-trend assumption is fundamental—treated and untreated units must share a common trend in the pre-treatment period. In this section, we test for this hypothesis.
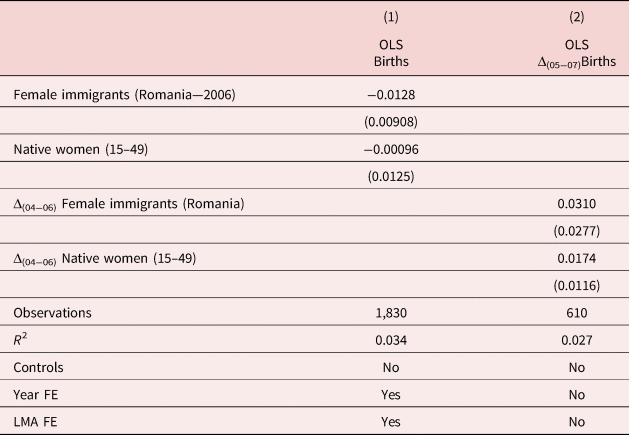
To this aim, we carry out two tests. In the first, we estimate equation (2) for the pre-treatment period only. In particular, we estimate the model for the period from 2005 to 2007, considering 2007 as the treatment year.Footnote 34 The results for the OLS are presented in column 1 of Table 6 and show that the placebo treatment is not significantly linked to any change in the fertility observed in the pre-treatment years.
Parallel trend and placebo test for the DiD model with a continuous treatment

Notes: Authors' elaboration on Istat data. Column 1 refers to a DiD model computed on the years 2005–2007 and considering 2007 as the post-treatment year. Column 2 refers to a linear regression model in which the dependent variable is differentiated over the years 2007–2005 and the covariates are differentiated over the years 2006–2004. In column 1, errors are clustered at the LMA level. Robust standard errors in parentheses.
*p < 0.10, **p < 0.05, ***p < 0.01.
The second test consists of estimating a linear regression model in which both the dependent variable and the covariates are differentiated over the pre-treatment years. The results are shown in the second column of Table 6 and suggest that the variation in the number of births is not correlated with the variation in the female immigrant population in the pre-treatment period.
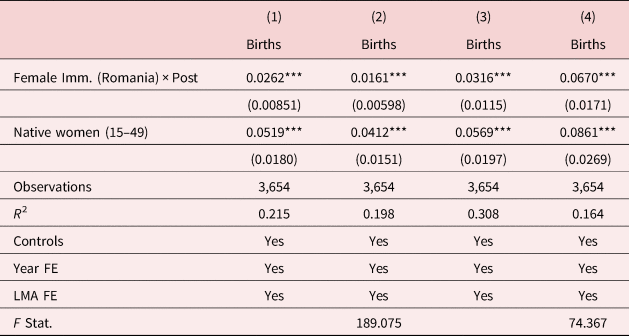
In equation (2), we have assumed a lag of 1 year in the impact of the treatment on the outcome variable, on the base of the obvious consideration of the duration of the pregnancy. However, as some of the effect of the inflows of Romanian women might have happened already in 2007, as a further test we estimate the DiD model with no lags in the treatment variable. The results are presented in the first two columns of Table 7.
Estimation results of the DiD with a continuous treatment (no lag)
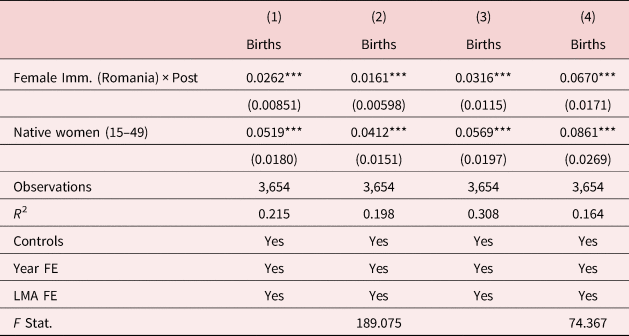
Notes: Authors' elaboration on Istat data. In columns 1 and 2, the post-period is from 2007 onward. In columns 3 and 4, the post-period is from 2008 onward and 2007 is excluded from the analysis. Controls include yearly age-specific population shares, per-capita income, child-care services, and the employment rate in 2006. Data on per-capita income comes from the Ministry of Finance which uses an older classification for the LMAs, so data on the per-capita income of “Corigliano-Rossano (1845)” LMA are missing. Robust standard errors are clustered at the LMA level.
*p < 0.10, **p < 0.05, ***p < 0.01.
The coefficient of the treatment variable is positive and significant but of substantially smaller magnitude with respect to the estimates obtained using the lagged variable. These results indicate that although some effect of the large immigration flows of Romanian women might have affected the number of births in the same year of their arrival, the largest part of the impact appears to have happened with a lag, as it is reasonable. Therefore, our preferred estimates remain those obtained lagging the immigrant flows by 1 year.
As a further test, we estimate the DiD model with a continuous treatment by excluding 2007 from the analysis. In this case, births occurred in 2005 and 2006 refer to the pre-period and are compared to births occurred in 2008–2010, the post-period. The results—presented in columns 3 and 4 of Table 7—are robust both in the significance and in the magnitude of the coefficients and confirm our preferred estimates.
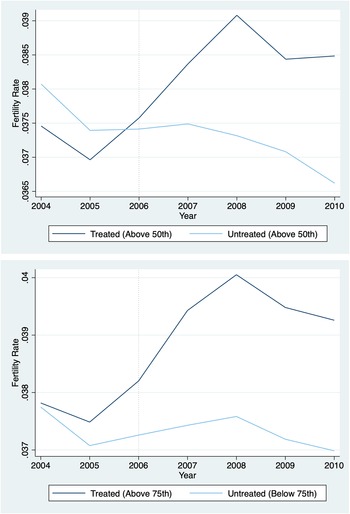
As a further informal test on the pre-treatment period, we give a simple graphical representation of the raw data. In order to compare treated and control groups, we consider again the binary treatment and we divide LMAs according to the median or the 75th percentile of the distribution of immigrants from Romania in 2006. Figure 5 depicts the fertility rate by year for the treated and control groups. In the upper panel, LMAs are divided between treated and not treated according to the median of the shares of immigrants from Romania in 2006, whereas in the lower panel they are separated according to the 75th percentile.
Parallel trends.
Notes: Authors' elaboration on Istat data. The graph shows the average fertility rate for treated and untreated LMAs. The former are LMAs hosting a share of immigrants from Romanian in 2006 greater than the 50th (or 75th) percentile and the latter are LMAs hosting a share of immigrants from Romanian in 2006 lower than the 50th (or 75th) percentile.

Figure 5 shows that at the beginning of the period of analysis, the two groups of LMAs were on the same path and they seem to diverge after 2006—so contemporaneously with the flows of immigrants from Romania. A final concern might be relative to selective native migration. If women (and their families) desiring to have (additional) children move to areas where there is a relatively large supply of domestic service providers, this might lead to an upward bias in the estimates.
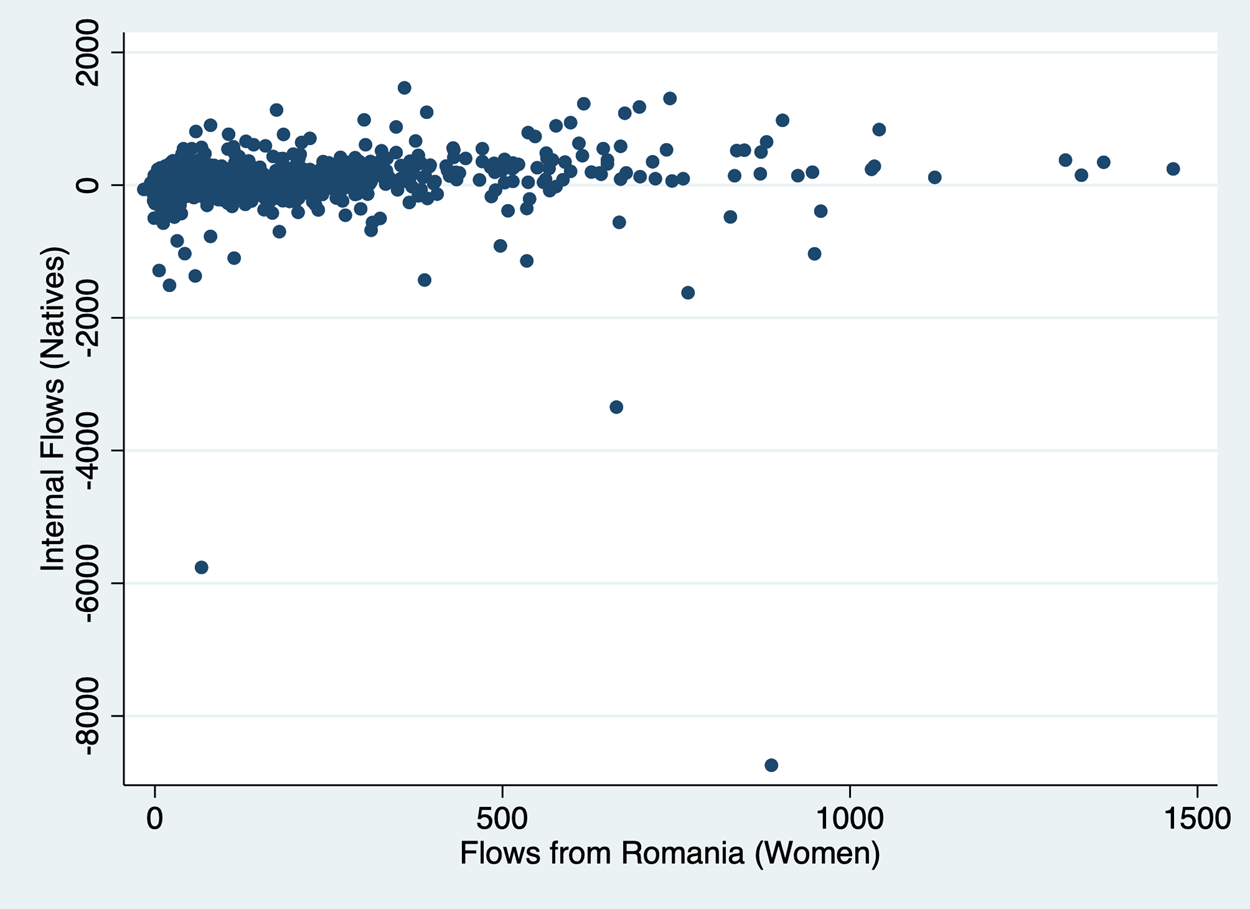
In our case, this does not seems to be a serious threat to the estimation. As shown in Figure 6, which plots the internal flows of natives against the flows of Romanian women from 2007 onward, it does not appear to be any correlation between the internal flows of natives into an LMA and the arrival in the same LMA of Romanian women.Footnote 35
Correlation between internal native flows and flows from Romania (2007–2010).
Notes: Authors' elaboration on Istat data. Internal native flows are computed as inflows from other LMAs minus outflows to other LMAs. Flows of Romanian women are computed as the LMA variation in the stock of female immigrants. Observations associated with the top 1 percentile of the post-treatment distribution of immigrant flows are dropped from the graph.

6. Heterogeneity by area and over time
Italy is far from being a homogeneous country, being characterized by large cultural and economic differences. Therefore, it is of interest to assess whether the impact of immigrant flows on fertility is homogeneous across the country or, on the contrary, differentiated by area.
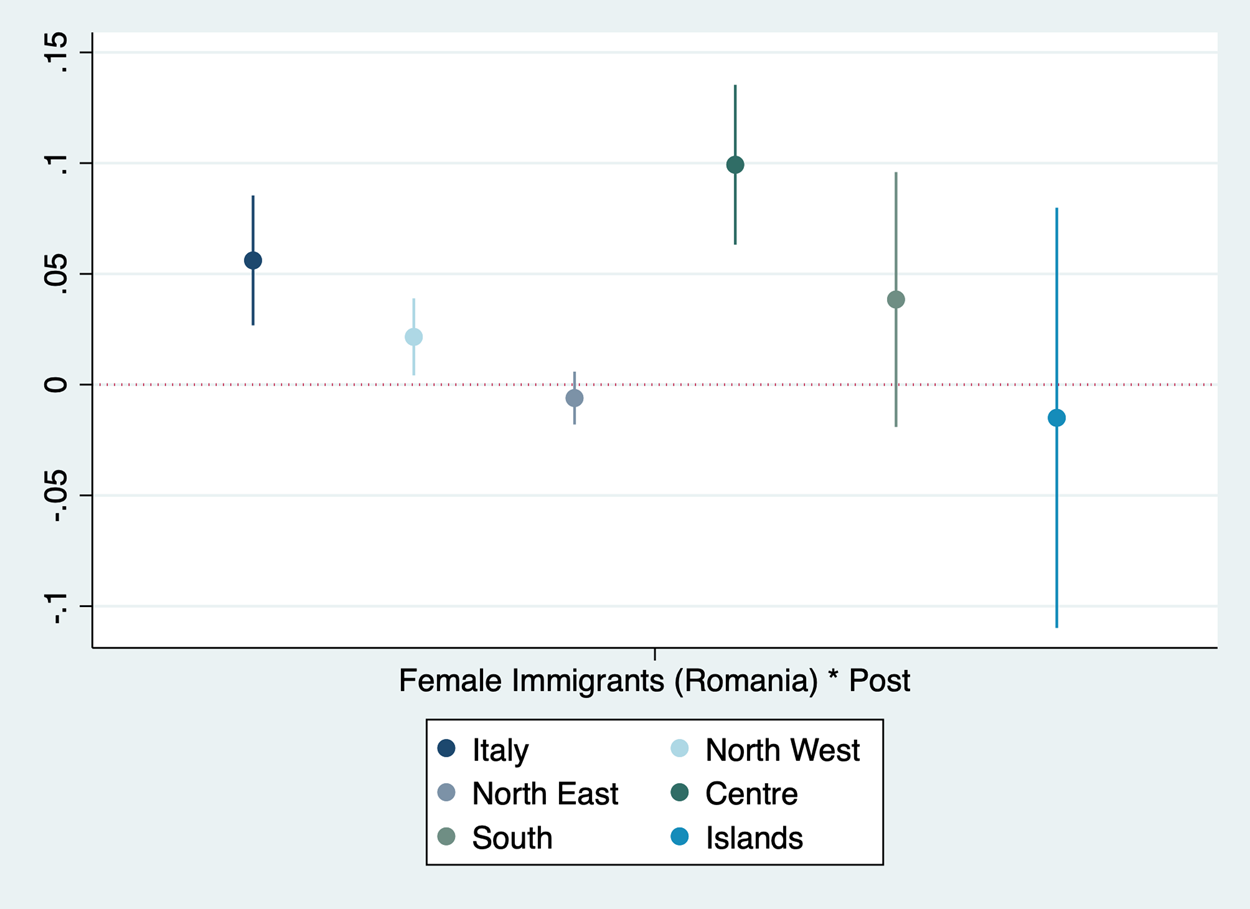
To this aim, we group the LMAs according to the NUTS1 classification and aggregate them into five macro areas—North East, North West, Center, South, and Islands—and we estimate separate regressions for each of them. These areas are characterized by large differences in both labor market opportunities and immigration patterns.Footnote 36 The coefficients obtained by 2SLS estimates, presented in Figure 7 along with their standard errors, indicate that the average impact observed at the national level is at closer inspection highly differentiated across the country. In fact, only in two areas—namely Center and North West—we observe a positive impact of immigration flows on fertility: they are, not surprisingly, the areas where the flows of new immigrants are concentrated.Footnote 37
Regression coefficients by macroarea.
Notes: Authors' elaboration on Istat data. Point estimates of 2SLS regression models by macroarea (NUTS1). See Table E1 in Annex E for the regression outputs.

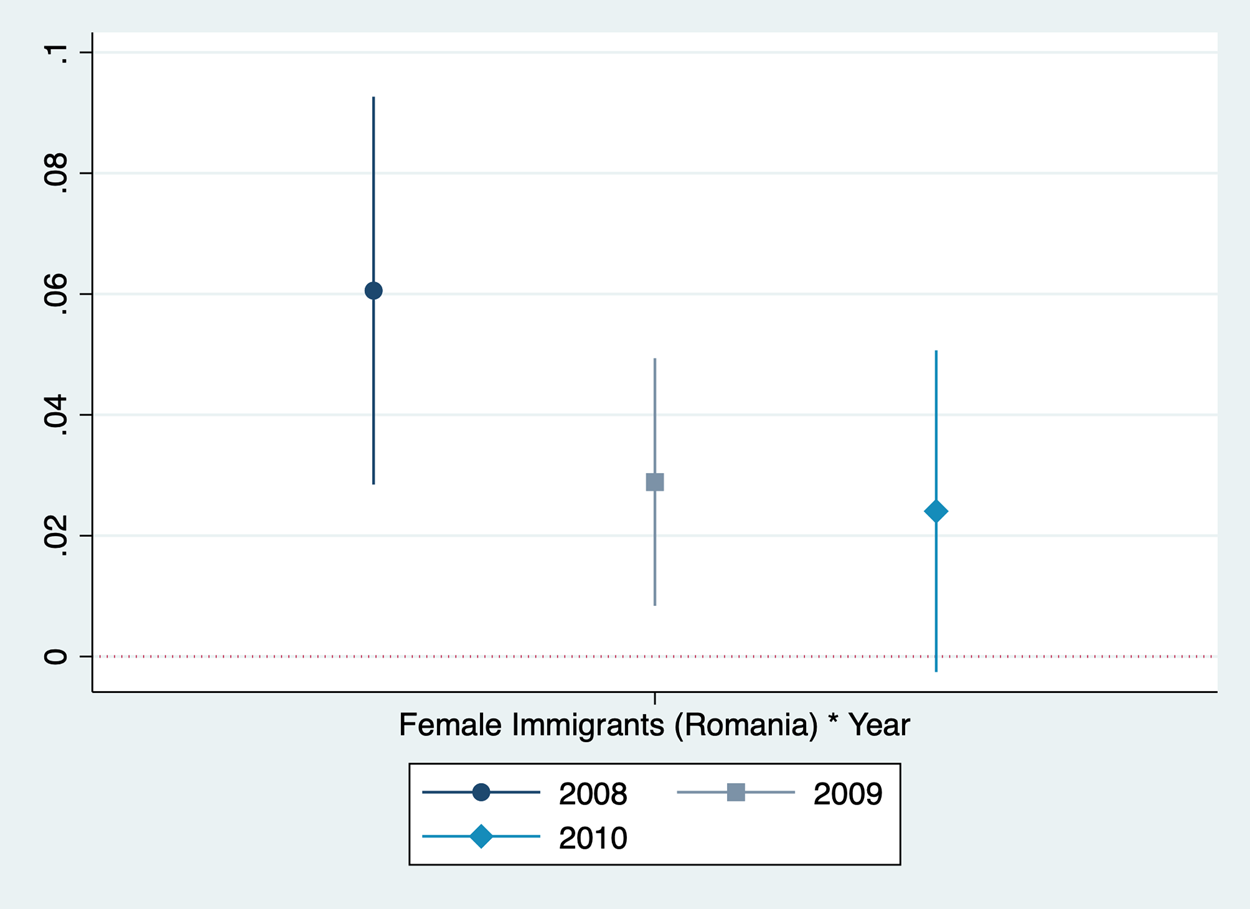
To assess the possible heterogeneity of the effect also over time, we estimate a variant of an event regression by estimating three different DiD models considering one single post-treatment year at a time. The coefficients of the flows of women from Romania are plotted in Figure 8 and show that the impact has been notably higher the year after the enlargement and declining thereafter, indicating that the effect was temporary and limited to the impact of the first large wave of immigrants.
Regression coefficients by year.
Notes: Authors' elaboration on Istat data. Point estimates of 2SLS regression models by post-treatment year. See Table E2 in Annex E for the regression outputs.

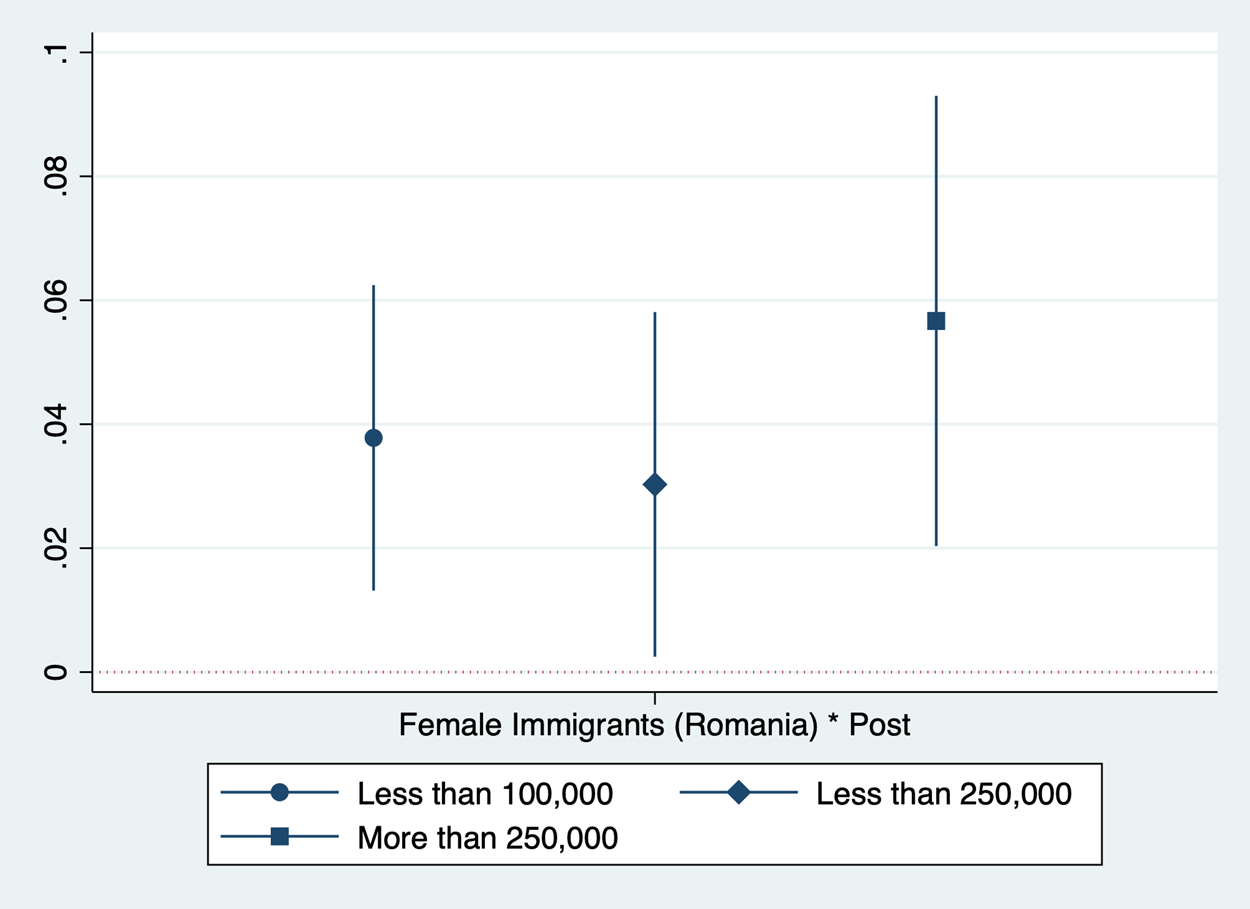
We also looked at possible differences in the impact by the LMA size. Areas with a different population size are characterized by diverse cultural and social characteristics affecting fertility choices,Footnote 38 as well as by varying access to children relevant services. Therefore, we estimate equation (2) separately by the decile of populationFootnote 39 and by dividing the LMAs in three groups, characterized, respectively, by less than 100,000 inhabitants, less than 250,000 inhabitants, and more than 250,000 inhabitants. The results, presented in Figure 9, indicate that, despite the heterogeneity of the LMAs with respect to the population size, the impact of immigrant flows on fertility has been homogeneous across areas.
Regression coefficients by population size.
Notes: Authors' elaboration on Istat data. Point estimates of 2SLS regression models by population size. See Table E3 in Annex E for the regression outputs.

7. Children's human-capital accumulation
As mentioned above, a change in the cost and/or availability of child care can affect both the number and the “quality” of children. Without specific restrictions, the theory does not allow for a clear-cut prediction. In this section, we present some initial results on the possible effect of immigrants specializing in domestic services on the “quality” of children.Footnote 40 As we shall discuss, data limitations allow us only to estimate some reduced form models without the possibility of identifying the transmission channels. Nonetheless, before proceeding to an estimation of the impact on human capital accumulation as proxied by test scores, we begin our discussion looking at changes in time devoted to child care by native women.
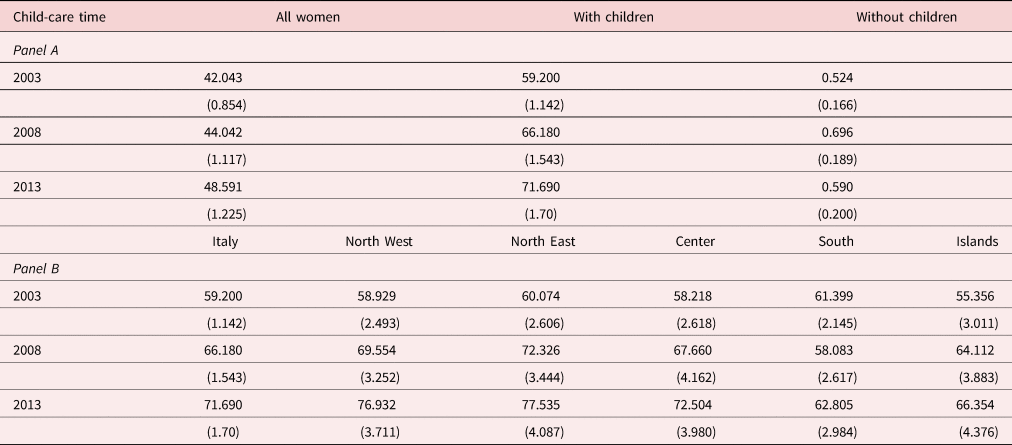
Every 5 years, Istat collects data on the time allocation by the households through a survey containing a daily diary where households' members note down every activity carried out during a day. Data are available from 2003 until 2013; therefore, they are well suited for our case study. In this period, minutes per day devoted to child care increased from 42.0 to 48.6 min, an increase of almost 16%. Unfortunately, the survey is a repeated cross section and we cannot separate the intensive and the extensive margin of time allocated to child care, but we observe that in 2013 women with children devoted 12.5 more minutes a day to child care with respect to 2003 (see panel A of Table 8), an increase of more than 20%. Focusing on this latter group, we note that the increase has been more pronounced in the North West, whereas in the South daily child-care activities relatively decreased during the period of analysis (see panel B of Table 8).
Time use trends of women aged 15–64

Notes: Authors' elaboration on Istat data. Data are from the survey “Multiscopo sulle Famiglie: Uso del Tempo” (https://www.istat.it/it/archivio/216733). The figures include time spent in basic child care—such as physical care and looking after children—and interactive/recreational child care—such as reading, playing, and teaching to children—as main activity reported by the respondent. The group of interest is women aged 15–64 that have completed the daily dairy.
Without any claim of causality, these data show that during the period considered there was a non-negligible reallocation in the use of time by women. Unfortunately, individual data with the necessary geographic disaggregation are not available and this does not allow us to test for any direct effect of immigration on time use and therefore to identify possible channels through which immigration might have affected the quality of children. We can, however, look at some indicator of children's human capital to see whether we can eventually identify an impact of immigration on it.
To approximate children's human-capital accumulation, we use data on test scores provided by the National Institute for the Evaluation of the Education and Training System (INVALSI). Each year, INVALSI runs a nationwide standardized learning test. The test, relative both to mathematics and to reading, is submitted to children enrolled in the second and fifth grades of primary school, the third grade of lower secondary school, and the second grade of upper secondary school. We use the test results for the second year of primary school, which corresponds to the 2nd grade (the earliest grade for which tests are available). We corrected the test scores to take into account the possible cheating.Footnote 41 The data on test scores are available only at the provincial level and, therefore, we carry out the analysis at this level of aggregation.
In particular, we use the data for the school years from 2012/2013—the first year a 7-year-old child born in 2005 might be enrolled in the second gradeFootnote 42—to 2017/2018—the last year for which data are available. We exclude from the analysis children born in different years than those of the main analysis and we consider only children born in Italy from native-born mothers. Furthermore, we follow the same DiD approach discussed above to assess if the same cohort of children experienced different levels of human-capital accumulation depending on their exposure to large immigration flows. The equation has been estimated by OLS because it hardly reasonable to imagine a demand-pull effect on immigrants due to the demand for human capital investment, once we have controlled for a large set of parents' background characteristics.
We use as dependent variable the test scores for both mathematics and reading, standardized so that they have zero mean and unit variance. The number of women from Romania are aggregated at the province level and expressed as share of the province female population aged 15–49. We include in the regressions also some students and mothers' characteristics that are shown to have an influence on the test scores by the existing literature, such as student's gender and age (in months), kindergarten and pre-primary school attendance, and mother's education level and working status. We applied the inverse hyperbolic sine transformation to the test scores and immigrant ratio, so that the estimated coefficients can be interpreted as an elasticity.Footnote 43
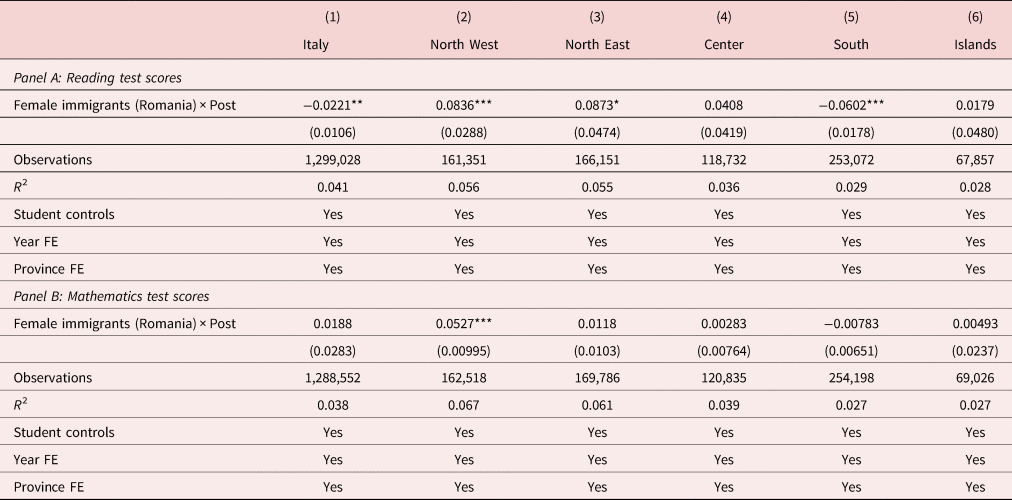
The estimates of the coefficient of immigrant women from Romania are reported in Table 9. The dependent variable in panel A is children's test score in reading (Italian), the dependent variable in panel B is children's score in mathematics. To investigate whether the different trends in time use across macro areas in Italy are also reflected in the effect of immigrant supply of domestic services on children's human capital, we run separate regressions for each macro area.
Estimation results of the DiD on human capital accumulation of young children

Notes: Authors' elaboration on INVALSI and Istat dataset. We use the inverse hyperbolic sine transformation for the number of female workers from Romania and standardized test scores. Test scores refer to children born between 2005 and 2010 and enrolled in grade 2 in the school years 2012/2013–2017/2018. Children born before 2007 (December 31st) are in the pre-treatment period. Individual controls include gender, age (in months), kindergarten and pre-primary school attendance, mother's education level and working status. Robust standard errors are clustered at the province level.
*p < 0.10, **p < 0.05, ***p < 0.01.
At the national level, there does not appear to be any significant impact of immigrants on test scores. However, when we look at the different areas of the country, we can identify some significant heterogeneous effects. Indeed, the number of female immigrants from Romania appears to exert a positive effect on both reading and mathematics test scores in the North West. In the South, on the contrary, we find a negative impact on reading scores, whereas the other areas of the country appear to be unaffected.
In conclusion, we can identify some impact of the presence of migrants specializing on domestic services on human capital accumulation. These effects, although not significant at the national level, appear to be differentiated by area with opposite signs between North and South. Although the trends in time allocations are somehow suggestive of possible channels through which this effect might have taken place, further research to be carried when data will become available will be necessary to an actual identification of the possible channels. Clearly, the mechanism that drives these effects deserves more research which is beyond the scope of the present paper.
8. Conclusions
The availability of workers providing services that substitute or complements parental (and especially mothers') time in child rearing might reduce the cost of children and possibly increase fertility. Recently several countries have experienced large inflow of low-skilled migrants specializing (also) in the provision of personal services. A few studies have been devoted to analyze the effects of immigrants providing household services on female native behavior, concentrating mainly on the impact on labor supply. Only two studies, to our knowledge, have been focusing on fertility choices yielding contradictory results.
In this paper, we provide novel evidence of the impact on native fertility of large flow of immigrants providing household services. In particular, we exploit the natural experiment generated by the unexpected opening of the Italian border in 2007 to workers coming from “new” EU countries. A large number of migrants entered Italy at that time and a many of them, especially Romanian women, worked in the personal service sector. In order to identify the causal impact of migration flows on native fertility, we use an array of identifying approaches. The results obtained through the different instruments used are consistent qualitatively and quantitatively, indicating that in LMAs that received relatively more immigrants specializing in personal services the number of births increased by about 2–4%, an economically meaningful impact. All the areas, independently from the population density, experienced such a positive increase in fertility. At the same time, the effect has been larger in the areas of the country where immigrants concentrated most and right after the mass arrival in 2007.
We looked at the impact on children's quality and, in particular, to human capital accumulation. The results indicate that, overall, there is no significant impact of the increase of immigrants specializing in domestic services on test scores. However, there are area heterogeneous effects with North West showing an increase in test scores and, for reading only, a negative effect on the South. Data limitations have not allowed us to identify the mechanisms behind such effects if not in a suggestive way and further research is needed in this area.
The evidence relative to the efficacy of family policies on fertility is, at most, rather inconclusive offering a large spectrum of results differentiated across the different policy interventions.Footnote 44 Also, on the more specific measures relative to the provision of child-care services, the evidence is far from univocal both qualitatively and quantitativelyFootnote 45 as it is the case for the role of marketization of child care.Footnote 46 Our results indicate that access to child-care services, even if provided at market prices, does have a positive impact on fertility and, therefore, providing services that help to substitute or complement parental (still mainly maternal) child-care time represents a possible avenue to counteract the current tendency to fertility reduction in many high-income countries.
Supplementary material
The supplementary material for this article can be found at https://doi.org/10.1017/dem.2021.28.
Acknowledgments
We thank Alessandro Cigno, Albrecht Glitz, and Giovanni Peri for their valuable comments. Special thanks go to the Editor and two anonymous referees for their guidance in the revision process. We are extremely grateful to Alessandra Pasquini who contributed to the initial steps of this paper before leaving for a new career. Without her cooperation the project would not have born.