


I. INTRODUCTION
The Network of Excellence TARGET (‘Top Amplifier Research Group in an European Team’) was created with the aim of demonstrating effective collaboration among Research Groups in Europe in the frame of cutting-edge microwave and millimeter wave technologies. The Work Package named WiSELPAS (‘From Semiconductors to Linearised Wireless Power Amplifiers’) pursued the fabrication of different power amplifiers starting from the device fabrication [Reference Lavrador and Pedro1].
One of the proposed designs was a power amplifier based on an innovative AlGaN/GaN technology. Specific devices were specially designed and fabricated, and the aim was to assess the performance of such devices in power amplifier applications. In this work the first stage of the corresponding work package, composed of a general description of both the technology and a dedicated device nonlinear model, is described. The device was manufactured and characterized by the Institut d'Electronique, de Microélectronique et de Nanotechnologie (IEMN) and the simplified nonlinear model was developed at the Universidad de Málaga (UMA).
The wide-band-gap device technology used and the measurements involved in the device characterization procedure are described in Section II. Sections III and IV are devoted to the linear device model used to develop the nonlinear one. The dedicated nonlinear model is described in Section V, and, finally, a comparison between measured and model-predicted device performance is presented in Section VI.
II. AVAILABLE AlGaN/GaN DEVICE TECHNOLOGY
Wide-band-gap devices are very promising candidates for high-frequency and high-power applications thanks to the high voltage and current capabilities. Nitride-based HEMTs have been fabricated since several years at TIGER, a common laboratory between III-V lab and IEMN. AlGaN/GaN prototypes for microwave power amplification are usually fabricated from epitaxial stacks on silicon carbide or silicon substrate. Single crystal semi-insulating silicon carbide (4H or 6H) is the most suitable substrate material due to its lower mismatch with GaN and very good thermal conductivity (450 W/K·m), but it is still very expensive.
A) Fabrication
The devices were processed on an AlGaN/GaN epilayer grown by III/V lab on a SiC substrate. Device fabrication starts with ohmic contacts formed by rapid thermal annealing of evaporated Ti/Al/Ni/Au. The mesa isolation is obtained from multiple He+ ions implantations. Then, different gate lengths are achieved, defined by e-beam lithography based on a bi-layer resist the lift-off becomes easier. Gate deposition was performed by e-gun evaporation of a Mo/Au bi-layer. Finally the passivation step was done using SiN/SiO2 layers.
B) Characterization
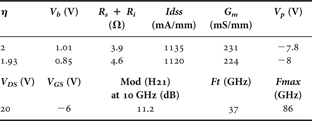
The fabricated samples (8 × 50 × 0.25 µm2) were measured under microwave probes (GSG). In order to extract the nonlinear equivalent scheme, pulsed I–V (pulse width 300 ns, period 10 µs) for several quiescent bias points were performed [(V DS0, V GS0) = (0, 0), (0, −9), (15, −9) and (20, −9) V]. Then, multi-biased pulsed S-parameters for two quiescent bias points [(V DS0, V GS0) = (20, −5), (20, −6) V] were performed up to 20 GHz for the same pulse conditions. A brief overview of the characteristics of these samples is presented in Table 1. Figure 1 shows MAG-MSG measured at different bias conditions.
Maximum stable gain and maximum available gain of the device for several bias conditions (V DS = 20 V, V GS from −9 to 0 V).

GaN samples characteristics.
Large signal measurements were carried out at 4 GHz using a Large Signal Network Analyser. These measurements are useful to check nonlinear model accuracy and also to validate epitaxy quality and technological steps. At 20 V the maximum output power density is equal to 4.4 and 6 W/mm with a drain source voltage of 20 and 30 V, respectively.
III. LINEAR CIRCUIT MODEL
The linear circuit model used to simulate the small-signal behavior of the device is shown in Fig. 2. The topology of this circuit is based on some preliminary simulation efforts that suggested which elements were really significant for modeling the small-signal behavior of the device.
Linear circuit model for simulating the small-signal behavior of the device (τp = R pg · C pg = R pd · C pd).

In particular, parasitic RC branches were required to properly simulate the pinched-off measurements under ‘cold’ bias conditions (V DS = 0 V). These two branches were introduced to cope with some isolation problems under dynamic conditions. Both RC branches have the same relaxation time, i.e. τp = R pgC pg = R pdC pd. It should be mentioned that R s and L s have not been included in the circuit due to their small values, obtained when simulating the device under ‘cold’ bias conditions. Resistors R g and R d are considered linear elements. Therefore the extrinsic part of this linear circuit model is composed of only seven elements, namely L g, L d, C pg, C pd, τp, R g, and R d. The extrinsic element values were extracted from S-parameters using the standard procedure based on ‘cold’ measurements. First, the values for L g and L d were consistently extracted from measurements for high values of V GS; next, the remaining element values were obtained by fitting the pinched-off S-parameters. The obtained values for these extrinsic elements are shown in Table 2.
Extracted values for parasitic elements.

For the intrinsic part of the device a standard quasi-static-circuit model with only six elements (C gs, C gd, C ds, G m, G ds, and τm) that provides a reasonable fitting to the measured S-parameters was chosen. The values of these intrinsic elements are extracted from pulsed S-parameter measurements by an optimization routine while keeping the extrinsic element values fixed. An illustrative example of the fitting provided by this linear circuit model is shown in Fig. 3.
Measured (o) and model-predicted (continuous line) S-parameters under pulsed bias conditions (V DS = 12 V, V GS = −3 V, from quiescent bias point V DS0 = 20 V, V GS0 = −5 V).

IV. BIAS DEPENDENCE OF THE LINEAR CIRCUIT MODEL
In order to identify the main nonlinearities present in the device, the bias dependence exhibited by the intrinsic elements was investigated using the available pulsed S-parameter measurements for one available quiescent bias point [(V DS0, V GS0 = (20, −5) V]. The extracted model element values as a function of bias results are shown in Fig. 4. The fitting error is almost uniform and takes reasonable values for all the points in the used bias grid. This confirms the capabilities of the proposed linear circuit model.
Bias dependence of intrinsic small-signal model elements (0 V < V DS < 15 V); quiescent bias point V DS0 = 20 V, V GS0 = −5 V.

The bias dependence exhibited by the intrinsic elements suggests that the main nonlinearities are C gs, G m, and G ds, and therefore that a simplified nonlinear circuit model, valid for the region in the I DS–V DS plane where the load-line will be located, could be obtained by keeping C gd, C ds and τm bias independent. Their corresponding values were then calculated by averaging the extracted values for the V DS ‘window’ used in the subsequent large-signal characterization (11 V < V DS < 15 V), and they are shown in Table 3.
Final values for the ‘linearized’ intrinsic circuit model elements.

V. NONLINEAR CIRCUIT MODEL
After the approximations described in the previous section, the simplified nonlinear circuit model consists of only two nonlinear elements: the gate-source capacitance (C gs) and the drain-source current source (I DS), from which G m and G ds are derived.
A) Gate-source capacitance nonlinear model
It is clear from Fig. 4 that capacitance C gs is mainly controlled by V GS, since the influence of V DS is very mild. This fact is used to further simplify the nonlinear model. The values for this capacitance have been calculated by averaging, for each V GS, the values for different V DS bias.
To model the variation of C gs with V GS, the C gs nonlinear model proposed by Fager et al. [Reference Fager, Pedro, Carvalho and Zirath2], and already used for modelling GaN HEMTs [Reference Cabral, Pedro and Carvalho3, Reference Cabral, Pedro and Carvalho4], was selected. This model is described by (see [Reference Cabral, Pedro and Carvalho4] for a detailed explanation of model parameters)

The simulation provided by this model, using the parameter values contained in Table 4, is depicted in Fig. 5.
Measured (•) and predicted (continuous line) C gs(V GS) values using Fager's model for capacitance. Dotted lines indicate 95% confidence prediction-bounds.

Final values for Cg s0 nonlinear model parameters.

B) Drain-source current (I DS) nonlinear model
The parameter extraction procedure for this element is mainly based on the proper fitting of the measured small-signal transconductance in the saturation region for a representative V DS value. The employed model must be able to simulate the measured ‘shape’ of the transconductance G m as a function of V GS (see Fig. 4). This result is consistent with that obtained by Cabral et al. for a different GaN HEMT [Reference Cabral, Pedro and Carvalho3], who pointed out the asymmetric behavior of such a variable – i.e., a sudden rise near turn-on followed by a smooth decrease toward 0 V. Therefore, and following [Reference Cabral, Pedro and Carvalho3], the nonlinear current model proposed in [Reference Cabral, Pedro and Carvalho4] was adopted. Model equations, and a detailed description of their parameters, can be found in [Reference Cabral, Pedro and Carvalho3] and [Reference Cabral, Pedro and Carvalho4]. They are partly reproduced again here for the sake of completeness:

The extraction of the parameter values of this model can be performed by fitting the measured small-signal transconductance G m as a function of V GS for a certain value of V DS in the saturation region. Table 5 presents the obtained model parameter set for V DS = 12 V where β*, α*, and V T are the parameters that depend on V DS. Parameters β* and α* are given by Equations (3) and (4) while V T is in this case almost bias independent, i.e. γ = 0.


Extracted parameter values for current source ID S (VG S, V DS) for V DS = 12 V.

The fitting of G m provided by this model is shown in Fig. 6. Also shown in this figure are the higher order derivatives

and

computed from the model. It is clear in this figure that the simulation of G m provided by this model is rather good.
Measured and modeled (•) G m(V GS) and model-predicted G m2 and G m3 for V DS = 12 V as a function of V GS.

In a second step, and in order to investigate the influence of V DS, the model parameters not depending on this voltage were kept fixed, and the other three were extracted for different V DS values (from 10 to 15 V) by fitting the corresponding measured small-signal transconductance G m. The obtained model parameter set is shown in Table 6.
Extracted parameter values for drain current source I DS (V GS, V DS) for different V DS values.

Although the fitting provided by this model for different V DS values can be considered good, it slightly deteriorates as V DS separates from 12 V, the V DS value used to extract the other parameters.
Parameter values presented in Table 5 provide some interesting information concerning their dependence on V DS. In particular, V T is almost constant, which is consistent with the conclusion obtained by Cabral et al. [Reference Cabral, Pedro and Carvalho3] since they use a zero value for γ in the model. Therefore, the value obtained for V DS = 12 V is assigned to this parameter V T. The influence of V DS on α* is not so clear but, following the linear dependence (α* = αV DS) proposed in the model, the value α = 0.1396 V−1 was obtained from data linear regression. The behavior of β*, as a function of V DS, almost follows the linear dependency proposed by the model. Again, a linear regression of the data yields values for β (143.1 mAV−2) and λ (0.0101 V−1).
VI. EVALUATION OF THE NONLINEAR CIRCUIT MODEL
Before using the nonlinear model to predict the performance of the device under nonlinear conditions, a ‘tuning’ of the model is required. To do that, the nonlinear model must be used in conjunction with a nonlinear simulation tool. Microwave Office has been chosen for this purpose [5]. The ‘tuning’ procedure is as follows. Firstly, pulsed I–V curves are used to optimize I DS model parameters using the parameter values obtained in the previous section as the starting point. A comparison between measured (pulsed) and simulated I–V curves is shown in Fig. 7.
Measured (pulsed) and model-predicted I DS current source (V GS = −9 to −1 V).

Secondly, measured pulsed S-parameters corresponding to the quiescent bias point to be employed for large-signal measurements are used to calculate optimum values for the capacitance's model and to estimate the value of an added drain-source RC branch to account for some residual output conductance low-frequency dispersion.
Finally, two additional elements (diodes) are added to the gate-source and the source-drain branches to provide the model with some capability to simulate forward conduction phenomena. The resulting nonlinear model is depicted in Fig. 8. Final model parameter values can be found in [Reference Martín-Guerrero, García, Ng-Molina, Mediavilla, Camacho-Peñalosa, Ducatteau and Gaquière6].
Simplified nonlinear circuit model schematic.

This model was evaluated under both linear and nonlinear conditions. To illustrate its simulation performance under linear conditions, the measured and model-predicted small-signal power gains as a function of the frequency are depicted in Fig. 9. To illustrate its performance in the nonlinear regime, the measured and model-predicted output powers as a function of the source available power when the device is loaded with ΓL = 0.193∠68° at the fundamental frequency (4 GHz), and with 50 Ω at higher harmonics, are shown in Fig. 10. In addition, measured and model-predicted output waveforms for a given input power (1 dB compression point) are depicted in Fig. 11. In all cases the agreement between experimental and simulated performance is considered to be reasonably good within the limitations of the developed model.
Small-signal power gain measured (green) and simulated (blue) at f 0 = 4 GHz for V DS = 20 V, V GS = −5 V.

Measured (cyan) and simulated (blue) gain and measured (green) and simulated (magenta) output power as a function of the source available power at f 0 = 4 GHz for V DS = 20 V, V GS = −5 V.

Measured (*) and model-predicted (continuous line) drain current (mA) and voltage waveforms at 1 dB compresion point (f 0 = 4 GHz, V DS0 = 20 V, V GS0 = −5 V).

The described model has been employed to design a low-distortion power amplifier which was manufactured and characterized. Details of this work can be found in [Reference Martín-Guerrero, García, Ng-Molina, Mediavilla, Camacho-Peñalosa, Ducatteau and Gaquière6].
VII. CONCLUSION
The development of a nonlinear model for a given device is not an easy task, especially if the device is a power device based on a new technology such as GaN HEMTs. The aim of this work wasto describe some aspects of the fabrication and nonlinear modeling of a GaN HEMT to be used in the design of a power amplifier. Some particular aspects of the modeling of such devices have been identified and taken into consideration when developing a simplified dedicated nonlinear model. Comparison between experimental and model-predicted performance, under linear and nonlinear regimes, indicates that the developed model is good enough to be employed in a preliminary power amplifier design, although self-heating phenomena have not been properly modeled.
ACKNOWLEDGEMENT
This work was partially supported by the EU network TARGET “Top Amplifier Research Group in a European Team” (IST-1-507893-NOE) and by the Junta de Andalucía (Regional Government of Andalusia, Spain) under project P07-TIC-02649.
 Teresa M. Martín-Guerrero was born in Málaga, Spain. She received the Licenciado en Ciencias Físicas degree (M.Sc. equivalent) from the Universidad de Granada, Granada, Spain, in 1990, and the Doctor Ingeniero de Telecomunicación degree (Ph.D. equivalent) from the Universidad de Málaga, Málaga, Spain, in 1995. Her doctoral dissertation focused on distributed effects and modeling of field-effect transistor (FET)-type devices. In 1991 she joined the Departamento de Ingeniería de Comunicaciones, Universidad de Málaga, as an Assistant Professor, and in 1999 became an Associate Professor. Her current research activities deal with microwave and millimeter-wave device modeling, and differential techniques for positioning using global satellite systems.
 Damien Ducatteau was born in Linselles, France, in 1968. He received an engineering diploma from the University of Lille 1 in 1996 and a Ph.D. degree in elecronics at the Institut d'Electronique, de Microélectronique et de Nanotechnologie (IEMN) Laboratory, Villeneuve d'Ascq, France, in 2008.
In 1997, for four years, he was involved with the European Space Agency (ESA) in the ROSETTA project, during which time he developed the RF electronic part and the radar test procedures of the CONSERT instrument. In 2001, he joined the IEMN laboratory, where he was in charge of the microwave and nonlinear test characterization of HEMT AlGaN/GaN devices for the common Laboratory between IEMN and THALES III–V Labs. His research activities include the power behavior of electronic devices and he is mainly involved with nonlinear characterization at high frequencies. He is currently the Head of the technical team that has in charge the common microwave facilities of IEMN since 2006.
 Carlos Camacho-Peñalosa received the Ingeniero de Telecomunicación and Doctor Ingeniero degrees from the Universidad Politécnica de Madrid, Madrid, Spain, in 1976 and 1982, respectively. From 1976 to 1989, he was with the Escuela Técnica Superior de Ingenieros (ETSI) de Telecomunicación, Universidad Politécnica de Madrid, as Research Assistant, Assistant Professor, and Associate Professor. From September 1984 to July 1985, he was a Visiting Researcher with the Department of Electronics, Chelsea College (now King's College), University of London, London, U.K. In 1989, he became a Professor with the Universidad de Málaga, Málaga, Spain. He was Director of the ETSI de Telecomunicación (1991–1993), Vice-Rector (1993–1994), and Deputy Rector (1994) of the Universidad de Málaga. From 1996 to 2004, he was the Director of the Departamento de Ingeniería de Comunicaciones, ETSI de Telecomunicación, Universidad de Málaga. From 2000 to 2003, he was Co-Head of the Nokia Mobile Communications Competence Centre, Málaga, Spain. His research interests include microwave and millimeter solid-state circuits, nonlinear systems, and applied electromagnetism. He has been responsible for several research projects on nonlinear microwave circuit analysis, microwave semiconductor device modeling, and applied electromagnetics.
 Christophe Gaquière is Professor at the University of Lille and carries out his research at the Institut d'Electronique de Microélectronique et de Nanotechnology (IEMN). His topics include design, fabrication, and characterization of HEMTs and HBT devices. He works on GaAs, InP, metamorphic, and GaN HEMTs. His main activities are microwave characterizations (small and large signals between 1 and 220 GHz) in order to correlate microwave performances with the technological and topology parameters. Today, his activities concern the investigation of two-dimensional electronic plasmons for THz solid-state GaN-based detectors and emitters and AlGaN/GaN nano-wires for microwave applications. He was responsible for the microwave characterization part of the common laboratory between Thales TRT and IEMN focus on wide-band-gap semiconductor (GaN, SiC, and Diamond) up to 2007. At the present time he has in charge the Silicon millimeter wave advanced technologies part of the common lab between ST microelectronics and IEMN. Christophe Gaquière is author/co-author of more than 40 publications and 100 publications.



