1. Introduction
RNA functional diversity is coupled with its ability to assemble into complex three-dimensional structures, creating unique sites for catalysis and molecular recognition. The generally hierarchical process of RNA folding, i.e., a tertiary structure occurring through long-range interactions of preformed secondary elements (e.g. hairpin loops), has allowed for independent characterization of secondary and tertiary structures (Brion & Westhof, Reference Brion and Westhof1997; Greenleaf et al. Reference Greenleaf, Frieda, Foster, Woodside and Block2008; Hendrix et al. Reference Hendrix, Brenner and Holbrook2005; Tinoco & Bustamante, Reference Tinoco and Bustamante1999). Tertiary interactions stabilize folded RNA structures (Batey et al. Reference Batey, Rambo and Doudna1999; Butcher & Pyle, Reference Butcher and Pyle2011) and can be categorized into relatively few structural motifs: coaxial helical stacks, kissing hairpins, tetraloop–receptor interactions, A-minor motifs, pseudo-knots, loop–loop interactions and ribose zippers (Hendrix et al. Reference Hendrix, Brenner and Holbrook2005; Tamura & Holbrook, Reference Tamura and Holbrook2002).
The modularity of RNA tertiary structure, i.e., the reconstitution of large RNAs from discrete components (Qin et al. Reference Qin, Sosnick and Pan2001a) has provided hope that we can predict RNA structures from knowledge of individual tertiary interactions. For example, much like predicting the stability of an RNA helix from the known thermodynamics of Watson–Crick base pairs (Serra et al. Reference Serra, Turner, Michael and Ackers1995), we strive to predict the native folded structure from the thermodynamics of tertiary interactions. Therefore, just as knowledge of thermodynamic parameters is crucial for accurate secondary-structure prediction, the same information is required for tertiary structure predictions. Furthermore, characterization of the kinetics of tertiary folding is crucial for determining RNA functionality (Leontis et al. Reference Leontis, Lescoute and Westhof2006; Tinoco & Bustamante, Reference Tinoco and Bustamante1999). Toward this end, individual folding motifs must be characterized, both in isolation and in combination, for a unifying thermodynamic and kinetic description of RNA folding to emerge.
One target of such detailed biophysical characterization has been interactions between GNRA tetraloops (N=any nucleotide, R=A or G) with distal receptor sequences, which are common features in folded RNAs (Costa & Michel, Reference Costa and Michel1995; Michel & Westhof, Reference Michel and Westhof1990). The ubiquitous interaction of the GAAA tetraloop with a highly conserved 11 nt receptor (Costa & Michel, Reference Costa and Michel1995; Michel & Westhof, Reference Michel and Westhof1990) employs even more broadly categorized tertiary motifs, namely the A-minor and ribose-zipper motifs (Abramovitz & Pyle, Reference Abramovitz and Pyle1997; Cate et al. Reference Cate, Gooding, Podell, Zhou, Golden, Kundrot, Cech and Doudna1996a; Doherty et al. Reference Doherty, Batey, Masquida and Doudna2001; Hendrix et al. Reference Hendrix, Brenner and Holbrook2005; Lee et al. Reference Lee, Gutell and Russell2006; Nissen et al. Reference Nissen, Ippolito, Ban, Moore and Steitz2001; Tamura & Holbrook, Reference Tamura and Holbrook2002; Xin et al. Reference Xin, Laing, Leontis and Schlick2008).
A recent review by Ikawa and co-workers (Ishikawa et al. Reference Ishikawa, Fujita, Maeda, Furuta and Ikawa2011) surveyed methodologies for studying GNRA loop–receptor interactions, highlighting the versatility of both natural and in vitro selected motifs as modular elements of rationally designed RNAs. Here our first goal is to make a comprehensive biophysical comparison of GNRA tetraloop–receptor interactions to provide useful insights into the predominance of the ubiquitous GAAA tetraloop–11 nt receptor motif. Then, we undergo a detailed exploration of the contemporary biophysics of the GAAA tetraloop–11 receptor nt motif, with explicit comparisons between studies, providing insights into the role of tertiary interactions in RNA folding. The GAAA tetraloop–receptor interaction has been the subject of intensive structural, kinetic and thermodynamic studies, both in the context of ribozymes and in isolated model RNA constructs. An arsenal of biophysical methods have been applied to characterize this interaction: mutagenesis, bioinformatics, catalytic activity assays, ensemble and single-molecule FRET methods, gel-shift and melting studies, calorimetry, NMR spectroscopy, crystallography and computation. This level of detail is unprecedented for other tertiary motifs and therefore sets a benchmark for categorizing tertiary structures and elucidating mechanistic paradigms for RNA folding, including cation- and protein-mediated folding and thermodynamic cooperativity of tertiary interactions. Finally, we discuss some remarkable applications of the GAAA tetraloop–11 nt receptor motif, namely RNA tectonics, crystallization enhancement, and RNA selection and control.
2. GNRA tetraloop–receptor tertiary interactions
2.1 GNRA tetraloops are primed for long-range interactions
RNA secondary structures frequently include hairpin loops, the most common of which are tetraloops (Hendrix et al. Reference Hendrix, Brenner and Holbrook2005). GNRA tetraloops are extremely widespread – comprising one-third of the tetraloops in ribosomal RNA and half of the tetraloops in some catalytic RNAs (Klosterman et al. Reference Klosterman, Hendrix, Tamura, Holbrook and Brenner2004; Michel et al. Reference Michel, Hanna, Green, Bartel and Szostak1989; Michel & Westhof, Reference Michel and Westhof1990; Woese et al. Reference Woese, Winker and Gutell1990). GNRA tetraloops are also exceptionally stable, a property attributable to a characteristic U-turn structure, i.e., a sharp bend in the backbone between the G and N nucleotides (Fig. 1a), which allows for hydrogen bonding and base-stacking within the loop (Antao et al. Reference Antao, Lai and Tinoco1991; Antao & Tinoco, Reference Antao and Tinoco1992; Heus & Pardi, Reference Heus and Pardi1991; Jucker & Pardi, Reference Jucker and Pardi1995). However, other common tetraloops (UNCG and CUYG, Y=pyrimidine) are nearly if not more stable than GNRA loops, e.g., 5′-C(UUCG)G-3′ has a higher melting temperature than GNRA loops – T m=71·7 °C versus the 5′-C(GAAA)G-3′ with T m=65·9 °C (Antao & Tinoco, Reference Antao and Tinoco1992). For this reason, it was suggested that functionality rather than thermodynamic stability led to the natural abundance of GNRA tetraloops (Santalucia et al. Reference Santalucia, Kierzek and Turner1992). This functionality is the ability for GNRA loops to form long-range tertiary contacts, i.e., interactions with distal receptor regions of an RNA (Michel & Westhof, Reference Michel and Westhof1990; Santalucia et al. Reference Santalucia, Kierzek and Turner1992; Woese et al. Reference Woese, Winker and Gutell1990).
GNRA tetraloops engage in interactions with helical minor grooves. (a) NMR structure of a GAAA tetraloop is representative of the GNRA U-turn structure that exposes the Watson–Crick edges of the NRA nucleotides for binding (PDB ID 1ZIG). (b) GAAA tetraloop (red) interaction with tandem C:G base pairs (orange) in a helix minor groove, as observed in the intermolecular crystal contacts of the hammerhead ribozyme (PDB ID 1HMH). The nine proposed intermolecular hydrogen bonds are shown as dashed black lines (Pley et al. Reference Pley, Flaherty and Mckay1994b). (c, d) Other examples of GNRA tetraloop–helix interactions as observed in the crystal structure of RNase P (PDB ID 3Q1Q). The GUAA loop binds at CC:GG base pairs in a manner very similar to the interaction in (b). (d) The GAGA loop binds at CU:AG base pairs. In this case, the helical base pair preference changes to accommodate a bulky guanine C2 amino group (bright green position). Short lines and circles indicate Watson–Crick and non-canonical base pairs, respectively.

GNRA loops share potential features for long-range recognition – the exposure of the Watson–Crick base pairing edges of the last three bases of the loop and a unique backbone contour, as shown in Fig. 1a (Correll et al. Reference Correll, Munishkin, Chan, Ren, Wool and Steitz1998; Correll & Swinger, Reference Correll and Swinger2003; Heus & Pardi, Reference Heus and Pardi1991; Jucker et al. Reference Jucker, Heus, Yip, Moors and Pardi1996). Furthermore, GNRA loops are often found capping helices of conserved length; this evolutionarily maintained positioning suggests that the loops are engaged in native tertiary interactions (Hedenstierna et al. Reference Hedenstierna, Siefert, Fox and Murgola2000). Indeed, a number of types of tetraloop–receptor tertiary interactions have been observed, a trait that has been largely limited to GNRA-type loops. One exception to this rule is a highly conserved GANC loop in group II introns that has been identified to engage in a tertiary interaction through a single-base stack (Keating et al. Reference Keating, Toor and Pyle2008). In addition, in spite of a structural similarity to GNRA loops, UMAC (M=A or C) tetraloop–receptor interactions are exceptionally rare (Zhao et al. Reference Zhao, Huang, Nagaswamy, Xia, Gao and Fox2012). In the remainder of this section, we summarize the major types of GNRA tetraloop–receptor interactions that have been identified: GNRA interactions with tandem base pairs in the minor groove, the GAAA–11 nt tetraloop receptor motif, the GAAA–12 nt tetraloop receptor motifs and other GNRA tetraloop–receptor candidates identified through in vitro selection. See also a recent review by Ikawa and co-workers for an alternative description of these motifs (Ishikawa et al. Reference Ishikawa, Fujita, Maeda, Furuta and Ikawa2011).
2.2 GNRA tetraloop interaction with minor-groove tandem base pairs
The simplest type of GNRA tetraloop–receptor tertiary interaction involves the minor groove of a continuous helical ‘receptor’, which was first proposed by Michel and Westhof from a comparative sequence analysis (Michel & Westhof, Reference Michel and Westhof1990). The shallow, yet wide minor groove of the RNA A-form helix is more accessible to such interaction than the deeper, narrower major groove. Specifically, it was proposed that the end nucleotides (RA) of the tetraloop could interact with two consecutive purines of base pairs in a helix minor groove. This proposal was supported with base substitutions of the putative loop–helix interaction in the sunY intron of bacteriophage T4 (Jaeger et al. Reference Jaeger, Michel and Westhof1994). The structural basis for such an interaction was revealed in the 2·6 Å hammerhead crystal structure, in which intermolecular contacts were observed between a GAAA loop and the shallow minor groove of a helix, as shown in Fig. 1b (Pley et al. Reference Pley, Flaherty and Mckay1994a, Reference Pley, Flaherty and Mckayb).
The GAAA tetraloop in this ‘tetraloop–receptor’ crystal structure is identical to the NMR structure determined by Pardi and co-workers (Heus & Pardi, Reference Heus and Pardi1991; Jucker & Pardi, Reference Jucker and Pardi1995), with the distinctive U-turn allowing the end (‘AA’) nucleotides (A3 and A4) to engage the helix minor groove at the site of two consecutive purines, as shown in Fig. 1b. This packing strategy is stabilized by a hydrogen bonding network (nine potential hydrogen bonds, though at least three are expected to be relatively weak, i.e., >3 Å): seven hydrogen bonds are formed between A3 and A4 and the tandem C:G base pairs of the minor groove, one between A2 and the last A of the opposing tetraloop, and one between the backbones of the closing C:G base pair of the tetraloop and the opposing helix (Fig. 1b) (Pley et al. Reference Pley, Flaherty and Mckay1994b). Such adenosine insertion into distal minor grooves was later recognized as the highly utilized A-minor motif (Doherty et al. Reference Doherty, Batey, Masquida and Doudna2001; Nissen et al. Reference Nissen, Ippolito, Ban, Moore and Steitz2001). A-minor motifs are the most abundant tertiary motifs known in RNA structures, e.g., 186 such interactions are identified in the large ribosomal RNA subunit (Nissen et al. Reference Nissen, Ippolito, Ban, Moore and Steitz2001; Xin et al. Reference Xin, Laing, Leontis and Schlick2008). Four varieties of A-minor motifs have been identified, the most common type I (Xin et al. Reference Xin, Laing, Leontis and Schlick2008) is observed in the GAAA–helix interaction, involving the A4 nucleotide (Fig. 1b) (Ishikawa et al. Reference Ishikawa, Fujita, Maeda, Furuta and Ikawa2011). Type I is defined by the nestling of the adenine's N3 and O2′ into the minor groove, which optimizes hydrogen bonding to the C:G base pair with four possible H-bonds – three utilizing the ribose 2′ hydroxyls and one between bases (Pley et al. Reference Pley, Flaherty and Mckay1994b). Most of the interactions in the tetraloop–helix interaction involve ribose 2′ hydroxyls, including the hydrogen bond between the closing C:G base pair of the GAAA loop and the adjacent helix (Fig. 1b). A3 makes three hydrogen bonds, two of which involve 2′ OH's and the other between bases (Fig. 1b). Although not essential to the GAAA–tandem base-pair interaction, in this structure (Fig. 1b), A2 makes an opportunistic base–base interaction with the juxtaposed GAAA tetraloop (Costa & Michel, Reference Costa and Michel1997; Pley et al. Reference Pley, Flaherty and Mckay1994b), demonstrating the versatility of the GNRA tetraloop in forming tertiary interactions. As an additional example of this versatility, a highly conserved GAAA tetraloop undergoes a packing interaction with UACG loop in the 30S ribosomal subunit, whereby the GAAA loop hydrogen bonds with the closing C:G base pair of the UACG loop (Proctor et al. Reference Proctor, Schaak, Bevilacqua, Falzone and Bevilacqua2002; Ramakrishnan, Reference Ramakrishnan2002). Given that this particular ribosomal UACG loop is more generally conserved as YNMG (Y=pyrimidine, N=any nucleotide, M=A or C), it has been suggested that YNMG loops facilitate minor groove tertiary interactions with GNRA tetraloops (Proctor et al. Reference Proctor, Schaak, Bevilacqua, Falzone and Bevilacqua2002).
Interestingly, the hammerhead structure also reveals why the tandem C:G tandem base pairs would be the optimal binding sequence for GAAA, as conversion of the second C:G to G:C or U:A would disrupt some of the hydrogen bonds (Pley et al. Reference Pley, Flaherty and Mckay1994b). Furthermore, modeling of a G into the A3 position also explains the observed sequence preference of GNGA loops for a 5′-CU: AG-3′ helix because the bulky C2 amino group in the A3 position would hinder this type of interaction on a CC:GG helix (Jaeger et al. Reference Jaeger, Michel and Westhof1994; Pley et al. Reference Pley, Flaherty and Mckay1994b), presenting a steric and hydrogen bond clash that would be relieved if R3 was replaced by an A:U base pair (Doherty et al. Reference Doherty, Batey, Masquida and Doudna2001) (Figs 1c and 1d). Indeed, GNGA loops appear to interact more strongly with CU:AG helices while GYAA prefers a CC:GG helix, according to denaturation studies (Jaeger et al. Reference Jaeger, Michel and Westhof1994), phylogenetic analyses, and in vitro selection (Costa & Michel, Reference Costa and Michel1995, Reference Costa and Michel1997). Such GNRA tetraloops–helix interactions are very common, found for example in Group I and II introns (Costa & Michel, Reference Costa and Michel1995; Jaeger et al. Reference Jaeger, Michel and Westhof1994; Toor et al. Reference Toor, Keating, Taylor and Pyle2008), RNase P (Brown et al. Reference Brown, Nolan, Haas, Rubio, Major and Pace1996; Massire et al. Reference Massire, Jaeger and Westhof1997; Reiter et al. Reference Reiter, Osterman, Torres-Larios, Swinger, Pan and Mondragon2010; Torres-Larios et al. Reference Torres-Larios, Swinger, Pan and Mondragon2006), and ribosomal RNA (Ban et al. Reference Ban, Nissen, Hansen, Moore and Steitz2000; Noller, Reference Noller2005).
2.3 GAAA tetraloop–11 nt tetraloop receptor motif
While the continuous helix is the simplest tetraloop receptor, additional stability and specificity can be achieved with more complex receptor motifs. A natural such receptor motif is a highly conserved 11 nt asymmetric internal loop (Costa & Michel, Reference Costa and Michel1995). Through chemical modifications, Murphy and Cech first identified a tertiary contact between a GAAA tetraloop and a conserved bulge on a distal helix that stabilizes the fold of the Tetrahymena ribozyme's P4–P6 domain. Studies of this 11 nt motif revealed a preference for interaction with GAAA tetraloops (Murphy & Cech, Reference Murphy and Cech1994). Through phylogenetic (co-variation) sequence analysis of group I and II introns, Costa and Michel observed that the 11 nt receptor is a highly conserved asymmetric internal loop of the sequence 5′-UAUGG-3′:5′-CCUAAG-3′, which frequently appears in combination with a GAAA tetraloop throughout introns (Fig. 2a) (Costa & Michel, Reference Costa and Michel1995). It was demonstrated that the 11 nt receptor [R(11 nt)] is remarkably specific to the GAAA tetraloop [T(GAAA)] using an intron derived cleavage assay (see Section 2.5). The possible locations of the T(GAAA)–R(11 nt) interaction in group I introns are shown in Fig. 2a. Due to its specificity, affinity, and abundance, Costa and Michel proposed that this interaction is a common strategy for RNA helical packing (Costa & Michel, Reference Costa and Michel1995). Indeed the T(GAAA)–R(11 nt) motif is the strongest, most specific and widespread GNRA–receptor interaction, stabilizing the folded structures of group I and group II Introns and RNase P (Adams et al. Reference Adams, Stahley, Kosek, Wang and Strobel2004b; Cate et al. Reference Cate, Gooding, Podell, Zhou, Golden, Kundrot, Cech and Doudna1996a; Costa & Michel, Reference Costa and Michel1995, Reference Costa and Michel1997; Geary et al. Reference Geary, Baudrey and Jaeger2008; Krasilnikov et al. Reference Krasilnikov, Yang, Pan and Mondragon2003; Toor et al. Reference Toor, Keating, Taylor and Pyle2008). A GAAA tetraloop and the 11 nt tetraloop receptor motif have also been identified in riboswitches (Regulski et al. Reference Regulski, Moy, Weinberg, Barrick, Yao, Ruzzo and Breaker2008; Weinberg et al. Reference Weinberg, Barrick, Yao, Roth, Kim, Gore, Wang, Lee, Block, Sudarsan, Neph, Tompa, Ruzzo and Breaker2007). The specificity and affinity of this interaction will be discussed in more detail in Sections 2.5 and 3.
Frequent use of the GAAA tetraloop and 11 nt [5′-CCUAAG …UAUGG-3′] receptor motif in group I introns. (a) Common sites of the GAAA tetraloop and 11 nt receptor motif in group I introns (Costa & Michel, Reference Costa and Michel1995). The dashed lines indicate that not all group I introns contain the region beyond P5. (b) Secondary structure and crystal structure of the Tetrayhmena thermophila P4–P6 domain (PDB ID 1GID) highlighting the tetraloop (pink) and receptor (green) (Cate et al. Reference Cate, Gooding, Podell, Zhou, Golden, Kundrot, Cech and Doudna1996a).
The 2·8 Å crystal structure of the Tetrahymena group I intron's 160 nt P4–P6 domain, which contains the canonical GAAA −11 nt receptor interaction (Fig. 2b), reveals the remarkable features that give rise to the specificity and affinity of this interaction (Cate et al. Reference Cate, Gooding, Podell, Zhou, Golden, Kundrot, Cech and Doudna1996a). Just as in the helical minor groove interactions, the tetraloop in this ‘tetraloop–receptor’ crystal structure is identical to the solution nuclear magnetic resonance (NMR) structure (Heus & Pardi, Reference Heus and Pardi1991), with the adenines primed to contour the minor groove (Fig. 2b). Each of the three consecutive adenines of the tetraloop pack tightly into the minor groove of the receptor helix (P6), which classifies them more broadly into the aforementioned A-minor motif (Doherty et al. Reference Doherty, Batey, Masquida and Doudna2001; Nissen et al. Reference Nissen, Ippolito, Ban, Moore and Steitz2001). The T(GAAA)–R(11 nt) interaction is also characterized by a specific hydrogen bonding and base stacking pattern (Fig. 3). The first A (A151) of the tetraloop makes two H-bonds with the A of the U-A reverse Hoogsteen base pair (U224 and A248). The second A (A152) of the loop hydrogen bonds with the receptor's G250 (1 H bond) below it and U224 (2 H bonds) above it via the ribose zipper motif, i.e., inter-digitated 2′-OH interactions (Tamura & Holbrook, Reference Tamura and Holbrook2002). The third A (A153) of the loop interacts with a C:G of the receptor, as predicted by mutagenesis (Murphy & Cech, Reference Murphy and Cech1994), such that the G⋅A pair of the tetraloop forms a base quadruplet with a C:G pair in the receptor (G⋅A⋅C-G) by making 4 H-bonds, identical to the A4 type I A-minor motif of the GAAA-minor groove interaction from the hammerhead structure in Fig. 1b (Pley et al. Reference Pley, Flaherty and Mckay1994b). Also, just as in the hammerhead structure, many of the hydrogen bonds of this tetraloop–receptor interaction utilize ribose 2′-hydroxyls. Furthermore, two consecutives adenines in the receptor (nts 225 and 226) are aligned side-by-side, forming a pseudo-base pair, called the adenosine platform motif, which stacks onto the G of the G.U wobble pair (Figs 3a and 3b). This stacking pattern achieves near coaxial alignment of the flanking helices despite the asymmetry of the internal loop (Cate et al. Reference Cate, Gooding, Podell, Zhou, Golden, Kundrot, Cech and Doudna1996a, Reference Cate, Gooding, Podell, Zhou, Golden, Szewczak, Kundrot, Cech and Doudnab). The adenosine platform also serves to open the minor groove of the tetraloop receptor, thus allowing A151 to stack upon the platform (Cate et al. Reference Cate, Gooding, Podell, Zhou, Golden, Kundrot, Cech and Doudna1996a, Reference Cate, Gooding, Podell, Zhou, Golden, Szewczak, Kundrot, Cech and Doudnab), as seen in Figs 3a and 3b. An additional hydrogen bond is also made between the 2′-hydroxyls of the terminal CG base pair (G251) of the receptor and the CG pair at the base of the tetraloop (C154), just as was seen below the L4 interaction in the GAAA–minor groove interaction (Fig. 1b). In total, 10 hydrogen bonds are formed between the tetraloop and the 11 nt tetraloop receptor, many of which are as short as Watson–Crick base pairing bonds, making the T(GAAA)–R(11 nt) motif a very strong and specific interaction, as mutations to the tetraloop would geometrically disrupt the hydrogen bonding network and/or introduce steric clashes (Cate et al. Reference Cate, Gooding, Podell, Zhou, Golden, Kundrot, Cech and Doudna1996a; Doherty et al. Reference Doherty, Batey, Masquida and Doudna2001). The effect of mutations on the T(GAAA)–R(11 nt) interaction will be discussed in Section 3.
Structure of the GAAA tetraloop–11 nt tetraloop receptor motif in the P4–P6 domain (Cate et al. Reference Cate, Gooding, Podell, Zhou, Golden, Kundrot, Cech and Doudna1996a). (a) Schematic of the interaction with hydrogen bond contacts indicated by arrows and base stacking of the tetraloop onto A226 of the adenosine platform in the receptor indicated with a dashed box. (b) Ten hydrogen bonds between the tetraloop and receptor are shown as black dotted lines, blue=nitrogen, red=oxygen (hydrogens not shown) (c) A153, the last (3′) adenosine in the tetraloop, makes a base quadruplet with the receptor C223-G250 base pair. (d) A152, the penultimate adenosine in the tetraloop, hydrogen bonds with the 2′-hydroxyls of U224 and G250, a ribose zipper motif. (e) A151, the first adenine in the tetraloop, makes two H-bonds with the U-A reverse Hoogsten base pair (U224.A48). Hydrogen bond distances (Å) between the tetraloop and receptor are shown in black with a Watson–Crick pair (in (e)) labeled in green for comparison (PDB ID 1HR2).
Other high-resolution structures containing the T(GAAA)–R(11 nt) motif have revealed that the interaction is independent of context. For example, the crystal structures of (i) RNase P and (ii) other group I introns, as well as (iii) the NMR structure of a dimer system that isolates two T(GAAA)–R(11 nt) interactions, were all found to be identical (Adams et al. Reference Adams, Stahley, Kosek, Wang and Strobel2004b; Davis et al. Reference Davis, Tonelli, Scott, Jaeger, Williamson and Butcher2005; Mondragon et al. Reference Mondragon, Krasilnikov and Pan2003). The structural robustness of the motif has allowed the interaction to be the subject of extensive biophysical characterization, as will be the major focus of this review.
2.4 GAAA tetraloop–12 nt tetraloop receptor motifs (IC3 and Vc2)
A third type of natural tetraloop–receptor interactions has been identified in group IC3 introns, implicating a GAAA loop at the L2 position and a highly conserved 12 nt motif in the P8 domain (see Fig. 2a for these positions). The IC3 motif is shown in Fig. 4 (top left) as compared to the 11 nt motif with sequences 5′-CCCUAAC:GAGGG-3′ versus 5′-CCUAAG:UAUGG-3′, respectively. The 12 nt receptor appears to lack a strong preference for the GAAA tetraloop, based on substitutions of the loop with GUGA, GUAA and GAGA loops in an IC3 intron cleavage assay (Ikawa et al. Reference Ikawa, Naito, Aono, Shiraishi and Inoue1999). This is in contrast to the 11 nt motif, where the ribozyme function was shown to be nearly obliterated when the GAAA tetraloop was mutated (Costa & Michel, Reference Costa and Michel1995). Furthermore, though replacement of the 11 nt motif in the Tetrahymena ribozyme with the IC3 motif still resulted in cleavage, it was considerably less active, consistent with a lower affinity of the IC3 motif for a GAAA loop than with the 11 nt receptor, as will be shown in the following section. The IC3 motif has been posited to be the predecessor of the 11 nt motif (Ikawa et al. Reference Ikawa, Nohmi, Atsumi, Shiraishi and Inoue2001). Interestingly, out of all known tetraloop receptors, the 11-nt motif recognizes a GAAA loop with highest specificity while the IC3 12 nt motif appears to be the least discriminatory (Ikawa et al. Reference Ikawa, Nohmi, Atsumi, Shiraishi and Inoue2001), as further discussed in the following section. The structure of the T(GAAA)–R(IC3) interaction has not yet been determined.
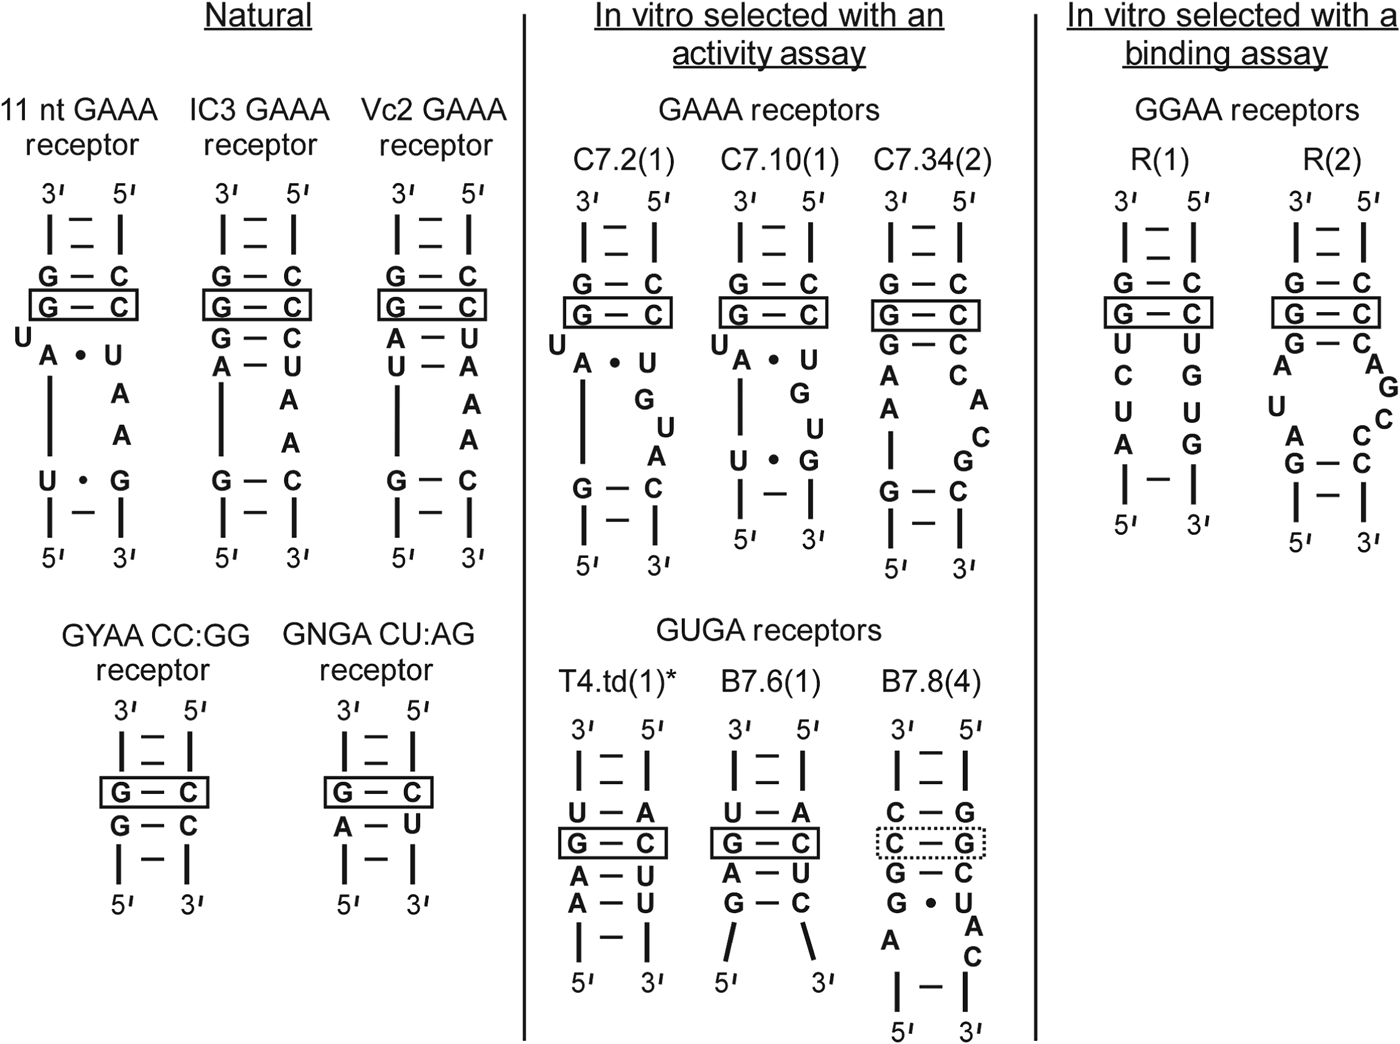
Natural and in vitro selected tetraloop receptors. The natural receptors have been found in ribozymes (Costa & Michel, Reference Costa and Michel1995; Ikawa et al. Reference Ikawa, Naito, Aono, Shiraishi and Inoue1999; Kulshina et al. Reference Kulshina, Baird and Ferre-D'amare2009; Smith et al. Reference Smith, Lipchock, Ames, Wang, Breaker and Strobel2009). GAAA and GUGA receptors (center panel) were selected based on a cleavage activity assay of T4.td (see Fig. 5 and Table 1) (Costa & Michel, Reference Costa and Michel1997). GGAA receptors were selected using a gel-shift binding assay (see Fig. 6b) (Geary et al. Reference Geary, Baudrey and Jaeger2008).
In addition to the aforementioned motifs, other candidates for natural GNRA tetraloop receptors continue to be identified. For example, numerous possible GNRA tetraloop–receptor interactions are observed in riboswitches (Regulski et al. Reference Regulski, Moy, Weinberg, Barrick, Yao, Ruzzo and Breaker2008; Sudarsan et al. Reference Sudarsan, Lee, Weinberg, Moy, Kim, Link and Breaker2008; Weinberg et al. Reference Weinberg, Barrick, Yao, Roth, Kim, Gore, Wang, Lee, Block, Sudarsan, Neph, Tompa, Ruzzo and Breaker2007; Winkler & Breaker, Reference Winkler and Breaker2005). One such receptor has been explicitly observed in a complex with a GAAA tetraloop in the crystal structures of the Vibrio cholera cyclic-di-GMP (Vc2) riboswitch (Kulshina et al. Reference Kulshina, Baird and Ferre-D'amare2009; Smith et al. Reference Smith, Lipchock, Ames, Wang, Breaker and Strobel2009). This so-called Vc2 receptor (Fig. 4) is thought to be a variant of the IC3 motif (Ishikawa et al. Reference Ishikawa, Fujita, Maeda, Furuta and Ikawa2011). The functional importance of this interaction has also been examined, suggesting its role in riboswitch activity is to not only establish the 3D structure of the RNA but to also locally rigidify the Vc2 receptor (Fujita et al. Reference Fujita, Tanaka, Furuta and Ikawa2012). In addition, a tetraloop–receptor-like interaction has been implicated in an intermolecular interaction between a ribozyme and a separate mRNA molecule (Birgisdottir et al. Reference Birgisdottir, Nielsen, Beckert, Masquida and Johansen2011).
2.5 In vitro-selected versus natural GNRA tetraloop–receptor interactions
In vitro selection for GUGA, GAAA and GGAA tetraloop receptors has yielded interesting receptor variations for these and other GNRA tetraloops, with at least two distinct classes of GGAA and GAAA receptors and five classes of GUGA receptors (Costa & Michel, Reference Costa and Michel1997; Geary et al. Reference Geary, Baudrey and Jaeger2008). Examples from the two most abundant class pools from each selection are shown in Fig. 4 compared with the natural receptors identified in Sections 2.2–2.4.
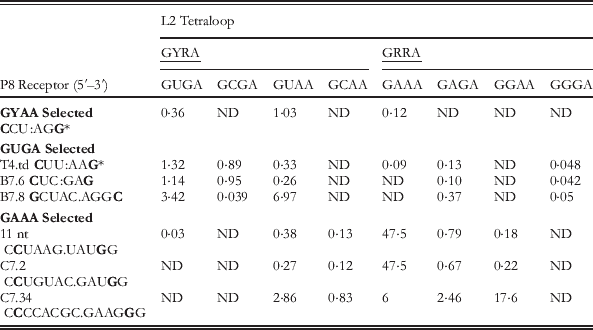
The in vitro selection assay for the GGAA and GAAA receptors (Fig. 4, center column) utilized a cleavage assay of the td intron of the T4 bacteriophage, the wild-type version of which relies on interaction between the GUGA P2 loop and the P8 helix (Michel et al. Reference Michel, Costa and Westhof2009), as shown in Fig. 5a (Costa & Michel, Reference Costa and Michel1997). The construct is formed from incubation of molecules comprising the P1–P2 substrate and the core (Fig. 5a). Mixing of the two molecules was shown to result in splicing at the normal 5′ site without the addition of a free guanosine cofactor, and therefore is caused by attack of the terminal G residue at the activated splice site (Fig. 5a). Catalytic activity relies on P8 recognition of the L2 loop to position the substrate within the active site. Therefore P8–L2 interaction affects the efficiency of catalysis, monitoring of which was used as a means to select for novel tetraloop receptors through randomization of the P8 helix (Fig. 5b) (Costa & Michel, Reference Costa and Michel1997; Michel & Westhof, Reference Michel and Westhof1990). Resulting pool winners tested for tetraloop specificity are shown in Fig. 4 with the k cat/K m values summarized in Table 1.
Td bacteriophage ribozyme used for in vitro selection of tetraloop–receptor interactions from co-adapted L2 and P8 sequences (Costa & Michel, Reference Costa and Michel1997). (a) The td intron of bacteriophage T4 was converted into a two-piece construct, P1–P2 substrate and catalytic core, with the wild type L2–P8 interaction indicated by dashed arrows. The red arrow points to the splice site. (b) Constructs used for in vitro selection. The substrate contained either GAAA or a GUAA loop with random 21 nt sequences in the P8 hairpin regions, which are selected based on their ability to interact with the L2 loop of the substrate.
k cat/K m (×105 min−1 M−1) values for cleavage reactions of P1–P2 substrates of td-derived ribozymes (Fig. 5) with in vitro and naturally selected P8 tetraloop receptor interactions (Fig. 4) and varied GNRA L2 loops
(Costa & Michel, Reference Costa and Michel1995, Reference Costa and Michel1997).
The common C:G base pair identified in all tetraloop receptors is bolded. R=purine, Y pyrimidine base, ND=not determined.
* Wild-type ribozyme receptor sequence with GUGA tetraloop.
Interestingly, the td wild-type (GUGA–CCU:AGG) was not the most efficient construct in terms of substrate cleavage, in line with expectations that the T(GAAA)–R(11) nt motif is significantly stronger (Table 1). This observation supports the idea that the L2–P8 interaction is less critical in the context of the full ribozyme and can explain why the stronger GAAA–11 nt pair is rarely found in this position, as opposed to its prevalence in the L5b–P6 and L9–P5 interactions (Fig. 2), which are more critical in forming a stable ribozyme core (Jaeger et al. Reference Jaeger, Michel and Westhof1994; Murphy & Cech, Reference Murphy and Cech1994). Some of the selected receptors actually prefer GGGA and GUAA loops even though they were selected for either GUGA or GAAA (Table 1). Furthermore, no selection surpassed the natural T(GAAA)–R(11) nt motif in activity, though other comparable receptors containing minor variations on the motif (C7.2 and C7.34) were similarly active (see Table 1 and Fig. 4). These studies also revealed that interaction with continuous helices is best when the second position of the GNRA loops is a pyrimidine, likely due to a steric clash with GGRA loops. In addition, common recognition features of GNRA tetraloops were identified, the most critical of which is the receptor's possession of a C:G base pair that presumably positions the final A of the GNRA loop for binding, as was seen in the crystal structures of the GAAA-helix and GAAA-11 nt interactions (Cate et al. Reference Cate, Gooding, Podell, Zhou, Golden, Kundrot, Cech and Doudna1996a; Pley et al. Reference Pley, Flaherty and Mckay1994b). This putative interaction site is indicated for all of the receptors with a box in Fig. 4 (Costa & Michel, Reference Costa and Michel1997).
An alternative and more direct approach to in vitro selection of tetraloop–receptor interactions was taken by Jaeger and co-workers by utilizing a binding assay for identification of possible GGAA receptors, which thus far have rarely been identified in nature (Geary et al. Reference Geary, Baudrey and Jaeger2008). Such an approach allows for comparisons of new receptors with those previously identified by a more direct assessment of specificities than a catalysis assay, which is an indirect read-out of folding. The bimolecular approach to studying tertiary interactions can be challenging because the dissociation constant (K d) for weak tertiary interactions is very high. Nevertheless, the K d of the T(GAAA) −R(11 nt) motif was measured using site-directed spin labeling detection (Fig. 6a), which allowed for measurements of the amount of free [T] as function of [R], titrations of which allowed for determination of K d for the simple scheme in Fig. 6a as
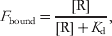 $$F_{{\rm bound}} \equals {{\lsqb {\rm R}\rsqb } \over {\lsqb {\rm R}\rsqb \plus K_{\rm d} }}\comma $$
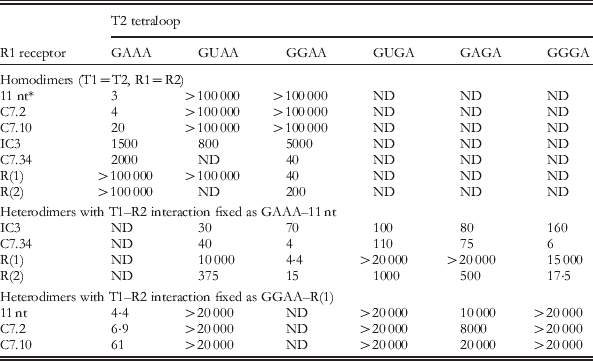
where [R] is the concentration of the receptor, K d is the apparent dissociation constant for the T–R construct, and F bound is the fraction of bound tetraloop (T) (Fig. 6a). Indeed the binding interaction was found to be relatively weak, with a K d of 0·4±0·05 mM at 125 mM MgCl2. To allow a more sensitive detection of tetraloop–receptor binding, an optimized bimolecular construct design that contains two tetraloop–receptor interactions (TR–TR) was used as a selection assay (Fig. 6b) (Geary et al. Reference Geary, Baudrey and Jaeger2008; Jaeger & Leontis, Reference Jaeger and Leontis2000; Jaeger et al. Reference Jaeger, Westhof and Leontis2001). Specifically, a gel-shift assay was used to measure the K ds for homo- and hetero-dimerization (T1=T2, R1=R2 and T1≠T2, R1≠R2) of dual tetraloop–receptor constructs, as summarized in Table 2 (Geary et al. Reference Geary, Baudrey and Jaeger2008). Heterodimer constructs that contain one strong interaction enable detection of a second T–R interaction that would otherwise be too weak to observe with bimolecular association.
Binding assays for measurement of tetraloop and receptor dissociation constants (K d). (a) Nitroxide labeling scheme for EPR probing of the K d for the GAAA tetraloop (T) and 11 nt receptor (R) construct (Qin et al. Reference Qin, Butcher, Feigon and Hubbell2001b). (b) Dimerization scheme for forming two tetraloop–receptor interactions (T1–R2 and R1–T2) with varied Ts and Rs (Geary et al. Reference Geary, Baudrey and Jaeger2008). The helical construct was optimized using the GAAA–11 nt receptor interaction (Jaeger et al. Reference Jaeger, Westhof and Leontis2001). Both homodimer (T1=T2, R1=R2) and heterodimer (T1≠T2, TR1≠TR2) complexes were explored with a gel shift binding assay (Table 2).
The affinity of the dual T(GAAA)–R(11 nt) constructs is five orders of magnitude greater than that of the single T–R interaction (Fig. 6 and Table 2). Specifically, K d=3 nM (dual) versus 0·4 mM±0·05 mM (single), when both interactions are measured at saturating [MgCl2]. Furthermore, K Mg for the association of a single tetraloop and a receptor was found to be ∼39 mM, whereas K Mg∼1 mM for the TR–TR assembly. As shown in Fig. 6a, ΔG°bind (single)=−4·6±0·1 kcal mol−1, where ΔG°bind=−RT ln (K bind×1 M). If the tetraloop–receptor interactions additively contributed to construct stability, one would predict ΔG°bind(dual)=2 ΔG°bind(single), or −9·2 kcal mol−1. However, ΔG°bind(dual) is actually −11·4 kcal mol−1, which is significantly more favorable than the sum of two single interactions. The origin of this discrepancy will be discussed in Section 7 and is believed to be evidence of entropic cooperativity between the T–R interactions.
Tetraloop–receptor specificities: Apparent dissociation constants (K d, nM) of tetraloop–receptor dimers (T1R1–R2T2, Fig. 6b) with varied R1–T2 interactions and the specified T1–R2 binder
K d determined at 15 mM Mg2+, 10 °C, 89 mM Tris borate buffer at pH 8.3 by native gel electrophoresis (Geary et al. Reference Geary, Baudrey and Jaeger2008). ND=not determined.
* The single GAAA–11 nt receptor system (Fig. 6a) yielded K d=0·4±0·05 mM at 125 mM Mg2+, 100 mM NaCl, 50 mM MOPS, pH 6.6, and 20 °C using a site-directed spin labeling assay (Qin et al. Reference Qin, Butcher, Feigon and Hubbell2001b).
As shown in Table 2, the binding assay dovetails with the activity assay (Table 1) for the specificity and affinity trends of the various receptors. Again the GAAA–11 nt appears the strongest and is remarkably specific for GAAA, yet the GAAA–R(C7.2) in vitro selected receptor is very comparable. This study also confirmed that the IC3 motif, which was believed to be less stringent in its discrimination of various tetraloops, indeed binds GAAA, GUAA and GGAA receptors with similar affinities (Ikawa et al. Reference Ikawa, Naito, Aono, Shiraishi and Inoue1999). Most interestingly, Geary et al., revealed new classes of receptors called R(1) and R(2) that quite strongly bind GGAA loops, with a homodimeric K d=40 and 200 nM, respectively (Fig. 4 and Table 2). R(1) is a 12 nt receptor, which is quite similar to the 11 nt motif in that it specifically recognizes one type of loop. The R(2) affinities for the homodimeric and heterodimeric constructs are summarized in Table 2. Effects of mutations within the R(1) and R(11 nt) receptors were also explored. From these results, the authors proposed that tetraloop receptors can be categorized into two general classes dictated by the geometry of their A-minor interaction (Geary et al. Reference Geary, Baudrey and Jaeger2008).
These studies have also revealed that the natural tetraloop–receptor interactions tend to be ‘AU-rich’ compared to their ‘GC-rich’ artificial counterparts (Afonin et al. Reference Afonin, Lin, Calkins and Jaeger2012). Furthermore, in spite of comparable selectivity and stability to natural GNRA–receptor interactions, most of the in vitro selected motifs have not been found in natural RNAs, thus indicating an unknown evolutionary bias for tetraloop receptor selection (Afonin et al. Reference Afonin, Lin, Calkins and Jaeger2012; Costa & Michel, Reference Costa and Michel1997; Geary et al. Reference Geary, Baudrey and Jaeger2008). A recent work has explored the origins of the evolutionary tetraloop receptor preferences using cleverly designed modular systems with competing tetraloop–receptor and pseudo-knot interactions (Afonin et al. Reference Afonin, Lin, Calkins and Jaeger2012). This study supports the hypothesis that the natural motifs, in particular the evolutionary preference for ‘AU’ rich GNRA tetraloop–receptors, may be optimized to avoid misfolded states and kinetic traps in the global folding of the RNA. Nonetheless, the GAAA tetraloop–11 nt receptor motif is clearly the strongest and most frequently employed GNRA–receptor interaction. This motif has been examined in great biophysical detail, and is thus the focus of the remainder of this review.
3. Origins of sequence conservation in the 11 nt GAAA tetraloop receptor
Most group I introns possess GAAA tetraloops (Fig. 2) that are frequently paired with the canonical 11 nt receptor motif (Costa & Michel, Reference Costa and Michel1997; Michel & Westhof, Reference Michel and Westhof1990). However, there are natural variations within the tetraloop receptor domains, the most common of which are shown in Figs 7a and 7b. Nonetheless, a central invariant core set of nucleotides is identified (shown in red), and each of these is directly involved with the hydrogen bond network created with the GAAA tetraloop (Fig. 3). Furthermore, an additional adenosine (orange) that forms the AA platform is highly conserved, present 90% of the time with its only mutation being to a C. This mutation might be permissible because it potentially still allows formation of the platform that is critical to opening the minor groove to the tetraloop (Fig. 3b). Variations with a GAAA–11 nt interaction in group II introns were also analyzed (Costa & Michel, Reference Costa and Michel1997).
Conservation of the 11 nt GAA tetraloop receptor and effect of mutations (Costa & Michel, Reference Costa and Michel1997; Geary et al. Reference Geary, Baudrey and Jaeger2008). (a, b) In vivo variability of the 11 nt GAAA tetraloop receptor in group I introns containing L5b–P6a and/or L9–P5 interactions (see Fig. 2a). Red outlined nucleotides are invariant. The numbers of sequences analyzed are indicated in square brackets. Numbers above each arrow correspond to the total number of changes observed at each position. Only the most frequent or relevant alternatives to the canonical sequence are shown. The L5b–P6a interaction is present only in subgroup IC1. (c) Effect of mutations on the binding of the T(GAAA)–R(11 nt) within a heterodimer complex, see also Fig. 6b.
As expected, any mutations to the invariant residues within the 11 nt motif considerably disrupt and even obliterate the interaction with the GAAA tetraloop when the binding affinity is assessed in the context of the heterodimeric complex (Fig. 7c) per Eq. (1). Mutations to the adenosine of the A:U Hoogsten base pair directly disrupt H-bonds with the first A of the GAAA loop (Fig. 3d) and make dimerization undetectable, while mutations to the first A of the adenosine platform to a G destabilizes the complex by 1·49 kcal mol−1 (Fig. 7c). However, mutation of the next A of the platform to a C, the natural variant, is considerably less detrimental (0·24 kcal mol−1), suggesting the platform is also formed in this mutant. Although other nucleotides of the receptor, e.g., the G:U wobble pair, show considerable variation, their mutation to unnatural sequences has a dramatic effect on the heterodimeric binding affinity (Fig. 7). The question remains if natural variants would also be detrimental to the interaction in this context or if they perhaps can accomplish a requisite structural task, such as metal ion recruitment and/or geometrical optimization for adenosine platform stacking (Cate et al. Reference Cate, Gooding, Podell, Zhou, Golden, Szewczak, Kundrot, Cech and Doudna1996b; Davis et al. Reference Davis, Foster, Tonelli and Butcher2007; Geary et al. Reference Geary, Baudrey and Jaeger2008). Even though the first C:G base pair (blue) is not directly involved in any sequence specific interaction with the tetraloop region (Fig. 3), mutation to G:C, the most common natural variant (Figs 7a and 7b), destabilizes binding by 1·78 kcal mol−1 (Fig. 7c). The origin of this disruption is not yet understood, though, just as in the case of the G:U wobble pair, a metal ion does localize in this region (see Section 5) and the sequential purines may be critical to this cation recruitment (Davis et al. Reference Davis, Foster, Tonelli and Butcher2007). As will be discussed in the following section, the C:G pair has also been proposed to be involved in the binding transition state (Butcher et al. Reference Butcher, Dieckmann and Feigon1997), though this alone would not explain why its mutation would destabilize the interaction. It is also possible that these natural mutations occurred under evolutionary stimuli reflecting needs other than optimization of interaction free energy (Costa & Michel, Reference Costa and Michel1997).
4. Free versus bound structure of the GAAA tetraloop and 11 nt tetraloop receptor
Although the GAAA tetraloop is a rigid unit, indistinguishable both free in solution or bound to a receptor (Cate et al. Reference Cate, Gooding, Podell, Zhou, Golden, Kundrot, Cech and Doudna1996a; Heus & Pardi, Reference Heus and Pardi1991; Jucker & Pardi, Reference Jucker and Pardi1995), the bound and unbound forms of its 11 nt tetraloop receptor are markedly different, as depicted in Fig. 8 (Butcher et al. Reference Butcher, Dieckmann and Feigon1997; Cate et al. Reference Cate, Gooding, Podell, Zhou, Golden, Kundrot, Cech and Doudna1996a). Specifically, the free form of this tetraloop receptor involves a high degree of base stacking; the central region is made up the three inter-digitated adenosines (red) that form a ‘base zipper’ motif, while two uridines (blue) form a U.U mismatch pair stacked with the C:G base pairs (Fig. 8a). In the bound form, most of these stacking interactions are disrupted, with two of the A's aligned side-by-side, making up the adenosine platform, while one of the U's is unstacked and unpaired (Fig. 8b). These structural differences suggest that the tetraloop receptor must undergo conformational rearrangement upon tetraloop docking, i.e., an induced fit (Butcher et al. Reference Butcher, Dieckmann and Feigon1997). Even at very high [Mg2+]=125 mM, the native, unstacked formation of the tetraloop receptor is unobservable, as monitored by site-directed spin labeling (Qin et al. Reference Qin, Feigon and Hubbell2005).
Solution NMR structure of the free 11 nt tetraloop receptor (Butcher et al. Reference Butcher, Dieckmann and Feigon1997) versus the GAAA bound structure. (a) Lowest energy structure of the free 11 nt receptor structure determined by solution NMR spectroscopy in the context of the receptor (R) construct shown in Fig. 6a. (a) The central region is made up of 3 inter-digitated adenosines (red). Two uridines (blue) form a U.U mismatch pair stacked with the C:G base pairs (PDB ID 1TLR). Hydrogen bonds within the receptor are indicated as purple lines and base stacking as purple rectangles. (b) Crystal structure of the GAAA bound tetraloop receptor from the P4–P6 domain (PDB ID 1HR2). GAAA–receptor hydrogen bonds are in shown in detail in Fig. 3. In the bound form, two of the adenosines align side-by-side, making up the adenosine platform. One U (blue) is unstacked and unpaired.
Study of the free form of the tetraloop receptor also addresses another interesting question: why is the first C:G base pair (Figs 7a and 7b) of the motif so highly conserved? It was proposed that this base pair may be implicated in the transition state for tetraloop binding. In this scheme, the tetraloop registers with the tandem C:G base pairs in the same fashion as in the simple tetraloop minor groove interaction (Fig. 1a), thereby nucleating a conformational change within the receptor (Butcher et al. Reference Butcher, Dieckmann and Feigon1997).
5. The role of metal ions and solvent in the GAAA tetraloop–11 nt receptor structure
Metal ions are critical to proper RNA folding, and formation of the GAAA tetraloop–11 nt receptor serves as model system for understanding RNA–ion interactions, for example it undergoes Mg2+-dependent formation (Jaeger & Leontis, Reference Jaeger and Leontis2000; Qin et al. Reference Qin, Butcher, Feigon and Hubbell2001b). Metal ions associated with the bound T(GAAA)–R(11 nt) complex have been identified through NMR (Fig. 9a) and crystallography. In the crystal structure of the Tetrahymena P4–P6 domain, a number of potential metal ion binding sites have been identified near the GAAA tetraloop and receptor (see Figs 2 and 3 for numbering scheme): (i) a magnesium ion coordinated to the G250 phosphate oxygen of the receptor, which is analogous to G8 in Fig. 9a (Adams et al. Reference Adams, Stahley, Gill, Kosek, Wang and Strobel2004a, Reference Adams, Stahley, Kosek, Wang and Strobelb; Cate et al. Reference Cate, Gooding, Podell, Zhou, Golden, Kundrot, Cech and Doudna1996a; Juneau et al. Reference Juneau, Podell, Harrington and Cech2001), (ii) a monovalent ion (K+) coordination site below the adenosine platform nucleotides (Fig. 9b) (Adams et al. Reference Adams, Stahley, Gill, Kosek, Wang and Strobel2004a; Basu et al. Reference Basu, Rambo, Strauss-Soukup, Cate, Ferre-D'amare, Strobel and Doudna1998; Cate et al. Reference Cate, Gooding, Podell, Zhou, Golden, Szewczak, Kundrot, Cech and Doudna1996b) (Fig. 9b), and (iii) a cobalt hexamine binding site at the consecutive G.U wobble pairs (analogous to nts 18·25 and 17·26 in Fig. 9a) in the major groove of the tetraloop helix (Cate & Doudna, Reference Cate and Doudna1996; Juneau et al. Reference Juneau, Podell, Harrington and Cech2001). The NMR structure of a dual tetraloop–receptor (TR–TR) complex in solution contains similar metal binding sites, as shown in Fig. 9a (Davis et al. Reference Davis, Foster, Tonelli and Butcher2007).
Metal ions in the GAAA tetraloop–11 nt receptor structure. (a) Mn2+ (green) localized on the homodimer tetraloop–receptor complex, as determined by NMR (Davis et al. Reference Davis, Foster, Tonelli and Butcher2007). All ion positions could be satisfied by hydrated ions (PDB ID 2I7Z). (b) K+ chelation site below the AA platform in the Azoarcus group I intron crystal structure, with the nucleotides labeled according to analogy of location in the dimer of in (a). The five proposed chelation sites are shown (Adams et al. Reference Adams, Stahley, Kosek, Wang and Strobel2004b; Basu et al. Reference Basu, Rambo, Strauss-Soukup, Cate, Ferre-D'amare, Strobel and Doudna1998) (PDB ID 1U6B).
Through NMR studies, as many as five manganese ions or 2 cobalt hexamine ions have been shown to localize on the complex (Davis et al. Reference Davis, Foster, Tonelli and Butcher2007). Although the methods used were unable to discern hydration state of the ions, all of the locations could be occupied by fully hydrated ions (Davis et al. Reference Davis, Foster, Tonelli and Butcher2007). The Mn2+ sites are shown in Fig. 9a. Sites 2, 3 and 5 are all in similar locations to the three sites noted for the crystal structures. Site 5 (the G.U wobbles) can be occupied by either manganese or cobalt hexamine ions and overlaps well with the crystal structure (Cate & Doudna, Reference Cate and Doudna1996; Juneau et al. Reference Juneau, Podell, Harrington and Cech2001). Site 2 (the AA platform) shows an associated manganese, which is ∼6·9 Å away from the K+ site observed in the crystal structure (Adams et al. Reference Adams, Stahley, Gill, Kosek, Wang and Strobel2004a, Reference Adams, Stahley, Kosek, Wang and Strobelb; Basu et al. Reference Basu, Rambo, Strauss-Soukup, Cate, Ferre-D'amare, Strobel and Doudna1998; Cate et al. Reference Cate, Gooding, Podell, Zhou, Golden, Szewczak, Kundrot, Cech and Doudna1996b), potentially indicating a different coordination geometry (Figs 9a and 9b). The authors determined that divalent ions can compete with K+ for this site by comparing spectra with varying concentrations of Mn2+ and K+. However, K+ has been shown to enhance the activity of the Azoarcus ribozyme and has a higher affinity for this site over other monovalent ions (Basu et al. Reference Basu, Rambo, Strauss-Soukup, Cate, Ferre-D'amare, Strobel and Doudna1998; Lambert et al. Reference Lambert, Leipply, Shiman and Draper2009). Both manganese and cobalt hexamine localize at the sequential G:C base pairs (site 3), indicating that the direct coordination observed in the crystal structure is not required. Furthermore, nonlinear Poisson–Boltzmann calculations of the TR–TR electrostatic surface have revealed that the metal ion localization sites overlap with highly electronegative pockets, e.g. major grooves, as would be anticipated for diffusely bound ions (i.e., hydrated) rather than specifically bound ions (Davis et al. Reference Davis, Foster, Tonelli and Butcher2007; Misra & Draper, Reference Misra and Draper2001; Misra et al. Reference Misra, Shiman and Draper2003). These calculations, combined with the observation that the TR–TR complex does not change conformation over a range of ionic conditions, suggest that metal ions do not play a specific structural role in the tetraloop–receptor interaction. Nevertheless, their clear electrostatic necessity for promoting folding is quite another story, which will be examined in later sections (Davis et al. Reference Davis, Foster, Tonelli and Butcher2007).
The solvent accessibility of the GAAA tetraloop–receptor interface has also been assessed. It was determined that ∼730 Å of the solvent accessible surface area is buried at the interaction site (Juneau et al. Reference Juneau, Podell, Harrington and Cech2001), which suggests that water/co-solutes must be released upon tetraloop docking into the receptor. Studies of the tetraloop–receptor in the presence of PEG or dextran 12 000 reveal a clear stabilization of the interaction. This stabilization supports the idea that RNA has a higher affinity for water than PEG, i.e., it is more costly to displace water than PEG when docking (Downey et al. Reference Downey, Crisman, Randolph and Pardi2007). Sucrose and glycerol had little effect on docking, suggesting that they have similar affinity for the RNA, likely due to the presence of the vicinal hydroxyl groups. It has also been observed that increased hydrostatic pressure destabilizes T(GAAA)–R(11 nt) formation, to which a number of interactions with the solvent may also contribute (Downey et al. Reference Downey, Crisman, Randolph and Pardi2007).
6. Cation-dependent kinetics and equilibrium of GAAA tetraloop–11 nt receptor docking/undocking
6.1 Single-molecule kinetics and equilibrium of tetraloop–receptor docking/undocking
Capitalizing on the fact that the T(GAAA)-R(11 nt) interaction can form outside of a natural ribozyme framework (Butcher et al. Reference Butcher, Dieckmann and Feigon1997; Qin et al. Reference Qin, Butcher, Feigon and Hubbell2001b), we isolated it in a construct and tethered it to a passivated glass surface to monitor intramolecular docking/undocking of the tetraloop into the receptor using single-molecule FRET methods (Fig. 10) (Hodak et al. Reference Hodak, Downey, Fiore, Pardi and Nesbitt2005). Linked by a flexible single-stranded junction (poly A or poly U), the GAAA tetraloop facilely and specifically docks into its receptor, modulating the fluorescence resonance energy transfer (FRET) between the donor (Cy3) and acceptor (Cy5) fluorophores (Hodak et al. Reference Hodak, Downey, Fiore, Pardi and Nesbitt2005). Single-molecule confocal microscopy was used to monitor the donor and acceptor emission intensities, from which the efficiency of energy transfer (E FRET) is calculated ratiometrically (Fiore et al. Reference Fiore, Hodak, Piestert, Downey and Nesbitt2008; Hodak et al. Reference Hodak, Downey, Fiore, Pardi and Nesbitt2005). Such real-time E FRET traces permitted exploration of the [Mg2+]-dependent docking (k dock) and undocking (k undock) kinetics for this tertiary contact, observable by bi-stable switching between well-resolved high (docked) and low (undocked) E FRET states with FRET efficiencies of ∼0·7 and 0·3, respectively (Figs 10 and 11a). This method allows for isolation of the kinetics for forming the T(GAAA)-R(11 nt) interaction, which serves as a simplified system for benchmarking the role of ion–RNA interactions in RNA folding.
RNA FRET constructs designed to observe the intramolecular docking/undocking reaction of the GAAA tetraloop and 11 nt receptor (Downey et al. Reference Downey, Fiore, Stoddard, Hodak, Nesbitt and Pardi2006; Hodak et al. Reference Hodak, Downey, Fiore, Pardi and Nesbitt2005). (a) The GAAA tetraloop and 11 nt tetraloop receptor are connected by a single-stranded A7 linker (yellow). Cy3 and Cy5 fluorophore labels allow for monitoring of docking and undocking using FRET methods. A biotinylated region (tether) is used for immobilization on streptavidin-coated glass surfaces. (b) Alternative linkers were also explored, e.g., U7, as shown here.
Single-molecule [Mg2+]-dependent kinetics of intramolecular GAAA tetraloop–11 nt receptor docking/undocking at room temperature (Hodak et al. Reference Hodak, Downey, Fiore, Pardi and Nesbitt2005). (a) Sample real-time single-molecule FRET efficiency (E FRET) traces resolving docking and undocking transitions of the tetraloop and receptor (Fig. 10a) at varying [Mg2+]. Two E FRET states are resolved at all Mg2+ concentrations, as seen by the corresponding probability distributions. The cumulative probability densities are shown for the dwell time distributions (τ) at each [Mg2+] (right). Single-exponential fits of the dwell times for undocking and docking yield the rate constants for docking (k dock) and undocking (k undock), respectively. (b) [Mg2+] dependence of k dock, k undock, and the fractional population of the docked state (fraction docked). (c) The [Mg2+] dependence of k dock and k undock is fit to a four-state kinetic model. In this model, cation (M) bound and unbound forms of the undocked (U) and docked (D) states are indistinguishable by FRET, where k 1 and k 2 are the rate constants for docking in the absence and presence of cation, respectively, n is the Hill coefficient, and K M is the apparent dissociation constant of cations from the undocked RNA. Similarly, k −1 and k −2 are the undocking rate constants in the absence and presence of cation respectively, and K′M is the apparent dissociation equilibrium constant for Mg2+ binding to the docked RNA. The fit parameters are summarized in Table 3.
The real-time E FRET traces reveal the [Mg2+] dependence of docking/undocking in the tetraloop–receptor FRET construct. In the absence of Mg2+, the RNA spends most of it time undocked, whereas increasing [Mg2+] favors the docked conformation (Fig. 11a). The rate constants for docking and undocking are determined from the dwell times (τ) of the molecule in the undocked and docked states, respectively, as defined in the real-time trajectory by crossings of a threshold set at the minimum of the bimodal E FRET distribution (Fig. 11a). To achieve a larger dynamic range and statistical accuracy, we calculated probability densities from cumulative histograms of these docked and undocked dwell times under each experimental condition, i.e., P(τi)=H(τi)/[0·5(τi+1−τi−1)], where H(τi) is the standard histogram value and τi represents an ordered list of nonzero time bins (Hodak et al. Reference Hodak, Downey, Fiore, Pardi and Nesbitt2005). The resulting normalized docked and undocked dwell time probability densities, P(τ)/P(0), are well described by a single-exponential decays over >3 orders of magnitude (Fig. 11a, right side), with only subtle deviation from mono-exponentiality at very long dwell times – an indication of possible kinetic heterogeneity (Hodak et al. Reference Hodak, Downey, Fiore, Pardi and Nesbitt2005).
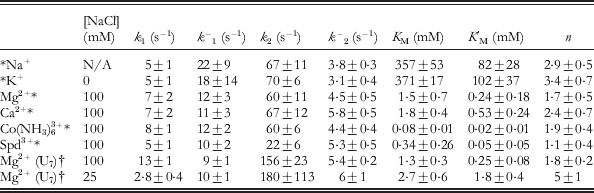
The [Mg2+] dependence of k dock and k undock at room temperature is shown in Fig. 11b for the A7 linked GAAA tetraloop–receptor construct (Fig. 10a). Increasing [Mg2+] increases k dock by 12-fold while decreasing k undock by 3-fold over the range of 0−10 mM. These trends were fit to a four-state kinetic model with cation (M)-dependent and -independent pathways for docking (Fig. 11c). In this model, ion-bound and -free states rapidly equilibrate with dissociation constants K M and K′M for the undocked and docked states, respectively. Furthermore, the ion-bound and -free forms of the undocked or docked states are experimentally indistinguishable by FRET. Thus, the experimental rate constants (k dock and k undock) in a nominally two-state picture (Fig. 10a), can be modeled as the combination an cation-dependent (k 2, k −2) and cation-independent (k 1, k −1) pathways for docking and undocking, where
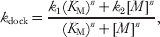 $$k_{{\rm dock}} \equals {{k_{\setnum{1}} \lpar K_{\rm M} \rpar ^{n} \plus k_{\setnum{2}} \lsqb M\rsqb ^{n} } \over {\lpar K_{\rm M} \rpar ^{n} \plus \lsqb M\rsqb ^{n} }}\comma $$
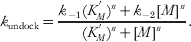 $$k_{{\rm undock}} \equals {{k_{ \minus \setnum{1}} \lpar K_{M}^{'} \rpar ^{n} \plus k_{ \minus \setnum{2}} \lsqb M\rsqb ^{n} } \over {\lpar K_{M}^{'} \rpar ^{n} \plus \lsqb M\rsqb ^{n} }}.$$
The resulting fit parameters are summarized in Table 3 for the A7 and U7 constructs (Fiore et al. Reference Fiore, Holmstrom and Nesbitt2012b; Hodak et al. Reference Hodak, Downey, Fiore, Pardi and Nesbitt2005). At high [Mg2+], k dock is large, suggesting that formation of this interaction is not a rate-limiting step in RNA folding (Hodak et al. Reference Hodak, Downey, Fiore, Pardi and Nesbitt2005), yet k undock is still appreciable, emphasizing how dynamic RNA structures can be under physiological conditions.
Four-state model kinetic parameters (Fig. 11c) for the [cation]-dependent intramolecular docking/undocking of the GAAA tetraloop and 11 nt receptor via A7 or U7 linkers (Fig. 10) at 21 °C and specified background [NaCl]
* A7 linked construct (Fig. 10a) (Fiore et al. Reference Fiore, Holmstrom, Fiegland, Hodak and Nesbitt2012a).
† U7 linked construct (Fig. 10b) (Fiore et al. Reference Fiore, Holmstrom and Nesbitt2012b).
Motivated by ensemble equilibrium measurements of the T–R FRET construct (Fig. 10), which showed that T(GAAA)–R(11 nt) docking is enabled by many different cations (Downey et al. Reference Downey, Fiore, Stoddard, Hodak, Nesbitt and Pardi2006), single-molecule methods were next used to investigate the role of cations in the kinetics of docking/undocking (Fiore et al. Reference Fiore, Holmstrom, Fiegland, Hodak and Nesbitt2012a). Specifically, the cation-dependent kinetics have been studied as a systematic function of cationic size and charge for a series of monovalent (Na+ and K+), divalent (Mg2+ and Ca2+), and trivalent [Co(NH3)63+ and spermidine3+] ions. Each of the cation titrations yielded a curvature remarkably similar to Mg2+ (Fig. 11b), namely that increasing [cation] dramatically increased k dock, while decreasing k undock. Utilizing the same four-state model (Fig. 11c, Eqs. 2 and 3) to analyze the results, we found that cation charge provides the major distinction between the ion–RNA binding affinities (Table 3), i.e., valence is the decisive determinant of the effective counterion concentration required to promote docking. However, the individual rate constants within the kinetic model are strikingly similar, indicating that each of the cations, with the exception of spermidine3+, has equal ability to perturb the RNA folding landscape when the concentration is sufficiently high. Spermidine3+ promotes folding to a lesser extent under saturating conditions than the other cations investigated, suggesting that steric effects prevent complete neutralization of the RNA phosphate groups. Analysis of the preferential interaction coefficient for cations with the RNA revealed that the number of cations taken up with folding changes dramatically as a function of cation identity and concentration, which is in line with other studies of the dual bimolecular construct (Lambert et al. Reference Lambert, Leipply, Shiman and Draper2009; Vander Meulen & Butcher, Reference Vander Meulen and Butcher2012).
Substitution of the A7 linker with a more flexible U7 alternative (Fig. 10) has a negligible effect on K M, K′M, an n (Table 3) (Fiore et al. Reference Fiore, Holmstrom, Fiegland, Hodak and Nesbitt2012a, Reference Fiore, Holmstrom and Nesbittb). This observation suggests that cation uptake with folding is dominated by the tetraloop–receptor docking interaction rather than the linker. By way of contrast, the docking rate constants (i.e., k 1 and k 2) are nearly 2-fold faster for the U7 linker construct. This result is consistent with prior expectation that base-stacking in the A7 linker can weakly interfere with achieving the correct docking transition-state (Fiore et al. Reference Fiore, Holmstrom and Nesbitt2012b).
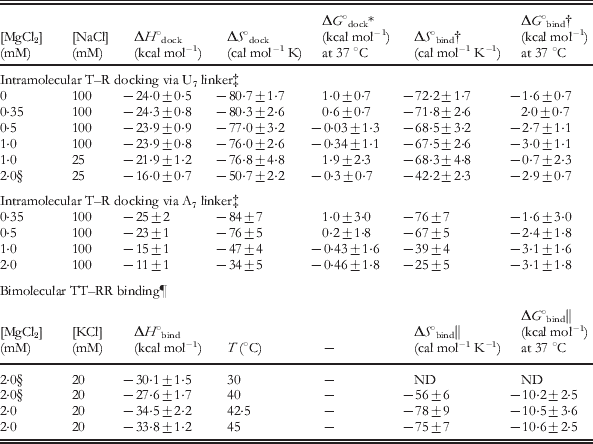
These single-molecule studies of intramolecular T(GAAA)–R(11 nt) docking can also be compared with studies of a bimolecular system. At any single-molecule condition, the equilibrium constant (K dock) can be calculated by k dock/k undock, from which one can also determine the fractional amount of time the tetraloop is bound to the receptor (fraction docked=K dock/(K dock+1), as shown in Fig. 11b (Fiore et al. Reference Fiore, Hodak, Piestert, Downey and Nesbitt2008). Thus, we can compare the single-molecule results to equilibrium studies of the bimolecular isolation of the GAAA tetraloop and 11 nt receptor (Fig. 6a). With the architecture of the single-molecule T–R construct and sufficient counterion screening, the tetraloop can access some effective volume (V eff) surrounding the receptor, which can be rigorously obtained from a partition-function weighting of all possible linker conformations. Indeed, even for a perfectly flexible linker, this accessible volume is constrained by entropic effects, as demonstrated computationally in a model nucleic acid system (Bai et al. Reference Bai, Chu, Lipfert, Pande, Herschlag and Doniach2008). Nevertheless, the intramolecular T–R system can still be interpreted in terms of a simple bimolecular analog, whereby the linker acts to enhance the effective concentration (i.e., ≈1/V eff) of the tetraloop with respect to the receptor, as discussed elsewhere (Downey et al. Reference Downey, Fiore, Stoddard, Hodak, Nesbitt and Pardi2006; Fiore et al. Reference Fiore, Holmstrom and Nesbitt2012b). As a simple upper limit of V eff for the tetraloop, therefore, we use the geometrical parameters of a standard RNA A-form helix (∼3 Å bp−1) with the tetraloop being extended by 11 bp (Fig. 10). Note that such a T–R construct conformation corresponds to a Cy3–Cy5 distance consistent with the observed undocked E FRET value (Fig. 10). This extended conformation encompasses a sphere of radius 33 Å with a geometric volume of 151 nm3, yielding a lower limit to the effective receptor concentration, [R], of ⩾11 mM. However, the receptor helix contained within this sphere prevents the tetraloop from accessing this entire volume, thus we subtract an excluded volume, as estimated by the cylindrical geometry of the receptor helix (radius 13 Å and height of 2×33 Å), yielding [R] ≈14 mM (Downey et al. Reference Downey, Fiore, Stoddard, Hodak, Nesbitt and Pardi2006; Fiore et al. Reference Fiore, Holmstrom and Nesbitt2012b). Based on the simple-binding expression in Eq. (1), we would thereby predict the corresponding bimolecular K d to be ∼0·48±0·08 mM for T–R dissociation from the single-molecule construct under 100 mM monovalent and saturating [Mg2+] conditions, where K dock=k 2/k −2≈30 (Table 3, U7) and K d=[R]/K dock. Despite the simplicity of this treatment, it is worth pointing out that this result agrees remarkably well with the actual bimolecular measurement of 0·4±0·05 mM (Qin et al. Reference Qin, Butcher, Feigon and Hubbell2001b). The K d for the A7 construct is larger (1·1±0·4 mM), as would be expected if base-stacking in the linker increases the barrier to docking. On this note, it has also been shown that the tetraloop–receptor interaction can be inhibited if single-stranded polyT is hybridized to the A linker, thereby making the junction too rigid to allow for docking (Downey et al. Reference Downey, Fiore, Stoddard, Hodak, Nesbitt and Pardi2006). Both docking and undocking events are rare when the linker is bound to polyT; therefore the rate constants for docking and undocking have not been reliably obtained in the presence of the polyT inhibitor.
The ‘on rates’ measured for bimolecular association of two constructs, one containing two GAAA tetraloops and one containing two 11 nt receptors (Fig. 9a), were also measured by a novel application of isothermal titration calorimetry (ITC) (Vander Meulen & Butcher, Reference Vander Meulen and Butcher2012) (see also Section 8.2). These on-rate constants can be readily compared with the single-molecule k dock with the assumption that formation of the first tertiary interaction is the rate-limiting step to binding. On and off rate constants for this construct have been measured at a variety of [Mg2+] and [K+] conditions; we choose just one set to illustrate the remarkably similar results obtained from these dramatically different kinetic approaches. At 100 mM KCl, for example, the bimolecular rate constant k on is observed to be 530±90 M−1 s−1 at 15 °C; thus a comparable ‘unimolecular’ rate constant for an effective receptor concentration ([R]) of 14 mM, would be k dock=7·4±0·8 s−1 (k dock=k on[R]). The most comparable condition observed in the single-molecule studies is for an A7 linked construct at 100 mM KCl and 21 °C (Fiore et al. Reference Fiore, Holmstrom, Fiegland, Hodak and Nesbitt2012a), with k dock being largely temperature independent (Fiore et al. Reference Fiore, Holmstrom and Nesbitt2012b). These values compare remarkably well – k dock=7·4±0·8 s−1 versus k dock=5·4±0·4 s−1, for the ITC and single-molecule studies, respectively.
Despite the simplicity of the T(GAAA) −R(11 nt) model system (Fig. 10), significant kinetic heterogeneity is observed (Hodak et al. Reference Hodak, Downey, Fiore, Pardi and Nesbitt2005), similar to that noted in more complex RNA systems (Bokinsky et al. Reference Bokinsky, Rueda, Misra, Rhodes, Gordus, Babcock, Walter and Zhuang2003; Tan et al. Reference Tan, Wilson, Nahas, Clegg, Lilley and Ha2003; Xie et al. Reference Xie, Srividya, Sosnick, Pan and Scherer2004; Zhuang et al. Reference Zhuang, Bartley, Babcock, Russell, Ha, Herschlag and Chu2000, Reference Zhuang, Kim, Pereira, Babcock, Walter and Chu2002). Specifically, in addition to the ∼70% actively docking/undocking, there is an ∼30% inactive (‘non-docking’) subpopulation with no transitions on the time scale of observation (Hodak et al. Reference Hodak, Downey, Fiore, Pardi and Nesbitt2005). Most importantly, this ‘non-docking’ population persists at elevated temperatures and is confirmed in studies of freely diffusing molecules (Fiore et al. Reference Fiore, Hodak, Piestert, Downey and Nesbitt2008, Reference Fiore, Kraemer, Koberling, Erdmann and Nesbitt2009), thus ruling out potential artifacts due to surface tethering. Folding heterogeneity is also resolved with native gel electrophoresis (Downey et al. Reference Downey, Fiore, Stoddard, Hodak, Nesbitt and Pardi2006). The physical origin of this robust ‘non-docking’ population is unknown. Recent single-molecule studies of the P4–P6 domain have shown that covalent modifications within an RNA can cause such long-lived kinetic heterogeneity and can be attributed to RNA preparations and purifications (Greenfeld et al. Reference Greenfeld, Solomatin and Herschlag2011). Further study is needed to elucidate if such covalent damage is responsible for heterogeneity in the tetraloop–receptor single-molecule construct or if it instead indicates an intrinsically deep furrow in the RNA folding landscape, as is suggested for functionally relevant kinetic heterogeneity in the hairpin ribozyme and Tetrahymena ribozymes (Ditzler et al. Reference Ditzler, Rueda, Mo, Hakansson and Walter2008; Solomatin et al. Reference Solomatin, Greenfeld, Chu and Herschlag2010). Trajectory data from the ‘non-docking’ tetraloop–receptor molecules are necessarily excluded from the single-molecule kinetic analysis, in that these molecules lack kinetic information due to the absence of docking/undocking events. Therefore, the rate constants obtained represent one possible folding pathway, i.e., reaction coordinate. The ability of single molecule methods to resolve kinetic heterogeneity highlights the power of such techniques to accurately characterize kinetic behavior.
In comparison with the single-molecule kinetics observed for other model RNA folding system, e.g., the hairpin ribozyme and P1 helix docking into the Tetrahymena ribozyme, the tetraloop-receptor system folds significantly faster (Bokinsky et al. Reference Bokinsky, Rueda, Misra, Rhodes, Gordus, Babcock, Walter and Zhuang2003; Hodak et al. Reference Hodak, Downey, Fiore, Pardi and Nesbitt2005; Tan et al. Reference Tan, Wilson, Nahas, Clegg, Lilley and Ha2003; Zhuang et al. Reference Zhuang, Bartley, Babcock, Russell, Ha, Herschlag and Chu2000). For example, under saturating cationic conditions at 21 °C, k dock=∼60 s−1 in the GAAA tetraloop–receptor A 7 linker system (Table 3), whereas even under the most favorable conditions (37 °C), the hairpin ribozyme only achieves k dock∼1 s−1 (Bokinsky et al. Reference Bokinsky, Rueda, Misra, Rhodes, Gordus, Babcock, Walter and Zhuang2003; Fiore et al. Reference Fiore, Holmstrom, Fiegland, Hodak and Nesbitt2012a). In that k dock for the tetraloop–receptor system is largely temperature independent (Section 8.1), we can compare these two systems to demonstrate that in spite of dramatic difference between the observed folding rates of the tetraloop–receptor and hairpin RNAs, the free energy barriers to folding are similarly large, e.g., ∼15 and ∼18 kcal mol−1, respectively (Fiore et al. Reference Fiore, Holmstrom, Fiegland, Hodak and Nesbitt2012a, Reference Fiore, Holmstrom and Nesbittb). See Section 8.1 for discussion of barrier height determination from rate constants for folding.
6.2 Freely diffusing single-molecule FRET studies of Na+- and Mg2+-dependent tetraloop–receptor docking
As seen above, single-molecule FRET techniques can be used to resolve the underlying undocked and docked populations in the T(GAAA)–R(11 nt) construct. In particular, freely diffusing single-molecule studies allow one to observe RNA conformational distributions at equilibrium without the need to immobilize molecules for a long observation time (Fiore et al. Reference Fiore, Hodak, Piestert, Downey and Nesbitt2008; Pljevaljcic et al. Reference Pljevaljcic, Millar and Deniz2004). Such freely diffusing E FRET population distributions have been determined for the T(GAAA)–R(11 nt) construct as a function of [Mg2+] (Fig. 12a) and [Na+]. The fractional docked population under freely diffusing conditions, denoted by fraction docked=N docked/(N docked+N undocked), where N docked and N undocked are determined from the integrated Gaussian area of the docked and undocked peaks (Pljevaljcic et al. Reference Pljevaljcic, Millar and Deniz2004), is plotted versus [Na+] and [Mg2+] at low and moderate [Na+] background (Fig. 12b). Similar trends are observed in these plots for both ensemble and single-molecule kinetic studies; for example, the titration midpoints in both cases are ∼500-fold larger for monovalent versus divalent cation concentrations (Downey et al. Reference Downey, Fiore, Stoddard, Hodak, Nesbitt and Pardi2006; Fiore et al. Reference Fiore, Hodak, Piestert, Downey and Nesbitt2008).
Freely diffusing single-molecule FRET study of Mg2+ and Na+ -promoted GAAA tetraloop–11 nt receptor interaction at room temperature (Fiore et al. Reference Fiore, Hodak, Piestert, Downey and Nesbitt2008). (a) E FRET population histograms of the tetraloop–receptor construct (Fig. 10) as a function of [Mg2+] with a fit of two Gaussian distributions superimposed. (b) [Mg2+] and [Na+] dependence of the fractional population of the docked state, where fraction docked=N docked/(N docked+N undocked). N docked and N undocked are determined from the integrated Gaussian area of the docked and undocked peaks. (c) Model of Mg2+ and Na+ dependent docking used to describe the mixed salt environment of the fraction docked titration in (b).
The freely diffusing single-molecule [salt] titrations revealed that (i) the docking pathway observed in the absence of Mg2+ (red circles in Fig. 12b, bottom) can be attributed to the 100 mM NaCl background (Fig. 12b, top) and (ii) that the fraction docked approaches an asymptote less than unity due to the presence of ‘non-docking’ molecules. In addition, the realization that folding in the absence of Mg2+ is due to Na+ allowed for the metal ion dependence to be fit to a model including Mg2+- and Na+-dependent pathways (Fig. 12c), and thereby enable determination of dissociation constants for both Na+ and Mg2+ (Fiore et al. Reference Fiore, Hodak, Piestert, Downey and Nesbitt2008; Hodak et al. Reference Hodak, Downey, Fiore, Pardi and Nesbitt2005). However, this freely diffusing study could not account for the full complexity of Mg2+ binding (see Section 6.1), specifically that both the docking and undocking rates are dependent on Mg2+, because such a model requires fitting variables that the freely diffusing study cannot access.
The freely diffusing study also revealed synergy between Mg2+ and Na+ at very low ionic strengths (Fiore et al. Reference Fiore, Hodak, Piestert, Downey and Nesbitt2008). As shown in Fig. 12b, at low ionic strength (50 mM HEPES, no added NaCl), the [Mg2+] curve becomes very cooperative and the titration midpoint increases. A similar increase in cooperativity is seen by the large n (Hill coefficient) in kinetic data for the U7 linker, 25 mM NaCl (Table 3) (Fiore et al. Reference Fiore, Holmstrom and Nesbitt2012b). This cooperativity suggests that Na+ electrostatically relaxes the undocked RNA, which was further examined by analysis of the E FRET peak widths in the population distributions. Studies of the line-widths support that the undocked state is considerably less constrained than the docked state, a characteristic that becomes even more pronounced at very high [NaCl].
7. Thermodynamics of isolated GAAA tetraloop–11 nt tetraloop receptor binding: ITC and single-molecule studies
7.1 [Cation]-dependent single-molecule thermodynamics of intramolecular tetraloop–receptor docking equilibrium
We have explored the temperature dependence of the intramolecular T(GAAA)–R(11 nt) docking (Fig. 10a) using immobilized and freely diffusing single-molecule FRET methods (Fiore et al. Reference Fiore, Kraemer, Koberling, Erdmann and Nesbitt2009). The equilibrium constant (K dock) for intramolecular docking has been obtained as a function of temperature (T=20 to 47 °C). Increasing temperature favors undocking, as seen in single-molecule FRET trajectories and the corresponding probability distributions (Fig. 13a). The undocked and docked conformation of the tetraloop–receptor construct are clearly assigned, allowing for determination of equilibrium constants from the ratios of integrated peak areas (K dock=area docked/area undocked). Here K dock represents the fractional dwell time in the docked versus undocked state, which is consistent between immobilized or freely diffusing methods (Fiore et al. Reference Fiore, Kraemer, Koberling, Erdmann and Nesbitt2009). K dock can also be calculated from the rate constants k dock and k undock (K dock=k dock/k undock). To extract thermodynamic information from the equilibrium constants for docking, we analyzed both the immobilized and diffusing data sets according to the van't Hoff equation,
 $$R\ln K_{{\rm dock}} \equals \minus {{\rmDelta H_{_{{{\rm dock}}} }^{^\circ } } \over T} \plus \rmDelta S_{_{{{\rm dock}}} }^{^\circ } \comma $$
from which a plot of R ln K dockversus 1/T yields a slope of −ΔH°dock and an intercept of ΔS°dock, where R is the gas constant (Fig. 13b). Both data sets yield straight line van't Hoff plots, from which least-squares fits yield ΔH°dock=−17±2 kcal mol−1 and ΔS°dock=−56±5 cal mol−1 K−1. The immobilized and freely diffusing studies are in excellent agreement. Such an analysis assumes negligible temperature-dependent changes in ΔH°dock and ΔS°dock, which is supported by calorimetry measurements of a dual tetraloop–receptor construct over the temperature range investigated in this work (Vander Meulen et al. Reference Vander Meulen, Davis, Foster, Record and Butcher2008). These single-molecule studies have been extended to explore the effect of [Mg2+] in the A7 and U7 linked tetraloop–receptor construct, with the results summarized in Table 4 (top) (Fiore et al. Reference Fiore, Holmstrom and Nesbitt2012b). The free energy of the docking ‘reaction’, ΔG°dock, can therefore be calculated at any temperature from these values (ΔG°dock=ΔH°dock−TΔS°dock), as is tabulated at 37 °C in Table 4.
Single-molecule thermodynamic analysis of the GAAA tetraloop–11 nt receptor docking equilibrium (Fiore et al. Reference Fiore, Kraemer, Koberling, Erdmann and Nesbitt2009). (a) Single-molecule E FRET trajectories and the corresponding probability distributions at 26 °C (top) and 38 °C (bottom) for the tetraloop–receptor FRET construct (Fig. 10a). The low and high E FRET peaks correspond to the undocked and docked states, respectively. The equilibrium constant for docking, K dock, is calculated as the ratio of the docked to undocked area, determined from the integrated areas of the undocked and docked peaks. Increasing temperature shifts the equilibrium to the undocked state (decreases K dock). (b) The thermodynamics of tetraloop–receptor docking/undocking equilibrium are assessed by a van't Hoff analysis (see Eq. 4), with K dock determined from freely diffusing and immobilized molecules. Linear fits of R ln K dockversus 1/T yield a slope of −ΔH°dock and intercept of ΔS°dock, which agree between both methods.
Docking of the tetraloop with the receptor results in a substantial exothermicity with unfavorable entropy change (i.e., ‘enthalpy-driven folding’), resulting in ΔG°dock values near 0 at physiological temperatures (Table 4, top). The net effect is that the tetraloop–receptor construct is very dynamic (Fig. 13a) – a feature that is common in RNA due to such enthalpy-entropy compensation (Fiore et al. Reference Fiore, Kraemer, Koberling, Erdmann and Nesbitt2009).
Thermodynamic parameters for intramolecular (Fig. 10) and dual bimolecular (Fig. 14) GAAA tetraloop–11 nt receptor interaction at various conditions
For additional thermodynamic parameters, including activation barriers, see Fiore et al. (Reference Fiore, Holmstrom and Nesbitt2012b), Holmstrom et al. (Reference Holmstrom, Fiore and Nesbitt2012) and Vander Meulen & Butcher, (Reference Vander Meulen and Butcher2012). Unless otherwise specified, buffer also contains 50 mM hemisodium HEPES (pH 7·5) and 100 μM EDTA.
* ΔG°dock=ΔH°dock−TΔS°dock=−RT ln K dock, where R is the gas constant.
† ΔG°bind for intramolecular docking is calculated by treating the intramolecular system as bimolecular with an effective RNA concentration determined by the linker (see text), to yield a bimolecular binding constant, K bind=K dock/[R], where [R] is the local concentration of the receptor, or ∼14 mM. ΔG°bind=−RT ln (K bind×1 M)=ΔH°dock−TΔS°bind with ΔS°bind=ΔS°dock−R ln (14×10−3).
‡ (Fiore et al. Reference Fiore, Holmstrom and Nesbitt2012b).
§ Most comparable conditions between the intramolecular and bimolecular measurements.
¶ 20 mM HEPES, pH 7·0, see Fig. 14 for additional data (Vander Meulen et al. Reference Vander Meulen, Davis, Foster, Record and Butcher2008).
‖ In the bimolecular TT–RR construct, K bind and ΔH°bind are measured, from which ΔS°bind and ΔG°bind are determined.
The large exothermicity and entropic cost tetraloop–receptor docking was attributed to the enthalpically stabilizing and entropically unfavorable hydrogen-bonding and base-stacking interactions that form with docking and are described in Sections 2.3 and 4 (Butcher et al. Reference Butcher, Dieckmann and Feigon1997; Cate et al. Reference Cate, Gooding, Podell, Zhou, Golden, Kundrot, Cech and Doudna1996a; Serra et al. Reference Serra, Turner, Michael and Ackers1995; Silverman & Cech, Reference Silverman and Cech1999). The large entropic penalty for folding may also originate from loss of free orientational flexibility of the tetraloop in the undocked state to the strict alignment required for docking (Cate et al. Reference Cate, Gooding, Podell, Zhou, Golden, Kundrot, Cech and Doudna1996a; Davis et al. Reference Davis, Tonelli, Scott, Jaeger, Williamson and Butcher2005; Fiore et al. Reference Fiore, Kraemer, Koberling, Erdmann and Nesbitt2009). Further studies also revealed that the origin of [Mg2+]-promoted tetraloop–receptor interaction is a reduced entropic penalty of docking. This observation was attributed to an increasing [Mg2+] decreasing the entropic penalty of counterion uptake with docking and/or reduced disorder of the unfolded conformational ensemble, e.g., by ordering the single-stranded RNA junction or the receptor region (Fiore et al. Reference Fiore, Holmstrom and Nesbitt2012b). Even more recently, the [monovalent]-dependence of T(GAAA)–R(11 nt) thermodynamics has been explored, similarly revealing that entropic rather than enthalpic factors are responsible for increased [monovalent] promoting folding. However, these entropic benefits of increased monovalent concentration come with an enthalpic penalty to folding that was completely absent in the [Mg2+]-dependence studies of the U7 linked construct. This effect suggests that monovalents may play a more important role in stabilizing non-native structures in this construct (Holmstrom et al. Reference Holmstrom, Fiore and Nesbitt2012).
Formation of the tetraloop–receptor interaction can account for ∼60% of the ΔH° and ΔS° of P4–P6 domain folding in the Tetrahymena ribozyme, suggesting that it may act as an enthalpic clamp for the domain. Comparison of the isolated tetraloop–receptor and other tertiary folding thermodynamics supports a theme that enthalpy versus entropy-driven folding is determined by the number of hydrogen-bonding and base-stacking interactions (Fiore et al. Reference Fiore, Kraemer, Koberling, Erdmann and Nesbitt2009).
7.2 Calorimetry studies of bimolecular dual tetraloop–receptor receptor association
Calorimetry [ITC and differential scanning calorimetry (DSC)], NMR, UV methods have been used to explore the thermodynamics of the GAAA tetraloop–receptor interaction in the context of bimolecular association (Vander Meulen et al. Reference Vander Meulen, Davis, Foster, Record and Butcher2008). ITC studies determined the observed enthalpy and entropy for binding (ΔH°bind and ΔS°bind) of the dual tetraloop to dual receptor constructs (TT–RR) shown in Fig. 14a. These values are summarized in the bottom of Table 4 and are in good agreement with the single-molecule studies (Section 7.1), in that the tetraloop–receptor interaction is enthalpy driven, yet entropically costly (Vander Meulen et al. Reference Vander Meulen, Davis, Foster, Record and Butcher2008). In the study by Butcher and co-workers, ΔH°bind was measured over the range of 10–47·5 °C, which revealed a heat capacity change of −0·24 kcal mol−1 K−1 (Fig. 14b). In addition, the observed equilibrium constant for binding (K bind) was determined as a function of temperature (Fig. 14c). The temperature sensitivity of the heat capacity was assigned to a temperature-dependent unbound receptor structure. Thermal denaturation experiments were also performed, which indicated that the TR–TR construct (Fig. 9a), unfolds by a minimally five-state pathway (Fig. 15) (Vander Meulen et al. Reference Vander Meulen, Davis, Foster, Record and Butcher2008).
Isothermal calorimetry (ITC) determination of dual GAAA tetraloop and dual 11 nt receptor constructs binding thermodynamics (TT–RR), adapted from Vander Meulen et al. (Reference Vander Meulen, Davis, Foster, Record and Butcher2008). (a) Secondary structure of the TT–RR heterodimer that is formed with two GAAA tetraloop–receptor interactions, as indicated with light red and green boxes. (b) Temperature dependence of the ITC-determined enthalpy of binding (ΔH°bind) of the TT and RR constructs. The trend line shows the best linear fit to the data, with slope (ΔC op,obs) of −0·24±0·04 kcal mol−1 K−1. (c) Plot of the logarithm of the binding constant [log (K bind×1 M)] versus temperature. The dotted line is the predicted temperature dependence of log K bind using 40 °C as the reference state.
Proposed structural mechanism for the unfolding process of a GAAA tetraloop–11 nt receptor homodimer (TR–TR, Fig. 9a), adapted from Vander Meulen et al. (Reference Vander Meulen, Davis, Foster, Record and Butcher2008). The bimolecular complex dissociates then each TR construct unfolds via three isomerization steps. The tetraloop is shown in red and the receptor in green and yellow.
7.3 Calorimetry versus single-molecule thermodynamics of tetraloop–receptor binding
In Section 6 we compared the intramolecular docking of the GAAA tetraloop–receptor with the bimolecular association of a single tetraloop and single receptor (Fig. 6a). This comparison suggested that the intramolecular docking interaction (Fig. 10) can be viewed as bimolecular association, whereby the effective concentration of the receptor is determined by the linker. We again employ this type of argument to compare the bimolecular binding thermodynamics of the dual tetraloop–receptor (TT–RR, Fig. 14a) to the single intramolecular docking. First, if we assume that the enthalpies are additive, the TT–RR construct should be 2-fold more exothermic than the intramolecular T–R construct. Specifically, we compare the enthalpies for intramolecular poly U (the most passive linker) T–R docking with bimolecular TT–RR binding at 2 mM MgCl2 with either 20 mM NaCl or 25 mM KCl, respectively, i.e., under the most comparable salt conditions. The U7 construct studies are performed over a 20–40 °C window; thus we use the 30 °C ITC measurement in the middle of this range for comparison (indicated with § in Table 4). Under these conditions, ΔH°bind for TT–RR assembly is −30·1±1·5 kcal mol−1 or a single T–R binding enthalpy would be 15·5±0·8 kcal mol−1, which is in excellent agreement with the measurement of intramolecular T–R docking, ΔH°dock=−16·0±0·7 kcal mol−1.
To meaningfully compare the corresponding entropies of the ITC and single-molecule T–R assays, the intramolecular T(GAAA)–R(11 nt) system must again be treated as if it were bimolecular with a known concentration of the receptor, [R]. Thereby, we can translate the overall free energy of docking into a free energy of bimolecular association, or ΔG°bind=−RT ln (K dock/[R]×1 M)=ΔH°bind−TΔS°bind, where [R]∼14 mM, as determined in Section 6.1. If we assume that the enthalpy of T–R docking is unaffected by unimolecular versus bimolecular context, we anticipate ΔH°dock=ΔH°bind, as shown above, and ΔS°bind=ΔS°dock−R ln [R]. The calculated bimolecular association values for ΔS°bind translated from the unimolecular T–R measurement are listed in Table 4. If we again compare the most similar conditions, the single construct yields ΔS°bind(T–R)= −42·2±2·3 cal mol/K−1, while ΔS°bind(TT–RR)= −56±6 cal mol−1 K−1. If ΔS°bind and ΔH°bind for each tertiary interaction were additive, then we would predict that ΔG°bind(T–R) would be approximately half of ΔG°bind(TT–RR) and we would predict ΔS°bind(TT–RR) to be twice that of ΔS°bind(T–R), or −84·4 cal mol−1 K−1, whereas the actual measurement indicates a considerably less entropic loss upon binding. Correspondingly, ΔG°bind (TT–RR) calculated at 37 °C is considerably more favorable than the addition of two T–R interactions, i.e. −10·2±2·5 kcal mol−1versus −5·8±1·4 kcal mol (Table 4, right most column).
In summary, though the enthalpy of folding due to formation of multiple tetraloop–receptor interactions appears to be the sum of the individual interactions, there is a clear suggestion of entropic tertiary cooperativity in the TT–RR construct, i.e., the binding of the first tetraloop and receptor may align and orient the second tetraloop for binding, thereby reducing the majority of entropic cost (rotational and translational) associated with binding of the second tetraloop and receptor (Vander Meulen et al. Reference Vander Meulen, Davis, Foster, Record and Butcher2008). This effect can explain the dramatically higher K ds for the single versus dual T–R constructs (Fig. 6). This agreement between isolated and dual tetraloop–receptor docking enthalpies supports a picture that tertiary structure formation in RNA may be largely enthalpically non-cooperative. In turn, this suggests an entropic origin of tertiary cooperativity, which is a characteristic of RNA folding that has been identified in several studies (Behrouzi et al. Reference Behrouzi, Roh, Kilburn, Briber and Woodson2012; Chauhan & Woodson, Reference Chauhan and Woodson2008; Sattin et al. Reference Sattin, Zhao, Travers, Chut and Herschlag2008).
8. Transition state thermodynamics of GAAA tetraloop–11 nt receptor docking: single molecule and ITC studies
8.1 An entropic barrier to tetraloop–receptor docking
The temperature dependence of the intramolecular docking and undocking kinetics of the GAAA tetraloop and 11 nt receptor (Fig. 10) has been probed to investigate the nature of the energy barrier for docking, i.e., the nature of the transition state and the thermodynamic origin of [Mg2+]-facilitated docking (Fiore et al. Reference Fiore, Holmstrom and Nesbitt2012b). Arrhenius plots (ln k versus 1/T) for k dock and k undock reveal a steep increase in k undock and a very slight decrease in k dock with temperature (Fig. 16a). To extract the activation enthalpies and entropies from the Arrhenius plots, we invoked a simple transition-state thermodynamic analysis.
Single-molecule transition-state thermodynamics of GAAA tetraloop–11 nt receptor docking in a U7 linked construct from measurements of temperature-dependent rate constants (Fiore et al. Reference Fiore, Holmstrom and Nesbitt2012b). (a) Linear fits of Arrhenius plots (ln k dock and ln k undock) versus 1/T yield the activation enthalpies (▵H‡) and entropies (▵S‡) for docking and undocking at varying [Mg2+] (Eq. 6). Increasing temperature strongly favors undocking (endothermic), while docking is less T sensitive. (b) Schematic of the reaction coordinate for intramolecular tetraloop–receptor docking, U=undocked state, ‡=transition state, D=docked state. (c) Proposed mechanism for [Mg2+]-facilitated tetraloop–receptor docking. The early transition state (undocked-like tetraloop and receptor) requires entropically disfavored tetraloop–receptor proximity and alignment, with cation (e.g., Mg2+) uptake to counter electrostatic repulsions. Subsequent docking results in additional loss of entropy to exothermic hydrogen bonding and base-stacking interactions.
From generalized transition-state theory, the reaction rate constant (e.g., k dock or k undock) can be written as
 $$k \equals \upsilon {\rm e}^{\lpar \minus \rmDelta G^{{\rm \scale70% \ddag }} \sol RT\rpar } \comma $$
where ▵G‡ is the activation free energy and υ is the attempt frequency for barrier crossing, as determined by the free energy well (Hanggi et al. Reference Hanggi, Talkner and Borkovec1990; Zhou Reference Zhou2010). If we further express the rate constant in logarithmic form, dissecting the free energy into its enthalpic and entropic components, we obtain
 $$\ln \lpar k\rpar \equals \ln \lpar \upsilon \rpar \plus {{\rmDelta S^{\rm \scale70%\ddag } } \over R} \minus {{\rmDelta H^{\rm \scale70% \ddag } } \over {RT}}\comma $$
where ▵S‡ and ▵H‡ are the activation entropy and enthalpy, respectively, which can be inferred from linear least-squares fits of ln k versus 1/T plots. The activation enthalpy (▵H‡) can be extracted rigorously from the slope. However, determining ▵S‡ from the intercept requires knowledge of R ln(υ), which requires some model dependent understanding of the attempt frequency υ. A reasonable upper limit for υ is a typical bond vibrational frequency of ∼1013 s−1 and a lower limit is imposed by solvent friction as ∼1010 s−1 (Ansari et al. Reference Ansari, Jones, Henry, Hofrichter and Eaton1992; Hanggi et al. Reference Hanggi, Talkner and Borkovec1990; Zhou Reference Zhou2010). Note that the often assumed Eyring prefactor of k BT/h∼1013 s−1 at room temperature is fortuitously close to these values, though this does not reflect any attempt frequency at all. In any event, the dependence of ▵S‡ on υ is logarithmic, therefore ▵S‡ can be reasonably assessed (say, ±R, where R≈2 cal mol−1 K−1) even when υ is not well known. Furthermore, any changes in the entropy of activation (i.e., ▵▵S‡) can be made rigorously independent of υ.
The shallow slope of ln k dockversus 1/T indicates the lack of any significant enthalpic barrier to docking (▵H‡dock≈0). However, achievement of the transition state results in a considerable loss of entropy, i.e., yielding an entropic barrier −T▵S‡>>0 (Fig. 16b). The lack of enthalpic barrier implies an ‘early’ reactant-like (i.e., ▵H‡dock≈0) transition state, i.e., that native hydrogen bonds are not formed, nor do any enthalpic rearrangements of the tetraloop or receptor occur in the transition state. Conversely, the steep rise of the undocking rate constant (k undock) with temperature yields a large enthalpic barrier and favorable entropy in achieving the transition state (i.e., ▵H‡undock>>0, −T▵S‡undock<0) (Fig. 16b). This observation corresponds to a ‘late’ transition state, i.e., one that first requires breaking of the hydrogen bonded interaction. Increasing [Mg2+] increases k dock (Fig. 16a) by decreasing the entropic barrier for docking (▵S‡dock), as is evident in the Arrhenius plots with the nearly identical slopes and yet increasing offset in y-intercepts with [Mg2+] (Fig. 16a, left).
With additional support from studies at low ionic strength and comparing the thermodynamics of A7versus U7 linker tetraloop–receptor constructs (Fig. 10), this entropic barrier to docking was suggested to originate from diffusion and alignment of the tetraloop with respect to the receptor that requires cation (e.g., Mg2+ or Na+) uptake to screen enthalpic repulsion of the tetraloop and receptor helices (Fig. 16c) (Fiore et al. Reference Fiore, Holmstrom and Nesbitt2012b). Past the transition state region, docking is enthalpy driven (exothermic) (Fig. 16b), likely corresponding to formation of the native hydrogen bonding and base-stacking interactions (Fig. 16c). The hydrogen bonding and base stacking can also account for the entropy loss from the transition state to the docked state, as a less ordered receptor becomes more ordered and/or more counterions are localized at regions of higher charge density. Additional studies of the role of monovalent ions in promoting docking also support that the transition state is ‘early,’ though it appears the transition state becomes ‘later’ as a function of [Na+] (Holmstrom et al. Reference Holmstrom, Fiore and Nesbitt2012). This shift in the transition state along the reaction coordinate has been suggested to result from stabilization of a non-native receptor structure. These studies also showed that, in spite of inducing similar docking rate constants, the underlying thermodynamics of docking can be quite different in the presence of Na+versus Mg2+ (Fiore et al. Reference Fiore, Holmstrom and Nesbitt2012b; Holmstrom et al. Reference Holmstrom, Fiore and Nesbitt2012). Analysis of the effect of mutations on the kinetic and thermodynamic (Φ-analysis) of the tetraloop–receptor docking interaction could give yet additional insight into the docking transition state (Bokinsky et al. Reference Bokinsky, Rueda, Misra, Rhodes, Gordus, Babcock, Walter and Zhuang2003; Fersht et al. Reference Fersht, Matouschek and Serrano1992).
One critical observation from the single-molecule transition-state analysis is that k dock is nearly temperature independent, whereas the undocking rate constant is the strongly affected by temperature (Fiore et al. Reference Fiore, Holmstrom and Nesbitt2012b). As a result, initial stopped-flow FRET studies of the isolated tetraloop–receptor interaction (Downey et al. Reference Downey, Fiore, Stoddard, Hodak, Nesbitt and Pardi2006) proved difficult to interpret. This difficulty arises because stopped-flow methods only allow for determination of the total rate of equilibration (k dock+k undock) for the nominally two-state system. This realization could have implications for other temperature-dependent kinetic studies. In particular, a steep temperature dependence of RNA unfolding may be a general property.
These thermodynamic studies of the simplified T(GAAA)–R(11 nt) constructs highlight the complex relationship of the ion atmosphere and the docked versus undocked conformational ensembles in determining the RNA folding landscape, defining a central role of entropy (Fiore et al. Reference Fiore, Holmstrom, Fiegland, Hodak and Nesbitt2012a; Holmstrom et al. Reference Holmstrom, Fiore and Nesbitt2012). In spite of this complexity, a common theme to RNA folding does emerge – folding transition states can be early, i.e., with native tertiary interactions largely unformed (Bartley et al. Reference Bartley, Zhuang, Das, Chu and Herschlag2003; Bokinsky et al. Reference Bokinsky, Rueda, Misra, Rhodes, Gordus, Babcock, Walter and Zhuang2003; Fiore et al. Reference Fiore, Holmstrom and Nesbitt2012b; Maglott et al. Reference Maglott, Goodwin and Glick1999; Silverman & Cech, Reference Silverman and Cech2001; Young & Silverman, Reference Young and Silverman2002).
8.2 ITC study of bimolecular tetraloop–receptor binding
A novel application of ITC has been implemented to study the free energy landscape for helical packing due to T(GAAA)–R(11 nt) interactions in bimolecular constructs (Fig. 14a). This study showed that in 100–200 mM KCl, the binding reaction is enthalpically barrierless, again supporting the idea that the transition-state for T–R docking is early (Vander Meulen & Butcher, Reference Vander Meulen and Butcher2012). Furthermore, these studies showed that folding is coupled to significant counterion uptake, consistent with the single-molecule kinetic studies (Fiore et al. Reference Fiore, Holmstrom, Fiegland, Hodak and Nesbitt2012a, Reference Fiore, Holmstrom and Nesbittb; Vander Meulen & Butcher, Reference Vander Meulen and Butcher2012). This kinetic ITC work also revealed that an enthalpic barrier to bimolecular association is observed in the presence of Mg2+, whereas an enthalpically barrierless transition is observed in a K+ environment. The authors explained this observation in terms of a possible salt-dependence of the unfolded structure, or an enthalpic penalty to Mg2+ dehydration upon its uptake with docking (Vander Meulen & Butcher, Reference Vander Meulen and Butcher2012). In contrast to the majority of the single-molecule T–R folding landscape studies (Fiore et al. Reference Fiore, Holmstrom and Nesbitt2012b; Holmstrom et al. Reference Holmstrom, Fiore and Nesbitt2012), the ITC Mg2+-dependent thermodynamic parameters were measured at low ionic strength. Thus, one should not be alarmed that the opposite monovalent versus divalent effect on the docking enthalpy was seen in the single-molecule studies (Fiore et al. Reference Fiore, Holmstrom and Nesbitt2012b; Holmstrom et al. Reference Holmstrom, Fiore and Nesbitt2012). When explicitly examining single-molecule thermodynamics under only low ionic strength, comparable to the ITC study, it does appear that Mg2+ alone increases the enthalpic barrier to folding. However, clearly the precise ionic conditions are critical in determining the underlying thermodynamics of the RNA folding landscape, as shown by these isolated studies of the tetraloop–receptor interactions.
9. Contribution of GAAA tetraloop–11 nt receptor interaction to global folding of large RNAs
Mutational and thermodynamic studies of GAAA tetraloop–11 nt receptor interaction in the P4–P6 domain of the Tetrahymena ribozyme have revealed that the tertiary interaction contributes only to the stability of the folded domain rather than the kinetics of folding, and have supported an early transition state for formation of the tetraloop–receptor interaction in folding (Silverman & Cech, Reference Silverman and Cech2001; Szewczak et al. Reference Szewczak, Podell, Bevilacqua and Cech1998; Young & Silverman, Reference Young and Silverman2002), consistent with the isolated studies (previous sections). The T(GAAA)–R(11 nt) motif has also been shown to contribute to the stability of a full group I intron (Chauhan et al. Reference Chauhan, Caliskan, Briber, Perez-Salas, Rangan, Thirumalai and Woodson2005). These studies supported that the tetraloop–receptor acts as a thermodynamic clamp to stabilize the folded RNAs (Murphy & Cech, Reference Murphy and Cech1994; Szewczak et al. Reference Szewczak, Podell, Bevilacqua and Cech1998), consistent with the observations that T(GAAA)–R(11 nt) docking in isolation is highly exothermic and can become more favorable when the entropic cost for forming the interaction is reduced by other tertiary interactions (see Section 7.3) (Fiore et al. Reference Fiore, Kraemer, Koberling, Erdmann and Nesbitt2009; Vander Meulen et al. Reference Vander Meulen, Davis, Foster, Record and Butcher2008).
Furthermore, the GAAA tetraloop–11 nt receptor interaction affects the folding pathways of ribozymes, e.g., the interaction can alter the ruggedness of the landscape or dictate the accuracy of folding (Baird et al. Reference Baird, Westhof, Qin, Pan and Sosnick2005; Chauhan & Woodson, Reference Chauhan and Woodson2008; Qin et al. Reference Qin, Sosnick and Pan2001a; Shcherbakova & Brenowitz, Reference Shcherbakova and Brenowitz2005; Treiber & Williamson, Reference Treiber and Williamson2001). The T(GAAA)–R(11 nt) interaction also directs the bending of a kink turn in the Azoarcus group I intron (Antonioli et al. Reference Antonioli, Cochrane, Lipchock and Strobel2010). Mutations of a GAAA tetraloop implicated in a tetraloop–receptor interaction in a group II intron suggested a slight morphological loop tolerance for this interaction. For example, the tetraloop could be nicked (GA.AA) and still preserve some catalytic activity (k cat/K m is 4·6 fold smaller) with loss of another factor of 5 when additional adenines were inserted into the loop (Abramovitz & Pyle, Reference Abramovitz and Pyle1997). Interactions in the Tetrahymena group I intron also show a functional tolerance to tetraloop–receptor mutations (Benz-Moy & Herschlag, Reference Benz-Moy and Herschlag2011).
As mentioned above, the tetraloop–receptor interaction can play a role in tertiary cooperativity. Disruption of the tetraloop–receptor interaction was shown to destabilize tertiary interactions by 2–3 kcal mol−1 throughout a bacterial group I intron (Chauhan & Woodson, Reference Chauhan and Woodson2008). Direct observation of tertiary cooperativity of the tetraloop–receptor and metal core interactions was made in a single-molecule FRET study of the Tetrahymena P4–P6 domain (Sattin et al. Reference Sattin, Zhao, Travers, Chut and Herschlag2008). In this study, a mutant cycle of the tertiary interactions responsible for folding of the P4–P6 domain revealed that the overall ΔG° of folding was much more favorable than the summed ΔG°’s of the individual interactions. The comparison we made between isolated and dual tetraloop–receptor docking enthalpies supports a picture that tertiary structure formation in RNA may be largely enthalpically non-cooperative. In turn, this would imply an entropic origin of tertiary cooperativity between the tetraloop–receptor and metal–core interactions observed in folding of the complete P4–P6 domain (Sattin et al. Reference Sattin, Zhao, Travers, Chut and Herschlag2008). Other studies show that tertiary cooperativity is also highly dependent on a global RNA structure (Behrouzi et al. Reference Behrouzi, Roh, Kilburn, Briber and Woodson2012), perhaps another indication that tertiary interactions limit conformational searching for the subsequent tertiary formation, i.e., again suggesting an entropic cooperativity between interactions.
Many RNA folding systems rely on protein folding chaperones and cofactors to fold and function. GNRA tetraloop–receptor interactions are implicated in the process of RNP assembly (Duncan & Weeks, Reference Duncan and Weeks2010). Specifically, MRS1, a protein co-factor that facilitates splicing, was shown to bind and stabilize the two GNRA tetraloop–receptor interactions (tandem base-pair interactions, Section 2.2) in the bI3 group I intron using a high throughput hydroxyl radical footprinting. Furthermore, MRS1 was also shown to interact with the GAAA tetraloop–11 nt receptor motifs in the Azoracus group I intron and RNAse P (Duncan & Weeks, Reference Duncan and Weeks2010).
10. Applications of the T(GAAA)–R(11 nt) interaction
As has been shown throughout this review, the canonical GAAA tetraloop–11 nt receptor is a strong and highly specific interaction; for this reason it is useful for many applications (Ishikawa et al. Reference Ishikawa, Fujita, Maeda, Furuta and Ikawa2011), some of which we highlight here.
10.1 Tecto RNA nano-objects
As utilized in numerous studies highlighted in this review, dimerized constructs containing multiple tetraloops and receptors have allowed for the biophysical characterization of tertiary interactions that might otherwise be too weak to detect (Geary et al. Reference Geary, Baudrey and Jaeger2008). These dimerized RNAs are called tecto RNAs (Westhof et al. Reference Westhof, Masquida and Jaeger1996, Reference Westhof, Jaeger, Lehnert, Massire and Michel1998a, Reference Westhof, Masquida and Jaegerb), i.e., RNAs whose modular structure permits them to be used as building blocks for assembly of RNA nano-objects (Jaeger & Chworos, Reference Jaeger and Chworos2006; Jaeger & Leontis, Reference Jaeger and Leontis2000; Jaeger et al. Reference Jaeger, Westhof and Leontis2001; Novikova et al. Reference Novikova, Hassan, Mirzoyan and Leontis2011). The selective interaction of GAAA tetraloops with 11 nt receptors indeed leads to nano-object self-assembly (Dibrov et al. Reference Dibrov, Mclean, Parsons and Hermann2011; Nasalean et al. Reference Nasalean, Baudrey, Leontis and Jaeger2006), e.g., RNA filaments, RNA squares, and supra-molecules (Ishikawa et al. Reference Ishikawa, Fujita, Maeda, Furuta and Ikawa2011; Jaeger & Chworos, Reference Jaeger and Chworos2006; Nasalean et al. Reference Nasalean, Baudrey, Leontis and Jaeger2006).
10.1 A module for RNA crystallization and structure determination
A major challenge in determining RNA structures is efficiently obtaining quality crystals that diffract to atomic resolution in X-ray crystallography. It was discovered that incorporation of the GAAA tetraloop and 11 nt receptor for intermolecular RNA–RNA interaction can serve as a nucleation site to drive crystal growth, while not biochemically affecting the RNA structure (Ferre-D'Amare et al. Reference Ferre-D'amare, Zhou and Doudna1998). This tetraloop–receptor module for crystallization is proving powerful, with the recent structural achievement of the bacterial RNase P holoenzyme in complex with tRNA (Reiter et al. Reference Reiter, Osterman, Torres-Larios, Swinger, Pan and Mondragon2010). The dual tetraloop–receptor homodimer complex (Fig. 9a) has also been used for developing and testing rapid global structure determination of RNA using NMR spectroscopy and small-angle X-ray scattering (Wang et al. Reference Wang, Zuo, Wang, Yu and Butcher2010; Zuo et al. Reference Zuo, Wang, Foster, Schwieters, Tiede, Butcher and Wang2008).
10.3 RNA selection and control
Additional applications of GAAA tetraloop–11 nt receptor interaction have aimed to capitalize on the RNA structure–function relationship. The GAAA tetraloop–receptor interaction was employed as a target for development of methodologies for selection of a novel RNA–RNA interactions and self-folding RNAs (Ikawa et al. Reference Ikawa, Fukada, Watanabe, Shiraishi and Inoue2002; Ishikawa et al. Reference Ishikawa, Fujita, Maeda, Furuta and Ikawa2011; Kashiwagi et al. Reference Kashiwagi, Yamashita, Furuta and Ikawa2009; Ohuchi et al. Reference Ohuchi, Ikawa and Nakamura2008; Shiohara et al. Reference Shiohara, Saito and Inoue2009). T(GAAA)–R(11 nt) interactions have also been incorporated into ribozymes to modulate catalytic activity in designed trans-acting ligase ribozyme and hammerhead ribozyme (Fedoruk-Wyszomirska et al. Reference Fedoruk-Wyszomirska, Szymanski, Wyszko, Barciszewska and Barciszewski2009; Matsumura et al. Reference Matsumura, Ohmori, Saito, Ikawa and Inoue2009).
11. Conclusions
GNRA tetraloop–receptor interactions are common building blocks of RNA tertiary structure. The GAAA tetraloop −11 nt receptor interaction has served as a model system for exploring RNA folding, in particular the role of metal ions. The T(GAAA)–R(11 nt) motif has been isolated in both unimolecular and bimolecular constructs, yielding the isolated kinetics and thermodynamics for formation of this tertiary interaction, as well as giving insights into tertiary cooperativity. Although the GAAA tetraloop–11 nt receptor interaction has been the subject of extensive biophysical characterization, many questions still remain. A number of 11 nt receptor mutations have been investigated for their effect on the thermodynamics of tetraloop–receptor interaction, but many of the natural variants have not been explored (Fig. 7), which may yield insight into the evolution of these enzymes. The metal ion dependent folding of any mutant would also further elucidate the role of the metal-binding sites in the folding pathway (Fig. 9). Such studies will be critical in assessing the molecular origin of the manifested thermodynamics and will need to be coupled with theoretical efforts. In particular, molecular dynamics simulations, when coupled with structural studies, can be incredibly powerful in elucidating RNA-folding pathways (Venditti et al. Reference Venditti, Clos, Niccolai and Butcher2009) and will hopefully give deeper understanding of the role of metal ions in the simplified tetraloop–receptor RNA folding systems.
Furthermore, it is crucial to characterize additional tertiary interactions at a similar level of scrutiny as the T(GAAA)–R(11 nt) interaction, both together and in isolation, to further develop predictive capabilities of RNA tertiary structure. Even very little kinetic and thermodynamic data are available for the other types of GNRA tetraloop–receptor interactions. For instance, the thermodynamic stability of GNRA tetraloop–base pair receptor interactions is not yet known (Section 2.2). Such weak interactions might now be accessible with the ITC and single-molecule methods discussed in this review. A nearly identical folding motif to that of the GNRA tetraloop is also observed for UMAC (M=A or C) loops (Zhao et al. Reference Zhao, Huang, Nagaswamy, Xia, Gao and Fox2012). Hence it would be particularly interesting to explore if such loops actually have the potential to engage in interaction with receptors not previously observed.
The GAAA tetraloop–11 nt receptor motif has been shown to be very strong, and important to the stability of many large RNAs. The motif is present in group I and group II introns and RNAse P. Given the remarkable utility of this interaction, it is surprising that it has not been identified more widely among RNAs, particularly viral RNA. Quite interestingly, the 11 nt receptor is found in an internal ribosome entry site (IRES), only differing in the flipping of the last C:G base pair to G:C. This is a common variation of the tetraloop receptor (Figs 7a and 1b) (Ramos & Martinez-Salas, Reference Ramos and Martinez-Salas1999), though a companion tetraloop has not yet been identified. Will GAAA tetraloop–11 nt receptor interactions be found in other RNAs and will other tetraloop receptors continue to be identified remain as two outstanding questions for future experimental and theoretical efforts. In any event, we can safely expect tetraloop–receptor interactions to remain a critical target and benchmarking system for further elucidating the detailed mechanisms of RNA folding.
12. Acknowledgements
This work was funded through the National Science Foundation (CHE 1012685), with additional help from the National Institute for Standards and Technology. J. L. F. was supported in part by the Optical Science and Engineering Program NSF-IGERT and National Institutes of Health/University of Colorado Biophysics Training (T32 GM-065103) grant. We would like to thank Dr Samuel Butcher for many helpful discussions in preparation of this manuscript.