1 Introduction
High-speed propulsion systems have attracted great interest in the development of hypersonic air-breathing aircraft. The idea of oblique detonative combustion induced by a supersonic fuel–air combustible mixture flowing past a wedge has prompted the development of the concept of an oblique detonation wave engine (ODWE) (Kailasanath Reference Kailasanath2003). This type of engine could achieve a high thermal cycle efficiency owing to the detonative combustion. However, for propulsion applications, it remains technically challenging to establish a steady oblique detonation in high-speed flow mixtures. Therefore, a comprehensive understanding of the initiation of oblique detonation, as well as detonation instability, is required to develop reliable supersonic combustors.
Previous studies for wedge-induced oblique detonation mainly addressed the initiations, wave structures and stabilities of oblique detonations. In the 1960s, Rubins & Rhodes (Reference Rubins and Rhodes1963) demonstrated the feasibility of oblique detonation by injecting hydrogen fuel upstream of a wedge-induced oblique shock wave and found that the concentration of reactants obviously decreased after the oblique shock wave. Pratt, Humphrey & Glenn (Reference Pratt, Humphrey and Glenn1991) studied the effects of the variation of the wedge angle on the initiation of detonation waves based on shock-wave polar analysis. The incomplete oblique detonation, oblique-shock-wave-induced combustion and non-combustion modes occurred when the wedge angle was small, and the oblique shock wave was separated from the wedge. The overdriven normal detonation and the normal-shock-wave-induced combustion appeared when the wedge angle became large.
The wave structures of wedge-induced oblique detonation were found to be different from an oblique shock wave with a post-shock energy release zone. Li, Kailasanath & Oran (Reference Li, Kailasanath and Oran1994) first illustrated the detailed structure of oblique detonation by numerical simulations and found that the detonation consists of four parts, namely, the non-reacting shock wave, induction zone, a series of deflagration waves and the reacting shock wave. This oblique shock–detonation transition through a triple wave point was confirmed experimentally and numerically (Viguier et al. Reference Viguier, da Silva, Desbordes and Deshaies1996), which was regarded as a standard wave structure (Stewart & Kasimov Reference Stewart and Kasimov2006). However, a smooth shock–detonation transition from a curved shock wave also exists without a triple wave point. Teng & Jiang (Reference Teng and Jiang2012) numerically considered the transition pattern of the oblique detonation. Inflow conditions, such as the inflow Mach number, influence the transition structure, but the shock–detonation transition modes also depend on the activation energy and heat release of the detonative mixtures. They indicated that the induction length increases with the increment of the inflow Mach number, but the effect of the inflow pressure is slight (Teng, Ng & Jiang Reference Teng, Ng and Jiang2017). Zhang, Gong & Wang (Reference Zhang, Gong and Wang2016) investigated the influence of the equivalence ratio and inflow speed on the induction zone connecting the oblique shock wave and detonation, and found that the induction length is shortest when the equivalence ratio is approximately 0.8 for the hydrogen fuel. The inhomogeneous distribution of hydrogen–air mixtures also affects the wave structures. The V-shaped deflagration as well as V + Y Mach stem depend on the non-uniform distribution of the hydrogen–air mixtures (Iwata, Nakaya & Tsue Reference Iwata, Nakaya and Tsue2017).
Under realistic conditions, the detonation waves are inherently unstable (Teng et al. Reference Teng, Ng and Jiang2017). The unstable cellular structures on the oblique detonation surface have been revealed numerically (Teng, Jiang & Ng Reference Teng, Jiang and Ng2014). The effects of activation energy and heat release on the instability of the detonation front were investigated. Choi et al. (Reference Choi, Kim, Jeung, Ma and Yang2007) found that the detonation wave changes from a stable front to a cell-like wave front as the activation energy of the reaction increases. A spatial oscillation of the shock wave and reaction front was exhibited, and an increase of the overdriven level suppressed this oscillation (Verreault, Higgins & Stowe Reference Verreault, Higgins and Stowe2013). In addition, Teng et al. (Reference Teng, Ng, Li, Luo and Jiang2015) considered the effects of wedge angle on the wave stability and found two different kinds of cellular structure.
All the above research and many other studies (Liu et al. Reference Liu, Wu, Yao and Wang2015) dealt with gaseous hydrogen fuel. Liquid hydrocarbon fuels have several practical advantages, such as easy storage, convenient application and service ability as engine coolant. However, an understanding of the initiation of oblique detonation using liquid hydrocarbon fuel is still lacking. The dispersion of fuel droplets results in distributed vapour concentrations. The interphase energy exchange can significantly alter the induction time of ignition, so that the combustion mode can be different in a supersonic combustion process mainly due to the evaporative cooling effects (Ren et al. Reference Ren, Wang, Xie and Wang2017). It is necessary to know such fundamentals for two-phase oblique detonation induced by a wedge deflecting the flow of the detonative mixtures.
Therefore, this research focused on the wedge-induced oblique detonation waves in hydrocarbon–air detonative mixtures. Furthermore, a parametric analysis was performed to reveal the effects of evaporating droplets. The hybrid Eulerian–Lagrangian formulation was used to simulate numerically the supersonic multi-phase reacting flows. The realistic inflow parameters are chosen to meet the flight conditions of an ODWE at high altitude (Wang et al.
Reference Wang, Zhang, Teng, Jiang and Ng2015), and the liquid fuel is a type of kerosene, represented by
 $\text{C}_{10}\text{H}_{20}$
.
2 Physical model and computational details
2.1 Physical model
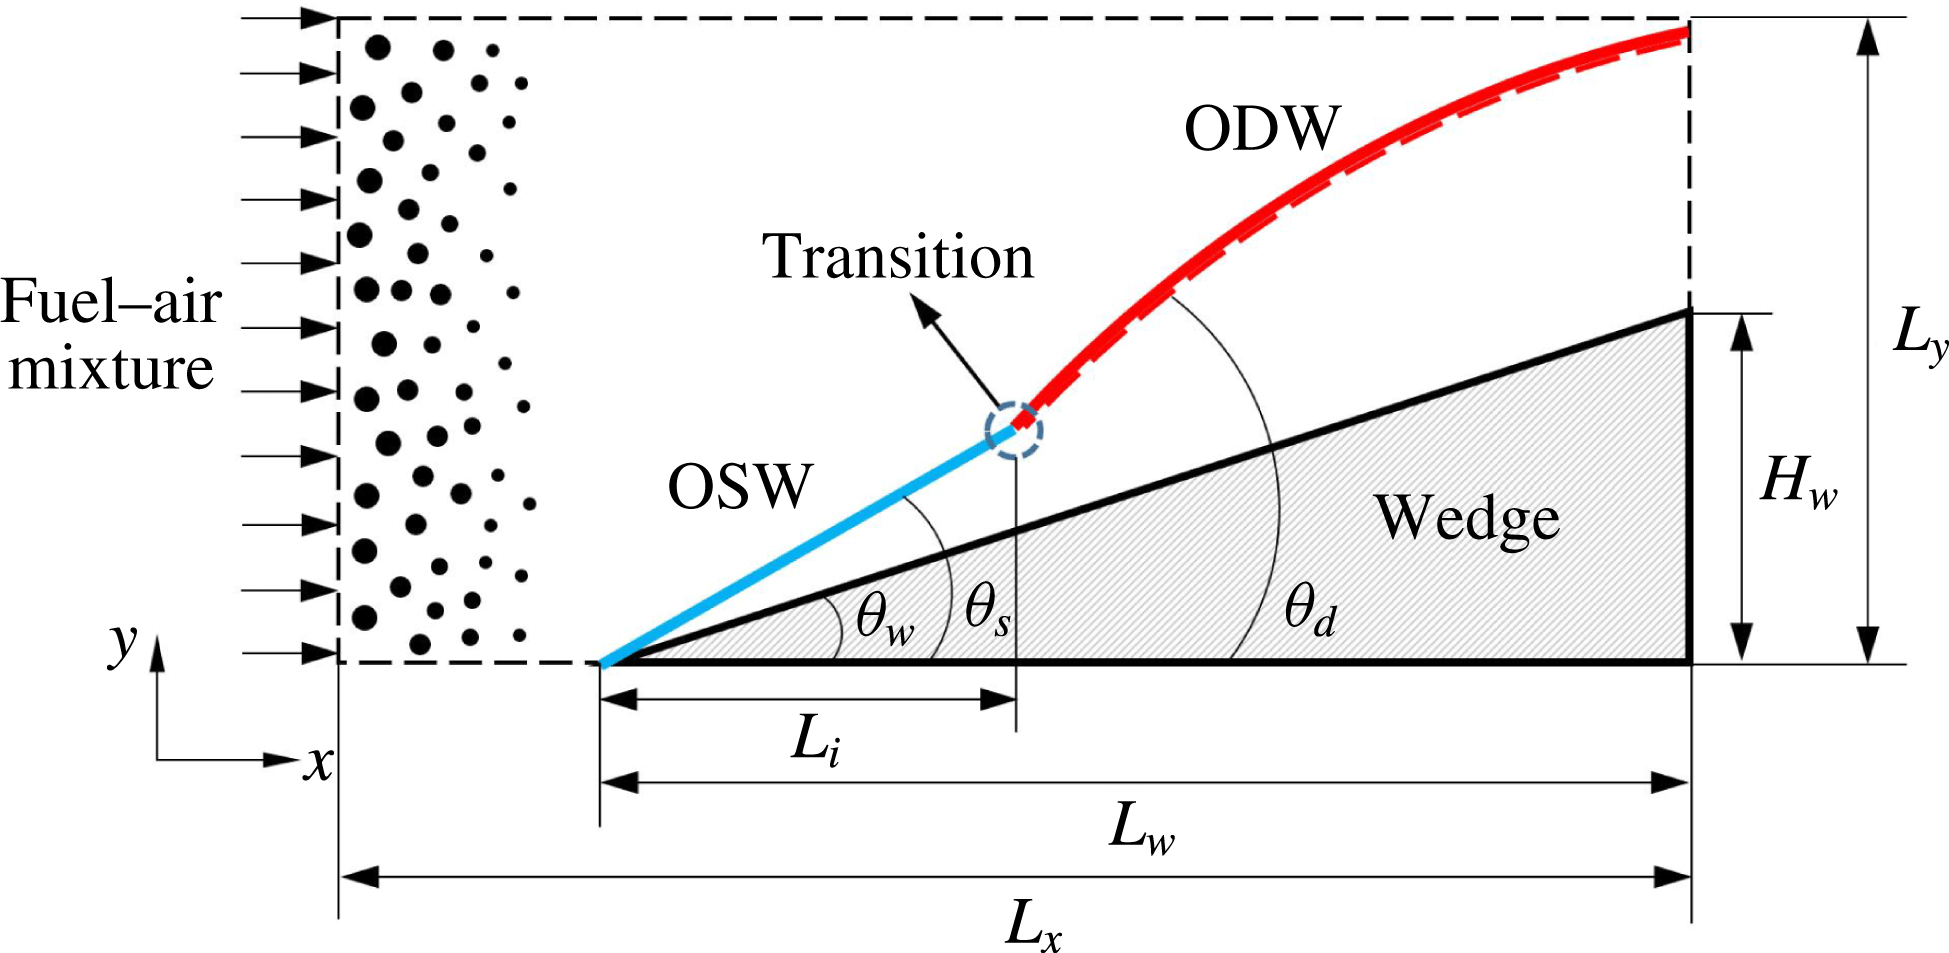
A schematic of the wedge-induced oblique detonation in a two-phase fuel–air mixture is shown in figure 1. As the incoming supersonic sprayed fuel–air mixture flows past a wedge with angle
 $\unicode[STIX]{x1D703}_{w}$
, an oblique shock wave (OSW) with angle
 $\unicode[STIX]{x1D703}_{s}$
triggers the exothermic chemical reactions and subsequently induces an oblique detonation wave (ODW) with angle
 $\unicode[STIX]{x1D703}_{d}$
downstream under certain conditions. As scaled by the dashed lines, a two-dimensional rectangular computational domain extends in the transverse direction from 0 to
 $L_{y}$
and in the streamwise direction from 0 to
 $L_{x}$
, which is discretised by a Cartesian mesh. The letters
 $x$
and
 $y$
represent the streamwise and transverse directions, respectively. The wedge has a streamwise length of
 $L_{w}$
and a height of
 $H_{w}$
equal to 0.017 m. Length
 $L_{x}$
is set to
 $3.5H_{w}$
and
 $L_{y}$
is set to
 $1.75H_{w}$
. Fuel (vapour or droplet) mixes with air and comes in from the left. The immersed boundary method (Chaudhuri, Hadjadj & Chinnayya Reference Chaudhuri, Hadjadj and Chinnayya2011) is used to construct the wedge configuration in the supersonic flow, as shown by the shadowed areas in figure 1. Length
 $L_{i}$
is the initiation length for the ODW after a transition from the OSW.
Schematic of the wedge-induced oblique detonation.

2.2 Governing equations
The governing system of equations for the supersonic flows considered in this study comprises the conservation laws of mass, momentum, energy and transport of multiple species, supplemented by the equation of state for an ideal multi-species gas:
 $$\begin{eqnarray}\displaystyle & \displaystyle {\displaystyle \frac{\unicode[STIX]{x2202}\unicode[STIX]{x1D70C}}{\unicode[STIX]{x2202}t}}+{\displaystyle \frac{\unicode[STIX]{x2202}}{\unicode[STIX]{x2202}x_{j}}}(\unicode[STIX]{x1D70C}u_{j})=S_{m}, & \displaystyle\end{eqnarray}$$
 $$\begin{eqnarray}\displaystyle & \displaystyle {\displaystyle \frac{\unicode[STIX]{x2202}}{\unicode[STIX]{x2202}t}}(\unicode[STIX]{x1D70C}u_{i})+{\displaystyle \frac{\unicode[STIX]{x2202}}{\unicode[STIX]{x2202}x_{j}}}(\unicode[STIX]{x1D70C}u_{i}u_{j}+P\unicode[STIX]{x1D6FF}_{ij}-\unicode[STIX]{x1D70F}_{ij})=S_{F,i}, & \displaystyle\end{eqnarray}$$
 $$\begin{eqnarray}\displaystyle & \displaystyle {\displaystyle \frac{\unicode[STIX]{x2202}}{\unicode[STIX]{x2202}t}}(\unicode[STIX]{x1D70C}e_{t})+{\displaystyle \frac{\unicode[STIX]{x2202}}{\unicode[STIX]{x2202}x_{j}}}((\unicode[STIX]{x1D70C}e_{t}+P)u_{j}-u_{i}\unicode[STIX]{x1D70F}_{ij}-q_{j})=S_{Q}, & \displaystyle\end{eqnarray}$$
 $$\begin{eqnarray}\displaystyle & \displaystyle {\displaystyle \frac{\unicode[STIX]{x2202}}{\unicode[STIX]{x2202}t}}(\unicode[STIX]{x1D70C}Y_{k})+{\displaystyle \frac{\unicode[STIX]{x2202}}{\unicode[STIX]{x2202}x_{j}}}(\unicode[STIX]{x1D70C}Y_{k}u_{j})+{\displaystyle \frac{\unicode[STIX]{x2202}}{\unicode[STIX]{x2202}x_{j}}}(\unicode[STIX]{x1D70C}Y_{k}(V_{k,j}+V_{j}^{c}))=S_{combustion,k}+S_{Y_{k}}. & \displaystyle\end{eqnarray}$$
Here
 $\unicode[STIX]{x1D70C}$
is the gas-phase density,
 $u_{i}$
is the velocity,
 $T$
is the static temperature,
 $P$
is the static pressure,
 $R$
is the universal gas constant,
 $Y_{k}$
is the mass fraction of species
 $k$
,
 $\unicode[STIX]{x1D70F}_{ij}$
is the Newtonian viscous stress tensor,
 $\unicode[STIX]{x1D707}$
is the molecular viscosity and
 $\unicode[STIX]{x1D706}$
is the thermal conductivity of the gaseous mixture. A correction velocity
 $V_{j}^{c}$
is added to the convection velocity in the species equations to ensure global mass conservation. Finally,
 $e_{t}$
is the total energy, i.e. kinetic energy plus internal (contained chemical) energy. The right-hand side terms of the above equations,
 $S_{m}$
,
 $S_{F}$
and
 $S_{Q}$
, describe the two-way coupling of mass, momentum and energy, respectively;
 $S_{combustion,k}$
is the source term from combustion. Thermodynamic properties are computed from fifth-order polynomials (Burcat & Ruscic Reference Burcat and Ruscic2005), and the transport properties, including viscosity, conductivity and diffusion coefficient, are obtained based on the kinetic theory (Poling et al.
Reference Poling, Prausnitz and O’Connell2001).
The phase coupling between the gaseous and dispersed-droplet phases is calculated by using the classical point source in cell (PSIC) method (Crowe, Sharma & Stock Reference Crowe, Sharma and Stock1977). The source terms,
 $S_{m}$
,
 $S_{F,i}$
,
 $S_{Q}$
and
 $S_{Y_{k}}$
, are given as
 $$\begin{eqnarray}\displaystyle & \displaystyle S_{m}=-{\displaystyle \frac{1}{\unicode[STIX]{x0394}V}}\mathop{\sum }_{N_{c}}({\dot{m}}_{d}), & \displaystyle\end{eqnarray}$$
 $$\begin{eqnarray}\displaystyle & \displaystyle S_{F,i}=-{\displaystyle \frac{1}{\unicode[STIX]{x0394}V}}\mathop{\sum }_{N_{c}}(F_{d,i}+{\dot{m}}_{d}u_{d,i}), & \displaystyle\end{eqnarray}$$
 $$\begin{eqnarray}\displaystyle & \displaystyle S_{Q}=-{\displaystyle \frac{1}{\unicode[STIX]{x0394}V}}\mathop{\sum }_{N_{c}}\left(Q_{d}+{\dot{m}}_{d}\left({\displaystyle \frac{u_{d,i}u_{d,i}}{2}}+h_{V,sf}\right)\right), & \displaystyle\end{eqnarray}$$
 $$\begin{eqnarray}\displaystyle & \displaystyle S_{Y_{k}}=\left\{\begin{array}{@{}ll@{}}-\displaystyle {\displaystyle \frac{1}{\unicode[STIX]{x0394}V}}\mathop{\sum }_{N_{c}}({\dot{m}}_{d})\quad & \text{for fuel,}\\ 0\quad & \text{for other species,}\end{array}\right. & \displaystyle\end{eqnarray}$$
where
 $\unicode[STIX]{x0394}V$
is the volume of the computational grid for the gas-phase calculation,
 $N_{c}$
is the total number of droplets that exist in each computation cell,
 $m_{d}$
denotes the droplet mass,
 $u_{d,i}$
is the droplet velocity and
 $h_{V,sf}$
is the evaporated vapour enthalpy at the droplet surface.
The liquid spray is described by many discrete computational parcels that represent droplets dispersing in the background flows. The evaporating fuel droplets are solved individually in a Lagrangian manner. Several assumptions should be made before describing the Lagrangian model. The spray of droplets is sparsely dispersed. Droplet collision and dense particle effects are neglected, as the mass loading of droplets is small. An infinite heat conduction coefficient is assumed, and the inner temperature distribution of each droplet remains uniform. The equations for the droplet displacement (in direction
 $i$
)
 $x_{d,i}$
, velocity
 $u_{d,i}$
, temperature
 $T_{d}$
, and mass
 $m_{d}$
are given by
 $$\begin{eqnarray}\displaystyle & \displaystyle {\displaystyle \frac{\text{d}x_{d,i}}{\text{d}t}}=u_{d,i}, & \displaystyle\end{eqnarray}$$
 $$\begin{eqnarray}\displaystyle & \displaystyle {\displaystyle \frac{\text{d}u_{d,i}}{\text{d}t}}={\displaystyle \frac{F_{d,i}}{m_{d}}}={\displaystyle \frac{F_{sg,i}+F_{qs,i}+F_{am,i}+F_{vu,i}}{m_{d}}}, & \displaystyle\end{eqnarray}$$
 $$\begin{eqnarray}\displaystyle & \displaystyle {\displaystyle \frac{\text{d}T_{d}}{\text{d}t}}={\displaystyle \frac{Q_{d}+{\dot{m}}_{d}L_{V}}{m_{d}c_{L}}}=\left({\displaystyle \frac{f_{Q}(\mathit{Re}_{d})}{\unicode[STIX]{x1D70F}_{a}}}\right)\left({\displaystyle \frac{\mathit{Nu}}{3Pr}}\right)\left({\displaystyle \frac{c_{p}}{c_{L}}}\right)(T_{@d}-T_{d})+\left({\displaystyle \frac{{\dot{m}}_{d}}{m_{d}}}\right){\displaystyle \frac{L_{V}}{c_{L}}}, & \displaystyle\end{eqnarray}$$
 $$\begin{eqnarray}\displaystyle & \displaystyle {\displaystyle \frac{\text{d}m_{d}}{\text{d}t}}={\dot{m}}_{d}=-m_{d}\left({\displaystyle \frac{1}{\unicode[STIX]{x1D70F}_{a}}}\right)\left({\displaystyle \frac{Sh\,c}{3Sc}}\right)\ln (1+B_{M}). & \displaystyle\end{eqnarray}$$
Here, the overall force on the droplet due to fluid–droplet coupling is denoted by
 $F_{d,i}$
, while the overall convective heat transfer between the fluid and droplets is denoted by
 $Q_{d}$
. For the two-phase detonation, the droplets could interact with the shock or detonation waves, and the unsteady forces on the droplet should be considered (Ling, Balachandar & Parmar Reference Ling, Balachandar and Parmar2016). The forces
 $F_{sg,i}$
,
 $F_{qs,i}$
,
 $F_{am,i}$
and
 $F_{vu,i}$
represent the stress-gradient, quasi-steady, added-mass and viscous-unsteady forces, respectively, whose expressions are given as
 $$\begin{eqnarray}\displaystyle & \displaystyle F_{sg,i}=V_{d}(\unicode[STIX]{x1D735}\boldsymbol{\cdot }\unicode[STIX]{x1D70F}_{ij}), & \displaystyle\end{eqnarray}$$
 $$\begin{eqnarray}\displaystyle & \displaystyle F_{qs,i}=3\unicode[STIX]{x03C0}\unicode[STIX]{x1D707}d_{d}(u_{i@d}-u_{d,i})f_{F}(\mathit{Re}_{d},M_{d}), & \displaystyle\end{eqnarray}$$
 $$\begin{eqnarray}\displaystyle & \displaystyle F_{am,i}=V_{d}C_{M}\left(\unicode[STIX]{x1D735}\boldsymbol{\cdot }\unicode[STIX]{x1D70F}_{ij}-{\displaystyle \frac{\text{d}\unicode[STIX]{x1D70C}u_{d,i}}{\text{d}t}}\right), & \displaystyle\end{eqnarray}$$
 $$\begin{eqnarray}\displaystyle & \displaystyle F_{vu,i}={\displaystyle \frac{3}{2}}d_{d}^{2}\sqrt{\unicode[STIX]{x03C0}\unicode[STIX]{x1D708}}\sqrt{\unicode[STIX]{x1D70F}_{vu}}\int _{-\infty }^{t}K_{vu}\left({\displaystyle \frac{t-\unicode[STIX]{x1D709}}{\unicode[STIX]{x1D70F}_{vu}}},\mathit{Re}_{d}\right)\left(\unicode[STIX]{x1D735}\boldsymbol{\cdot }\unicode[STIX]{x1D70F}_{ij}-{\displaystyle \frac{\text{d}\unicode[STIX]{x1D70C}u_{d,i}}{\text{d}t}}\right){\displaystyle \frac{\text{d}\unicode[STIX]{x1D709}}{\unicode[STIX]{x1D70F}_{vu}}}, & \displaystyle\end{eqnarray}$$
where
 $V_{d}$
and
 $d_{d}$
denote the droplet volume and diameter. The stress gradient force is the force due to the undisturbed ambient flow (i.e. due to the incident flow without being modified by the droplet). In the quasi-steady force formulation, the correction function that accounts for the effect of the droplet Reynolds number and droplet relative Mach number is denoted by
 $f_{F}(Re_{d},M_{d})$
, and empirical correlations of this correction function are given in Loth (Reference Loth2008). The droplet Reynolds number,
 $Re_{d}$
, is defined based on the relative velocity between the fluid and the droplet as
 $\mathit{Re}_{d}=|u_{i@d}-u_{d,i}|d_{d}/\unicode[STIX]{x1D708}$
and the droplet relative Mach number is
 $M_{d}=|u_{i@d}-u_{d,i}|/a_{@d}$
. The viscous-unsteady kernel,
 $K_{vu}$
, is defined as a function of normalised time scaled by the viscous-unsteady time scale,
 $\unicode[STIX]{x1D70F}_{vu}$
. The detailed expressions of
 $K_{vu}$
and
 $\unicode[STIX]{x1D70F}_{vu}$
are given by Ling et al. (Reference Ling, Balachandar and Parmar2016). Variables
 $u_{i@d}$
and
 $T_{@d}$
are the velocity and temperature of the gas seen by the droplet at its position;
 $c_{p}$
is the specific heat of the mixture gas and
 $c_{L}$
is the specific heat of the liquid;
 $\unicode[STIX]{x1D70F}_{a}$
is the droplet acceleration time;
 $f_{Q}(\mathit{Re}_{d})$
is the correction of heat transfer for an evaporating droplet. The non-equilibrium effect on the droplet evaporation is considered via the Langmuir–Knudsen evaporation law (Miller, Harstad & Bellan Reference Miller, Harstad and Bellan1998), which is appropriate for the evaporation of small-sized droplets in this study. The evaporation rate is controlled by the mass transfer number,
 $B_{M}=(Y_{sf}-Y_{V})/(1-Y_{sf})$
. Here
 $Y_{V}$
is the mass fraction of vapour on the far-field condition for the droplets and
 $Y_{sf}$
is the vapour surface mass fraction calculated from the surface molar fraction,
 $\unicode[STIX]{x1D712}_{sf}$
, as given below:
 $$\begin{eqnarray}\displaystyle Y_{sf} & = & \displaystyle {\displaystyle \frac{\unicode[STIX]{x1D712}_{sf}}{\unicode[STIX]{x1D712}_{sf}+(1-\unicode[STIX]{x1D712}_{sf})W/W_{V}}},\end{eqnarray}$$
 $$\begin{eqnarray}\displaystyle \unicode[STIX]{x1D712}_{sf} & = & \displaystyle {\displaystyle \frac{P_{atm}}{P}}\exp \left({\displaystyle \frac{L_{V}}{R/W_{V}}}\left({\displaystyle \frac{1}{T_{B,L}}}-{\displaystyle \frac{1}{T_{d}}}\right)\right)-{\displaystyle \frac{2L_{k}}{d_{d}}}\unicode[STIX]{x1D6FD},\end{eqnarray}$$
 $$\begin{eqnarray}\displaystyle L_{k} & = & \displaystyle {\displaystyle \frac{\unicode[STIX]{x1D707}(2\unicode[STIX]{x03C0}T_{d}(R/W_{V}))^{1/2}}{Sc\,P}},\end{eqnarray}$$
 $W$
is the averaged molecular weight of the mixture gas,
 $W_{V}$
is the molecular weight of the fuel vapour,
 $P_{atm}$
is the atmospheric pressure,
 $T_{B,L}$
is the liquid boiling temperature at
 $P_{atm}$
,
 $\unicode[STIX]{x1D6FD}$
is the non-dimensional evaporation parameter,
 $L_{k}$
is the Knudsen layer thickness and
 $L_{V}$
is the latent heat of fuel vapour at liquid temperature,
 $T_{d}$
.
2.3 Numerical procedures
The governing equations of gas–droplet flows are solved with our in-house numerical simulation code, which was previously applied to study a variety of compressible flow and combustion problems (Zhang et al. Reference Zhang, Wang, Zhang and Xue2014; Qian et al. Reference Qian, Bing, Huiqiang, Yunlong and Wei2016; Ren et al. Reference Ren, Wang, Xie and Wang2017), and a series of validations was also conducted. The computations were validated against the simulations of non-reacting supersonic shear layers and single-droplet evaporations (Ren et al. Reference Ren, Wang, Xie and Wang2017), and the simulation results were in good agreement with the available experimental measurements.
For shock capture in a supersonic flow, a shock-capturing scheme with high order and low dissipation is essential for the reliability of the simulation. In addition, the assurance of conservation of transporting species is necessary for the calculation of multi-species reacting flow. The present study takes into account the above two issues. An overview of the numerical procedures is shown below. A finite difference methodology is applied for the multi-physics simulations. For the full multi-species, the Roe-averaged matrix for the flux projection is calculated (Fedkiw, Merriman & Osher Reference Fedkiw, Merriman and Osher1997), and a high-order-accurate maximum principle (MP) satisfying scheme (Zhang & Shu Reference Zhang and Shu2010) for the scalar conservation is utilised. The numerical fluxes at the grid interfaces are reconstructed by the adaptive central-upwind sixth-order weighted essentially non-oscillatory (WENO-CU6) scheme (Hu, Wang & Adams Reference Hu, Wang and Adams2010) to consider the efficiency of simulating the turbulent fields with low dissipation and to achieve a good resolution of the steep variation of flow properties around shock and detonation waves. The WENO-CU6 scheme is verified and validated for several examples, such as shock-tube problems, interacting blast waves and double Mach reflection of a strong shock. Compared with other high-order numerical schemes, it preserves good shock-capturing properties and achieves a small numerical dissipation. A sixth-order symmetric compact difference scheme is applied for the viscous diffusion terms. An explicit third-order Runge–Kutta methodology is applied for time integration.
In forward coupling (gas-to-droplet coupling), the physical quantities of the gas at the position of a specific droplet are obtained by using a fourth-order Lagrangian polynomial interpolation method from the Eulerian velocity field. A third-order Adams–Bashforth time integration is used to obtain the new position of a droplet, and the velocity and the temperature of the droplet are obtained using the same integration method. The inter-phase interactions during a calculation time step are considered after the completion of the final droplet computation.
A two-step reduced chemical scheme (Franzelli et al.
Reference Franzelli, Riber, Sanjosé and Poinsot2010) containing six species (
 $\text{C}_{10}\text{H}_{20}$
,
 $\text{O}_{2}$
,
 $\text{N}_{2}$
,
 $\text{CO}$
,
 $\text{CO}_{2}$
and
 $\text{H}_{2}\text{O}$
) and validated for a wide range of pressure, temperature and equivalence ratio (Kitano et al.
Reference Kitano, Kaneko, Kurose and Komori2016) is adopted for the kerosene (KERO) kinetics. The rates of change of chemical species are calculated explicitly by a third-order Runge–Kutta methodology.
The chemical scheme is based on the following two reactions:
 $$\begin{eqnarray}\displaystyle \displaystyle \text{KERO}+10\text{O}_{2} & \Rightarrow & \displaystyle 10\text{CO}+10\text{H}_{2}\text{O}\end{eqnarray}$$
 $$\begin{eqnarray}\displaystyle \displaystyle \text{CO}+0.5\text{O}_{2} & \rightleftharpoons & \displaystyle \text{C}\text{O}_{2}.\end{eqnarray}$$
The forward reaction rates for the reactions in (2.18) and (2.19) respectively are written as follows:
 $$\begin{eqnarray}\displaystyle & \displaystyle k_{f,1}=A_{1}\,f_{1}(\unicode[STIX]{x1D719})\text{e}^{-(E_{a,1}/RT)}[\text{KERO}]^{n_{KERO}}[\text{O}_{2}]^{n_{\text{O}_{2},1}}, & \displaystyle\end{eqnarray}$$
 $$\begin{eqnarray}\displaystyle & \displaystyle k_{f,2}=A_{2}\,f_{2}(\unicode[STIX]{x1D719})\text{e}^{-(E_{a,2}/RT)}[\text{CO}]^{n_{CO}}[\text{O}_{2}]^{n_{\text{O}_{2},2}}. & \displaystyle\end{eqnarray}$$
The subscripts 1 and 2 denote the kerosene oxidation and the
 $\text{CO}{-}\text{CO}_{2}$
equilibrium reactions, respectively. Detailed information about the parameters in (2.20) and (2.21) can be found in Franzelli et al. (Reference Franzelli, Riber, Sanjosé and Poinsot2010). The time scales between the analytical solution and numerical simulation are compared. First, a prior theoretical prediction for the reactive time scales is applied. Based on the zero-dimensional perfectly stirred reactor model (0D PSR), the ignition delay time scale,
 $\unicode[STIX]{x1D70F}_{ig}$
, for a stoichiometric flame at the temperature and pressure of the post-oblique shock flow is around
 $0.75~\unicode[STIX]{x03BC}\text{s}$
. Then the time scales for the oblique detonation are calculated. For case V, the time scale,
 $\unicode[STIX]{x1D70F}_{s-d}$
, from the induction of oblique shock to the formation of detonation is approximately
 $0.65~\unicode[STIX]{x03BC}\text{s}$
. The two time scales are very close. Therefore, the oblique detonation wave stabilised on the wedge can be obtained, as shown in the following subsection.
2.4 Computational condition and grid sensitivity
For the inflow condition, considering an air-breathing aircraft with flight altitude of 30 km and Mach number of 10, the incoming flow is pre-compressed by the oblique shock waves in the inlet diffuser (Wang et al.
Reference Wang, Zhang, Teng, Jiang and Ng2015). Thus, the resulting inflow Mach number,
 $M_{0}$
, for the combustor inlet is 5.1. The inflow static pressure is
 $P_{0}=0.05$
MPa and static temperature is
 $T_{0}=1000$
K. The inflow Reynolds number
 $Re_{\infty }$
based on the wedge height is
 $Re_{\infty }=\unicode[STIX]{x1D70C}_{0}U_{0}H_{w}/\unicode[STIX]{x1D707}_{0}=2.2\times 10^{5}$
. These parameters are chosen as the inflow conditions of the computational domain.
A wall boundary condition is used on the wedge surface and the other boundaries are zero gradients, which are interpolated by assuming first-order derivatives of all flow parameters. The wedge starts from
 $0.75H_{w}$
and the wedge angle
 $\unicode[STIX]{x1D703}_{w}$
equals
 $20^{\circ }$
. The flow at the inlet is a fuel–air mixture and the fuel is either vapour or liquid droplets. For the two-phase mixture, the initial droplet velocity is identical to the velocity of the local carrier gas, and the initial droplet temperature is
 $T_{d}=298.15$
K. The initial droplet size,
 $d_{0}$
, remains uniform.
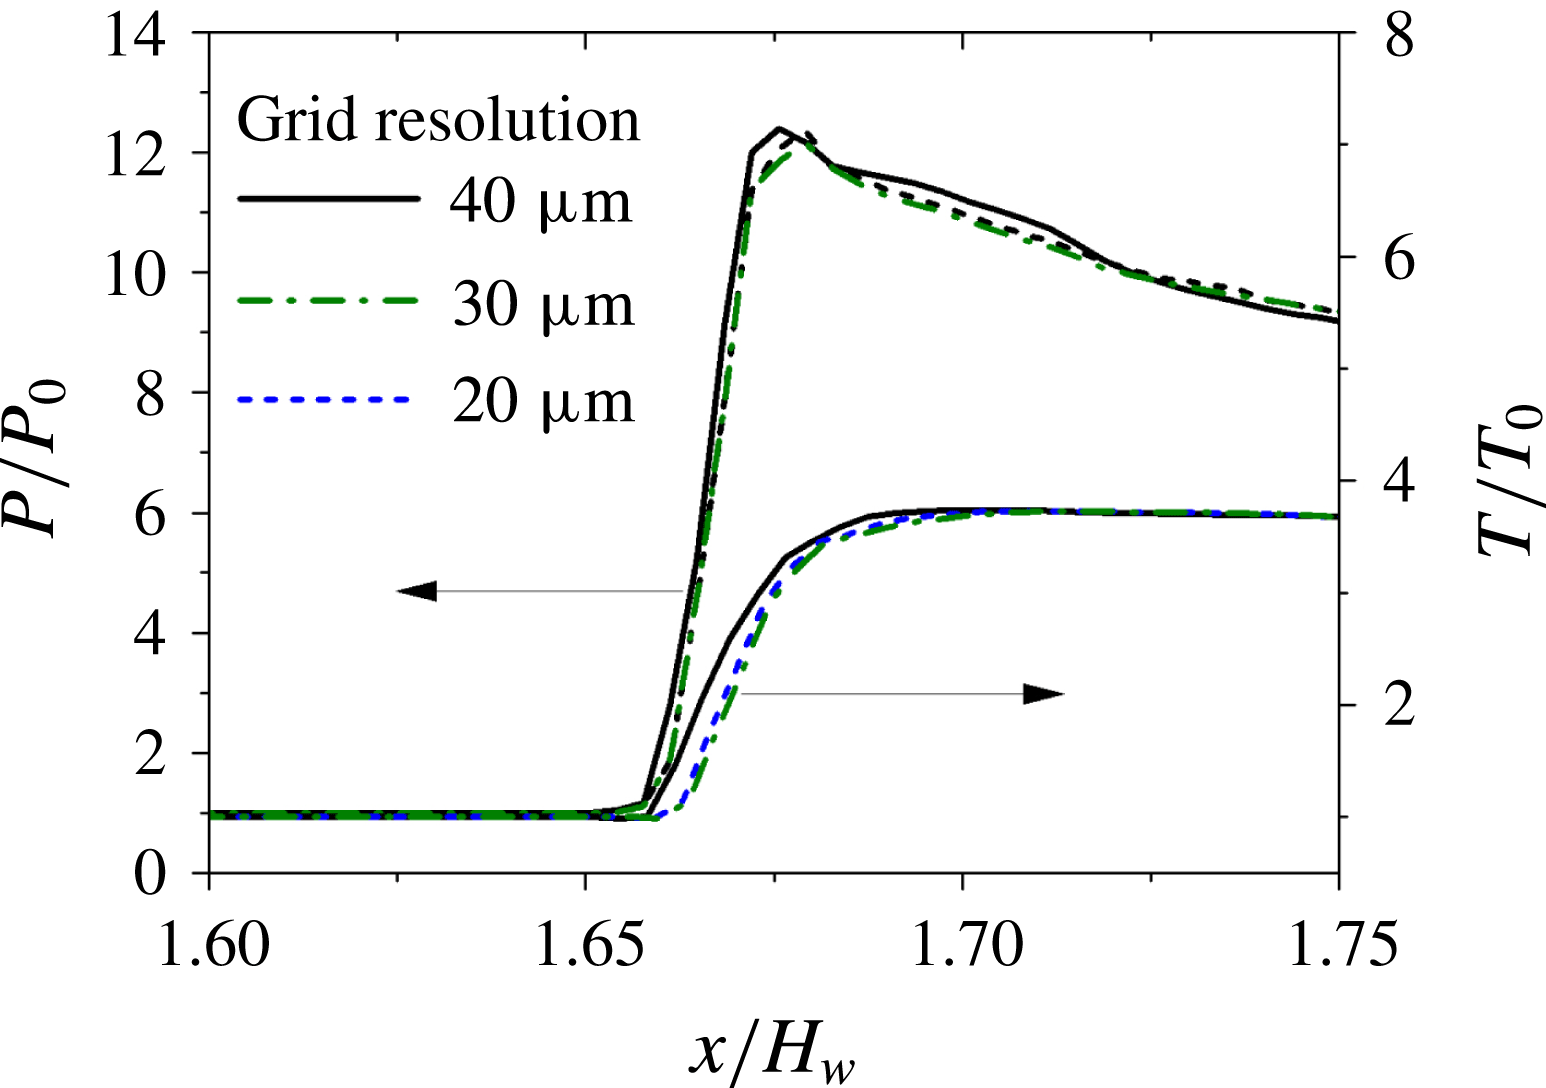
Because of the multi-scale nature of the detonation phenomena, the mesh scales are adjusted for the grid independence test for the simulation case of a stoichiometric vapour–air mixture. Three sets of grids with different resolutions are utilised, and the grid sizes are 40, 30 and
 $20~\unicode[STIX]{x03BC}\text{m}$
, respectively. The streamwise profiles along
 $y=0.6H_{w}$
that cross the oblique detonation wave are plotted in figure 2. The static gaseous pressure and temperature are normalised by the inflow pressure
 $P_{0}$
and temperature
 $T_{0}$
, respectively. The difference between the simulated structures by reducing the grid size from 30 to
 $20~\unicode[STIX]{x03BC}\text{m}$
is negligible. Therefore, for the consideration of calculation costs, the grid size is finally taken as
 $30~\unicode[STIX]{x03BC}\text{m}$
for the next step of the study and the computational grids achieve independence, which is sufficient to guarantee the reliability of the conclusion.
Comparison of numerical results at different grid sets showing dimensionless pressure
 $P/P_{0}$
and dimensionless temperature
 $T/T_{0}$
along
 $y=0.6H_{w}$
.

3 Detonating sprayed two-phase mixtures
First, the oblique detonation of sprayed two-phase mixtures is studied. The fuel–vapour/air, fuel–vapour/droplet/air and droplet/air are considered as detonative mixtures with a stoichiometric fuel-to-oxidiser ratio.
A basic case, case V, is used to study the oblique detonation formed in a gaseous mixture. For case V-D, the two-phase inflow fluids contain the gaseous mixture of fuel vapour and air, and the liquid fuel droplets. The mass flow rate of fuel vapour equals the mass flow rate of fuel droplets. The initial droplet diameter is
 $2.0~\unicode[STIX]{x03BC}\text{m}$
. With the same initial droplet size, case D solely uses droplets as the fuel. The simulations for the present study are summarised in table 1.
Fuel types and droplet parameters for the simulation cases.

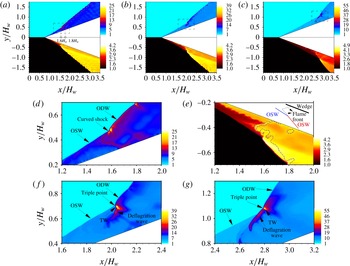
Prior to the simulations of the two-phase oblique detonation stabilised on the wedge, the oblique detonation wave structure with fuel vapour for case V is shown in figure 3(a). The ODW starts from the streamwise location
 $x=1.6H_{w}$
, and it is found that the transition from the OSW to the ODW is smooth with a curved shock wave, as depicted by the enlarged snapshot around the transition zone in figure 3(d). Because oblique detonation is generally overdriven, the onset of the disturbance of the detonation front is observed after the ODW is formed. The first obvious formation of the triple point is around
 $x=1.8H_{w}$
, as shown by the distribution of pressure, and then the detonation surface tends to be cellular and unstable. As shown by the temperature distribution, the combustion process in the shocked gas changes. The gas after the ODW is found to achieve a much higher temperature than that after the OSW due to the disparities of temperature rise for detonation and deflagration. Vortices are generated as a result of the slip velocities between the flows after the ODW as well as OSW, and are advected in a layer near the wall surface. The local enlarged snapshot of gaseous temperature around the transition zone is shown in figure 3(e), and the dashed lines correspond to
 $P/P_{0}=10$
. A V-shaped deflagration front (Iwata et al.
Reference Iwata, Nakaya and Tsue2017) appears and its leading edge is located away from the surface of the wedge due to the interaction of compression waves and wedge surface.
(a–c) Distributions of dimensionless pressure
 $P/P_{0}$
(upper panel) and dimensionless temperature
 $T/T_{0}$
(lower panel) for (a) case V, (b) case V-D and (c) case D. (d,e) Enlarged snapshots of (d)
 $P/P_{0}$
and (e)
 $T/T_{0}$
around the transition zone for case V. (f,g) Enlarged snapshots of
 $P/P_{0}$
around the transition zone for (f) case V-D and (g) case D.

As liquid fuel droplets are added into the inflow fuel–air mixtures, the droplets with a lower temperature are heated up by the surrounding gas with a higher temperature. The evaporation of the droplets relies on the heat transferred from the ambient gas. On the other hand, the gas around the droplets tends to be cooled due to the latent heat of droplet evaporation, and the local gaseous temperature is hence reduced. The droplets with a small
 $d_{0}$
are found to be completely evaporated before they pass through the detonation front. By adding the droplets to the inflow from case V to case V-D, the initiation position of ODW moves further downstream, as shown in figure 3(b). Compared with case V, figure 3(f) depicts that, for case V-D, a multi-wave point with much higher pressure is formed, and the oblique shock-to-detonation transition is achieved abruptly, rather than developing gradually through a curved shock. For case D, the fuel in the inflow is solely liquid droplets. Compared with case V-D, the incoming gaseous temperature for case D is reduced to a higher degree, because more droplets are injected and more heat from the surrounding gas is needed for droplet evaporation. The initiation of ODW for case D needs a longer distance, almost 1.6 times longer than that of case V without droplets. In addition, the abrupt transition pattern becomes more obvious with a set of stronger transverse waves, and the multi-wave turning point connecting OSW and ODW has higher pressure as well as temperature, as depicted in figure 3(g). When the fuel in the incoming flow changes from gaseous vapour to liquid droplets, cases V-D and D recover the typical structure with a set of pressure waves from the exothermic reactions in the shocked gas, as described in the previous literature (Choi et al.
Reference Choi, Kim, Jeung, Ma and Yang2007).
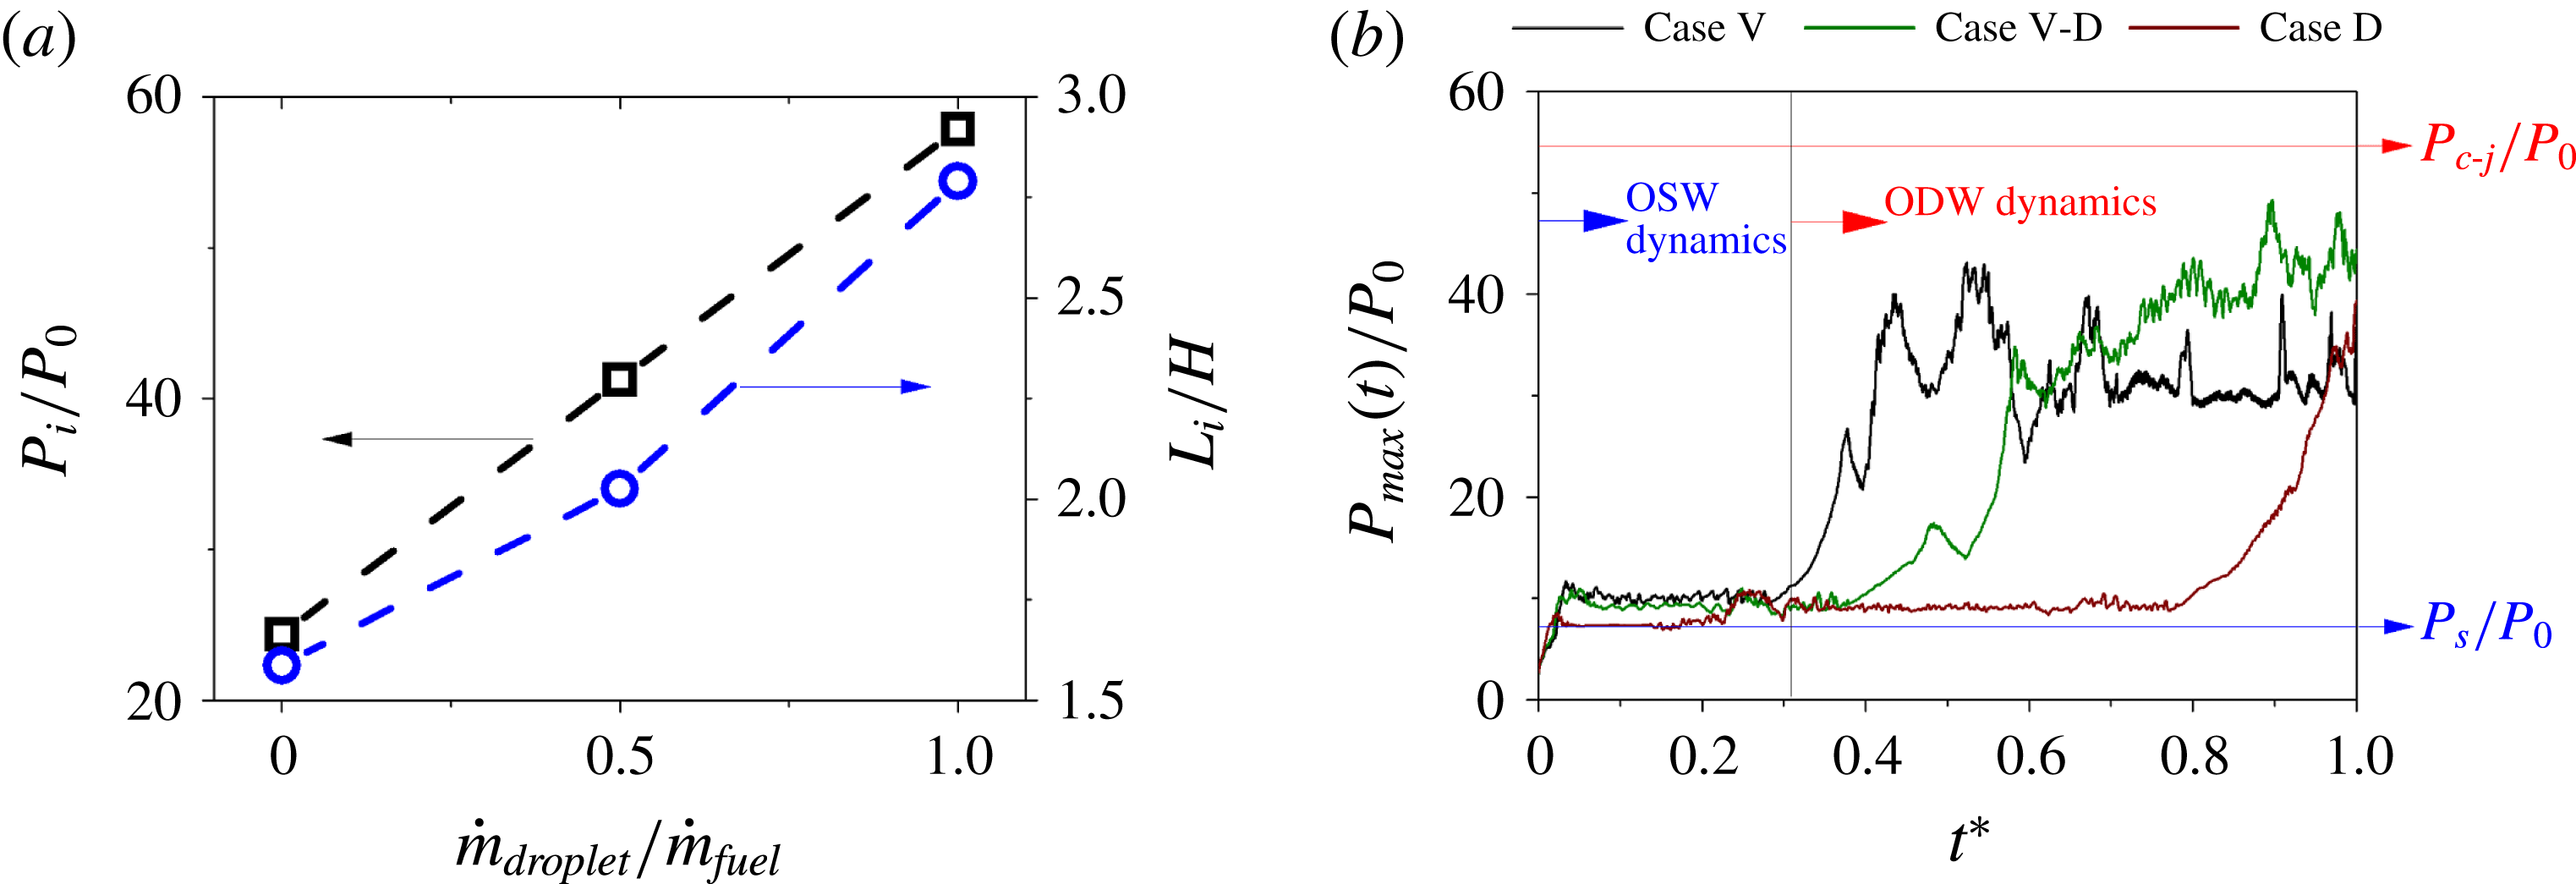
Initiation characteristics of ODW: (a) the dependence of the initiation length and transition pressure on the droplet mass flow rate, and (b) the maximum dimensionless gaseous pressures in the flow field during one flow cycle, in which the black, green and red curves represent the cases V, V-D and D, respectively.

To further quantify the effects of the evaporating fuel droplets, a characteristic initiation length,
 $L_{i}$
, is considered (Teng et al.
Reference Teng, Ng and Jiang2017);
 $L_{i}$
is defined along the streamwise direction. It starts from the initiation of the oblique shock and terminates at the initiation of the oblique detonation, as shown in figure 1, i.e. the location at which the transition from OSW to ODW occurs. Figure 4(a) depicts
 $L_{i}$
as a function of droplet mass flow rate by extracting the necessary data from the overall flow field. Furthermore, the pressure at the transition position is also shown in figure 4(b), and it is non-dimensionalised by the inflow pressure. The pressure at the transition position increases with the increase of the droplet mass flow rate. From case V to case D, as more fuel droplets are injected, the gaseous temperature (denoted as
 $T_{0d}$
affected by the evaporating droplets) becomes lower because of the evaporative heat loss. Although the resulting increase of inflow Mach number (denoted as
 $M_{0d}$
affected by the evaporating droplets) was found to accelerate the initiation of ODW in previous research (Teng et al.
Reference Teng, Ng and Jiang2017), the decrease from
 $T_{0}$
to
 $T_{0d}$
has a more significant effect on the decrease in post-shock temperature and delays the initiation of ODW, compared with the increase in post-shock temperature caused by the increase from
 $M_{0}$
to
 $M_{0d}$
. Therefore,
 $L_{i}$
increases and the transition from OSW to ODW changes from a smooth pattern to an abrupt one, accompanied by the obvious increase of the transition pressure.
The dynamics of ODW initiation are investigated by analysing the time-series data. The maximum gaseous pressure,
 $P_{max}(t)/P_{0}$
, in the flow field is recorded once the fuel droplets or vapour is injected from the inflow boundary, as shown in figure 4(b). Here, the dimensionless time is
 $t^{\ast }=t/t_{flow}$
and
 $t_{flow}$
is a characteristic time of the flow cycle from the inflow to the outflow boundaries;
 $P_{c\text{-}j}$
is the Chapman–Jouguet (CJ) detonation pressure of a stoichiometric mixture of fuel–vapour/air; and
 $P_{s}$
is the pressure after OSW. Those values are calculated theoretically according to the CJ theory and classical oblique shock-wave theory, respectively. The variations of
 $P_{max}(t)/P_{0}$
indicate that the wave dynamics mainly has two features, namely the dynamics of OSW and ODW. Taking case V as an example with the black line in figure 4(b), once the supersonic reactive mixtures have passed the wedge, the OSW is formed, accompanied by a rapid increase of gaseous pressure. Then,
 $P_{max}(t)/P_{0}$
is found to oscillate with small amplitudes during the time from
 $t^{\ast }=0.04$
to
 $t^{\ast }=0.3$
. During the time from the initiation of OSW to the end of the related pressure oscillation, the variation of
 $P_{max}(t)/P_{0}$
is mainly attributed to the wave dynamics of OSW, and the interactions between the supersonic inflow and wedge surface lead to this oscillation of
 $P_{max}(t)/P_{0}$
. ODW is found to be formed due to the coupling of OSW and post-shock chemical reactions, associated with the rapid increase of
 $P_{max}(t)/P_{0}$
. During this period, the pressure variation is mainly due to the formation of ODW as well as ODW dynamics, which is also marked in figure 4(b). The oscillations of
 $P_{max}(t)/P_{0}$
in the ODW dynamics region are much stronger than those in the OSW dynamics region, and this is mainly affected by the complex coupling between the leading shock and the chemical reactions. In addition, the equivalence ratio is the same for all three simulations, but the delay of ODW initiation increases as the droplet mass flow rate increases from case V-D to case D. This is due to the evaporation delay, because the chemical reactions will not occur until the droplets evaporate to form reactive mixtures.
4 Effects of initial droplet size on detonating
This section focuses on the initiation and wave structure of ODW affected by the initial droplet size. Case D-DL has the same equivalence ratio but a larger initial droplet size (
 $d_{0}=4.0~\unicode[STIX]{x03BC}\text{m}$
) compared with case D.
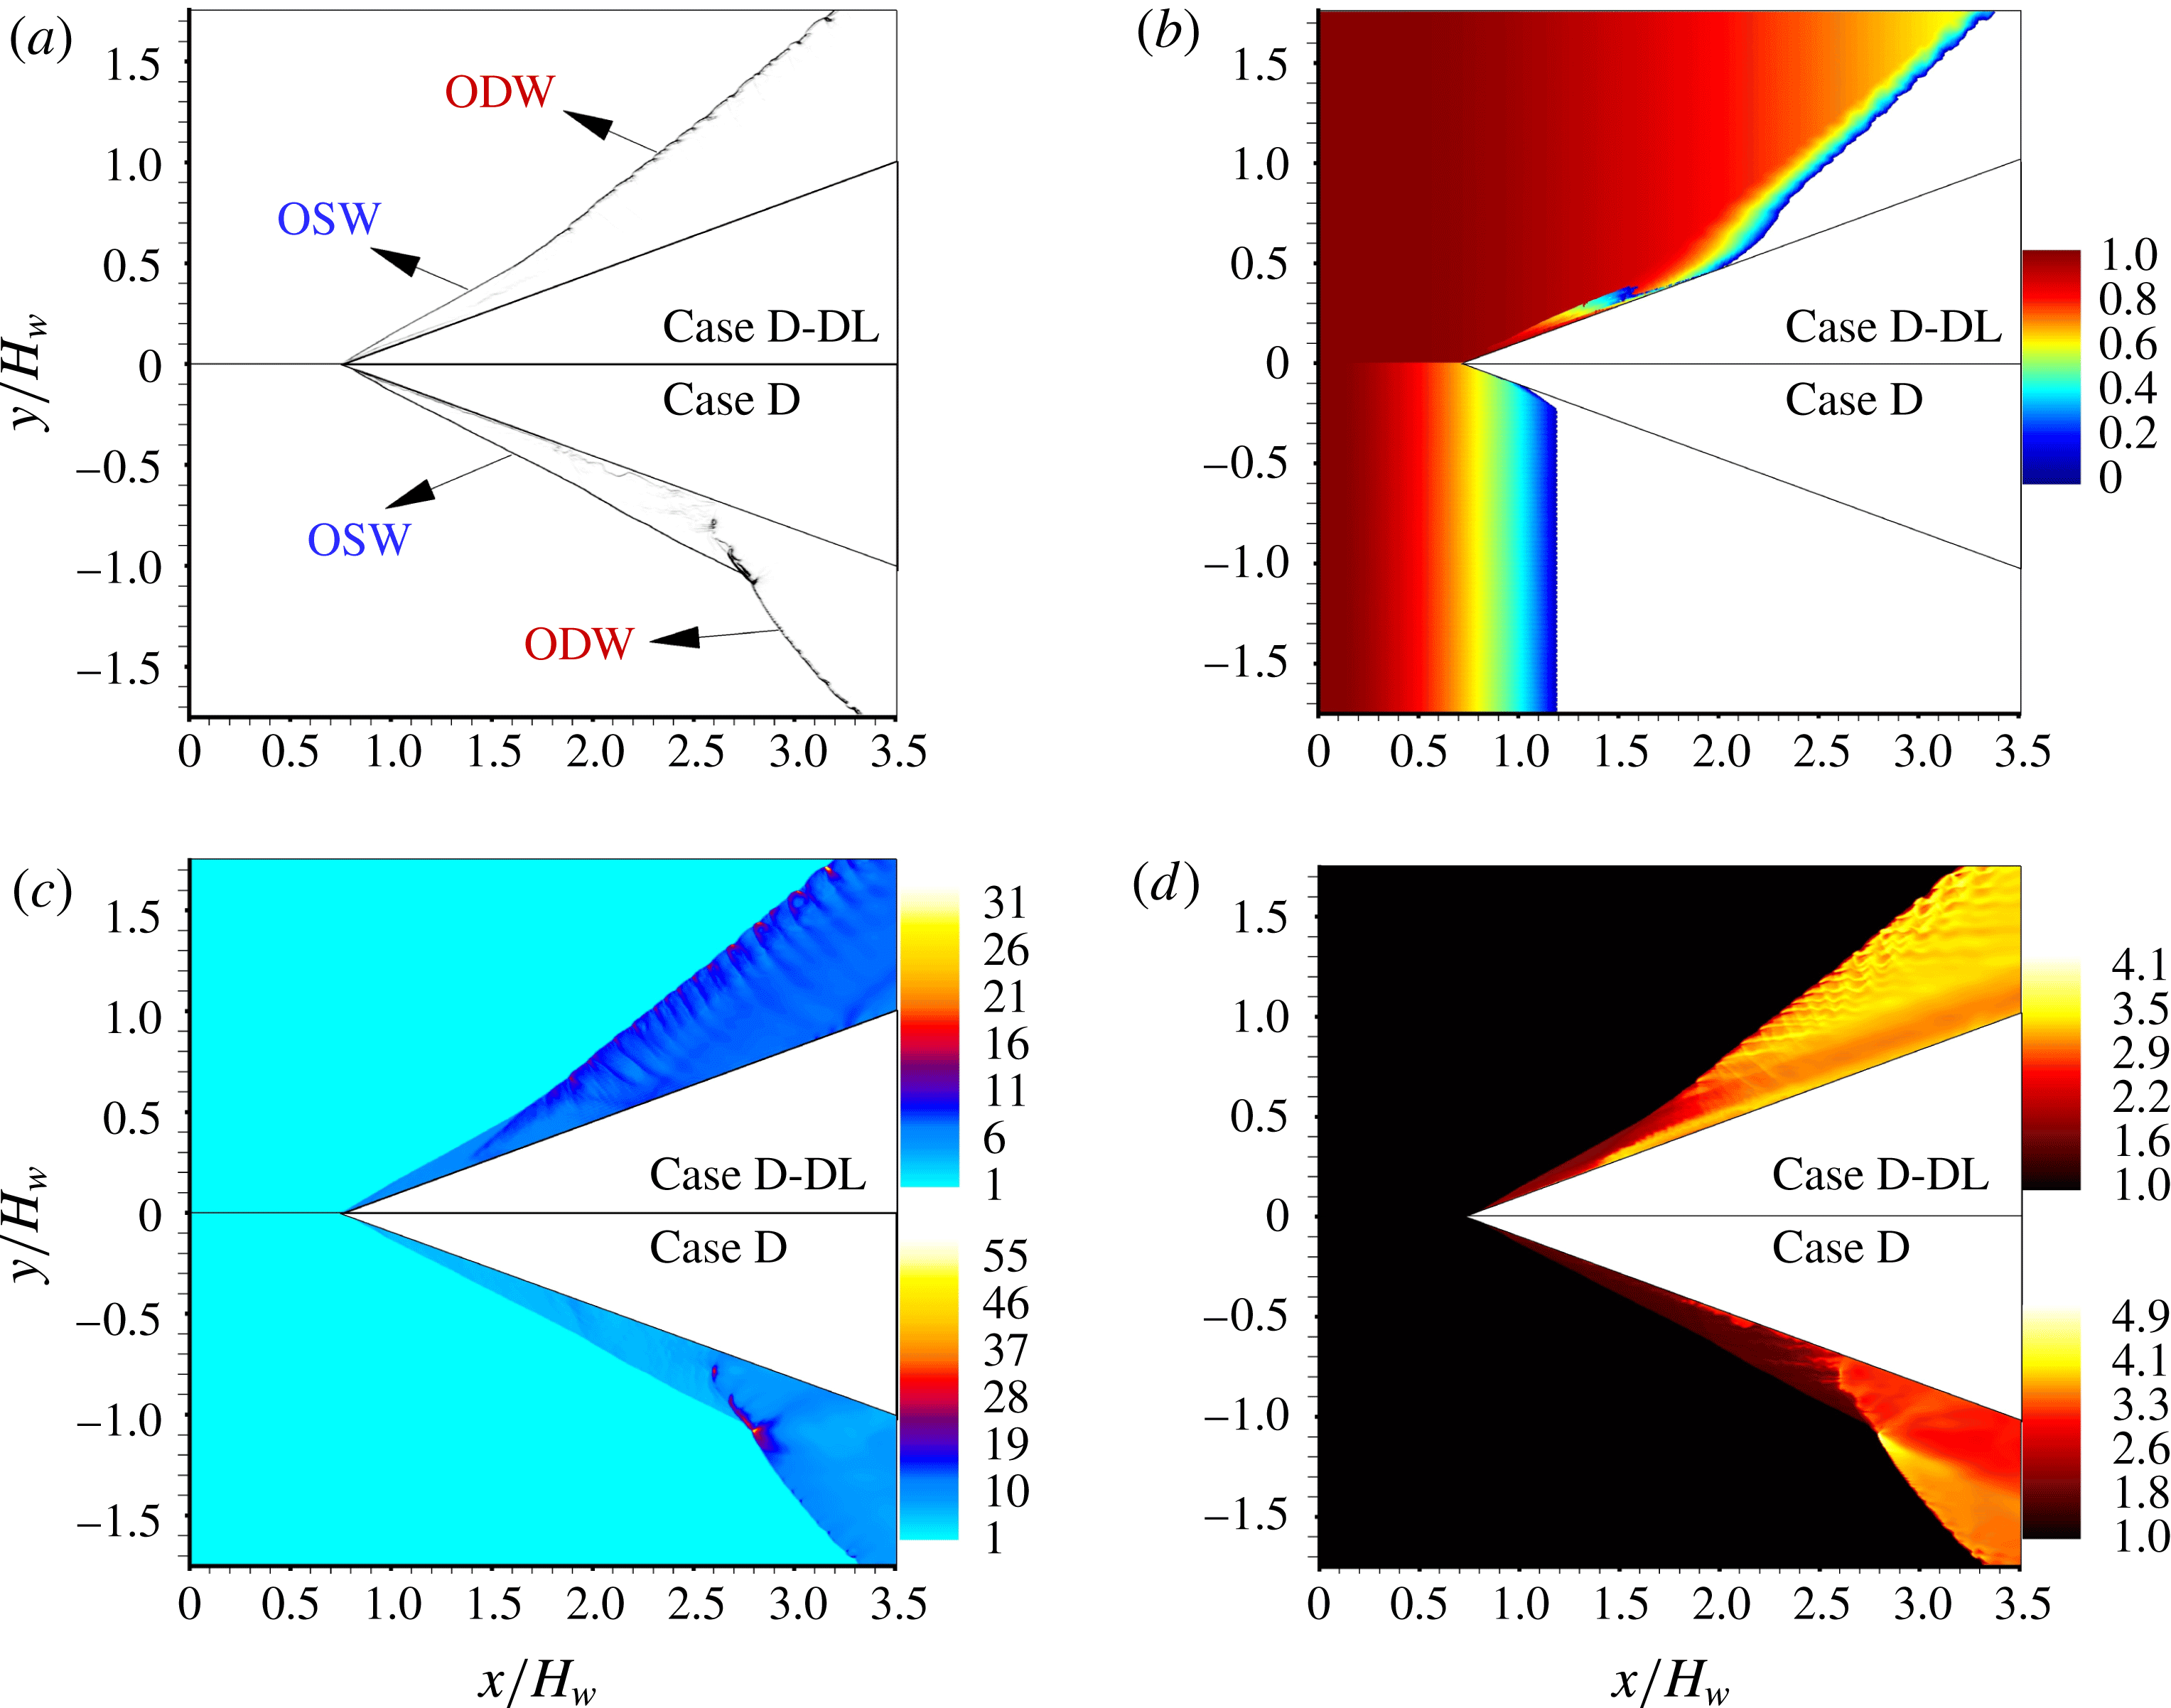
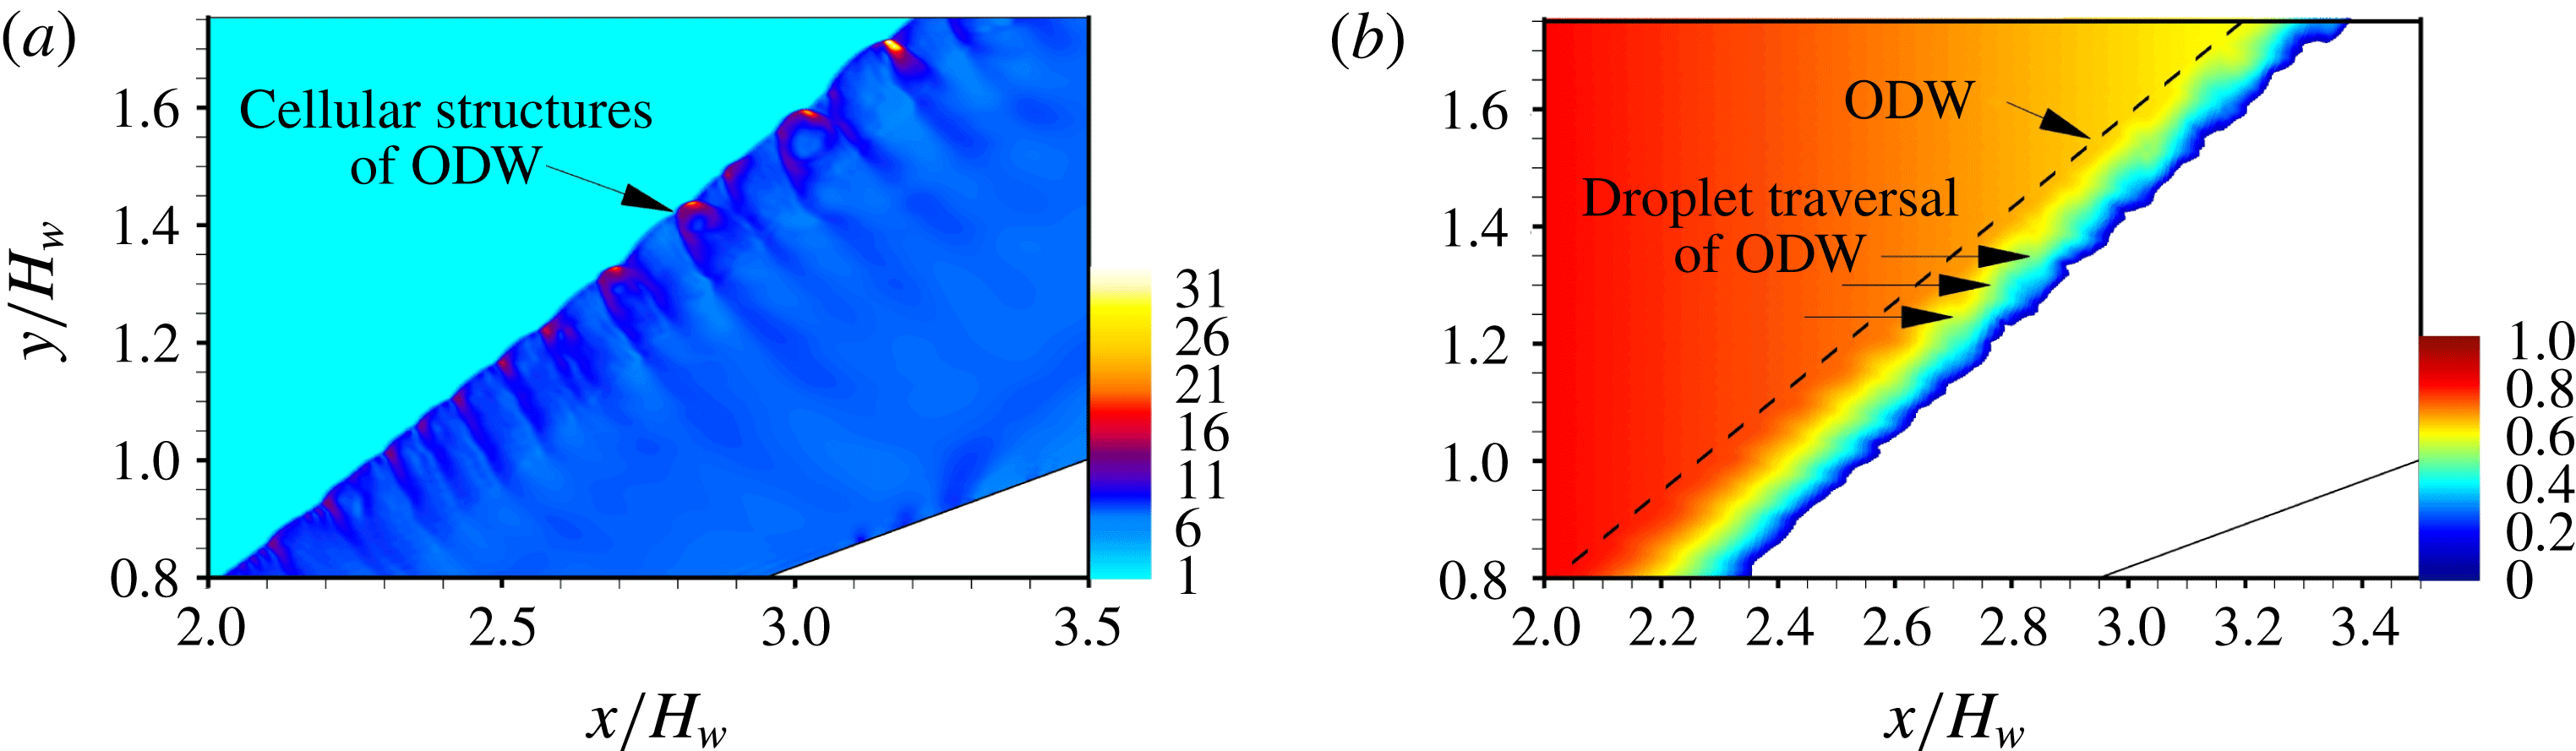
The increase in initial droplet size results in a decrease of evaporation rate and a longer droplet lifetime. As shown in figure 5, the droplets traverse the oblique shock wave as well as the oblique detonation wave. The droplet sizes decrease slowly as they disperse towards the ODW surface, and there is a sudden decrease of the droplet size as they pass through the ODW, as shown by the local enlarged snapshot of the droplet distributions around the ODW in figure 6(b). The acceleration of the droplet evaporation is attributed to the increase of pressure and temperature of the post-ODW gas. The cellular structures of ODW and the associated disturbed velocity fields of the post-ODW gas lead to the non-uniform distribution of the droplets that traverse the ODW, as shown by the pressure of detonation surface and the front of the droplet clusters across the ODW in figures 6(a) and 6(b), respectively. This is because the droplets follow the motion of the surrounding gas and respond to the variation of the gas velocity across the ODW. Also, there exists a droplet accumulation zone near the upstream wedge. This is mainly because the fuel droplets impinge on the wedge wall and bounce off, resulting in a local segregation. Compared with case D, the transition pattern for case D-DL with larger droplets changes to a smooth mode, in which the OSW–ODW transition is achieved gradually through a curved shock, and the initiation position of ODW moves upstream, as shown by the pressure distributions in figure 5(c). This transition pattern tends to be like that of case V with gaseous fuel, and the reason will be discussed later. In addition, the transition pressure decreases obviously. Because of the modulation from evaporating droplets, for case D-DL, different combustion characteristics can be observed, as depicted by the temperature distributions in figure 5(d). The triggered exothermic reaction in the post-OSW flows results in a moderate temperature increase, and a set of compression waves with a moderate pressure increase is found, corresponding to the smooth transition pattern.
Numerical schlieren image (a), distributions of fuel droplets (b), dimensionless pressure
 $P/P_{0}$
(c) and dimensionless temperature
 $T/T_{0}$
(d) for cases D-DL and D. Here, the droplet colours correspond to the dimensionless droplet diameter,
 $d/d_{0}$
, in (b).

Enlarged snapshots of oblique detonation surface for case D-DL: dimensionless pressure
 $P/P_{0}$
(a) and distributions of fuel droplets (b). Here, the droplet colours correspond to the dimensionless droplet diameter,
 $d=d_{0}$
, in (b).

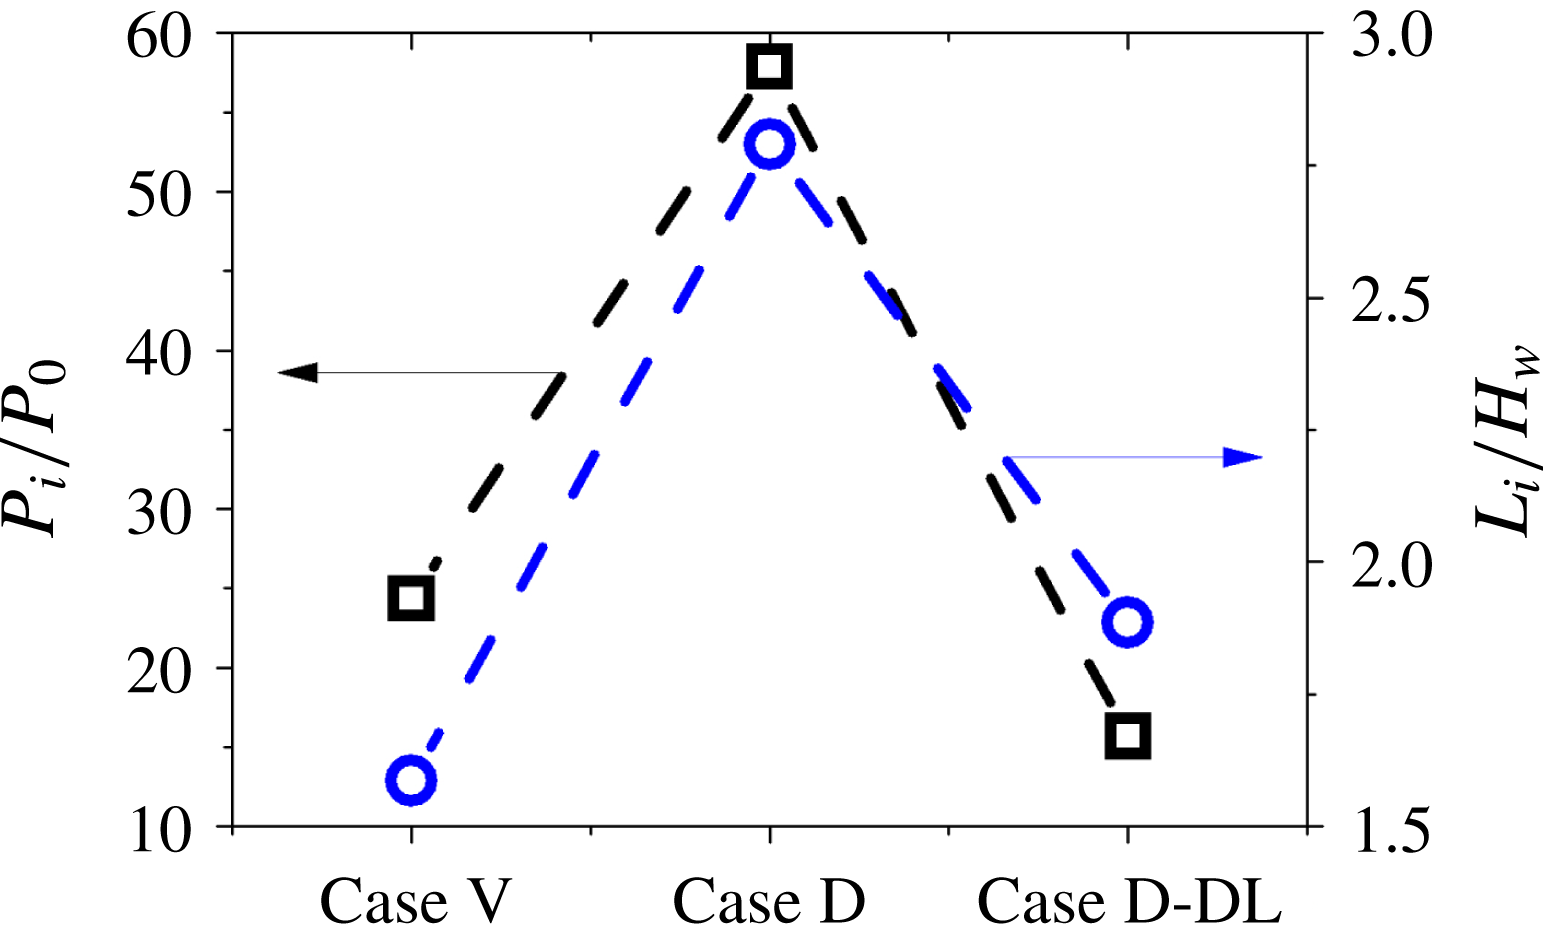
Figure 7 depicts the transition pressure,
 $P_{i}$
, and the initiation length,
 $L_{i}$
, as a function of the initial droplet size. Case V of the gaseous detonation is used as a comparison. The increase of initial droplet size results in a decrease of the transition pressure and an acceleration of the detonation initiation. The transition from OSW to ODW for case D-DL with large-sized droplets becomes similar to that of the gaseous detonation of fuel–vapour and air. A detailed discussion will be given later.
The dependence of the initiation length and transition pressure on the initial droplet size.

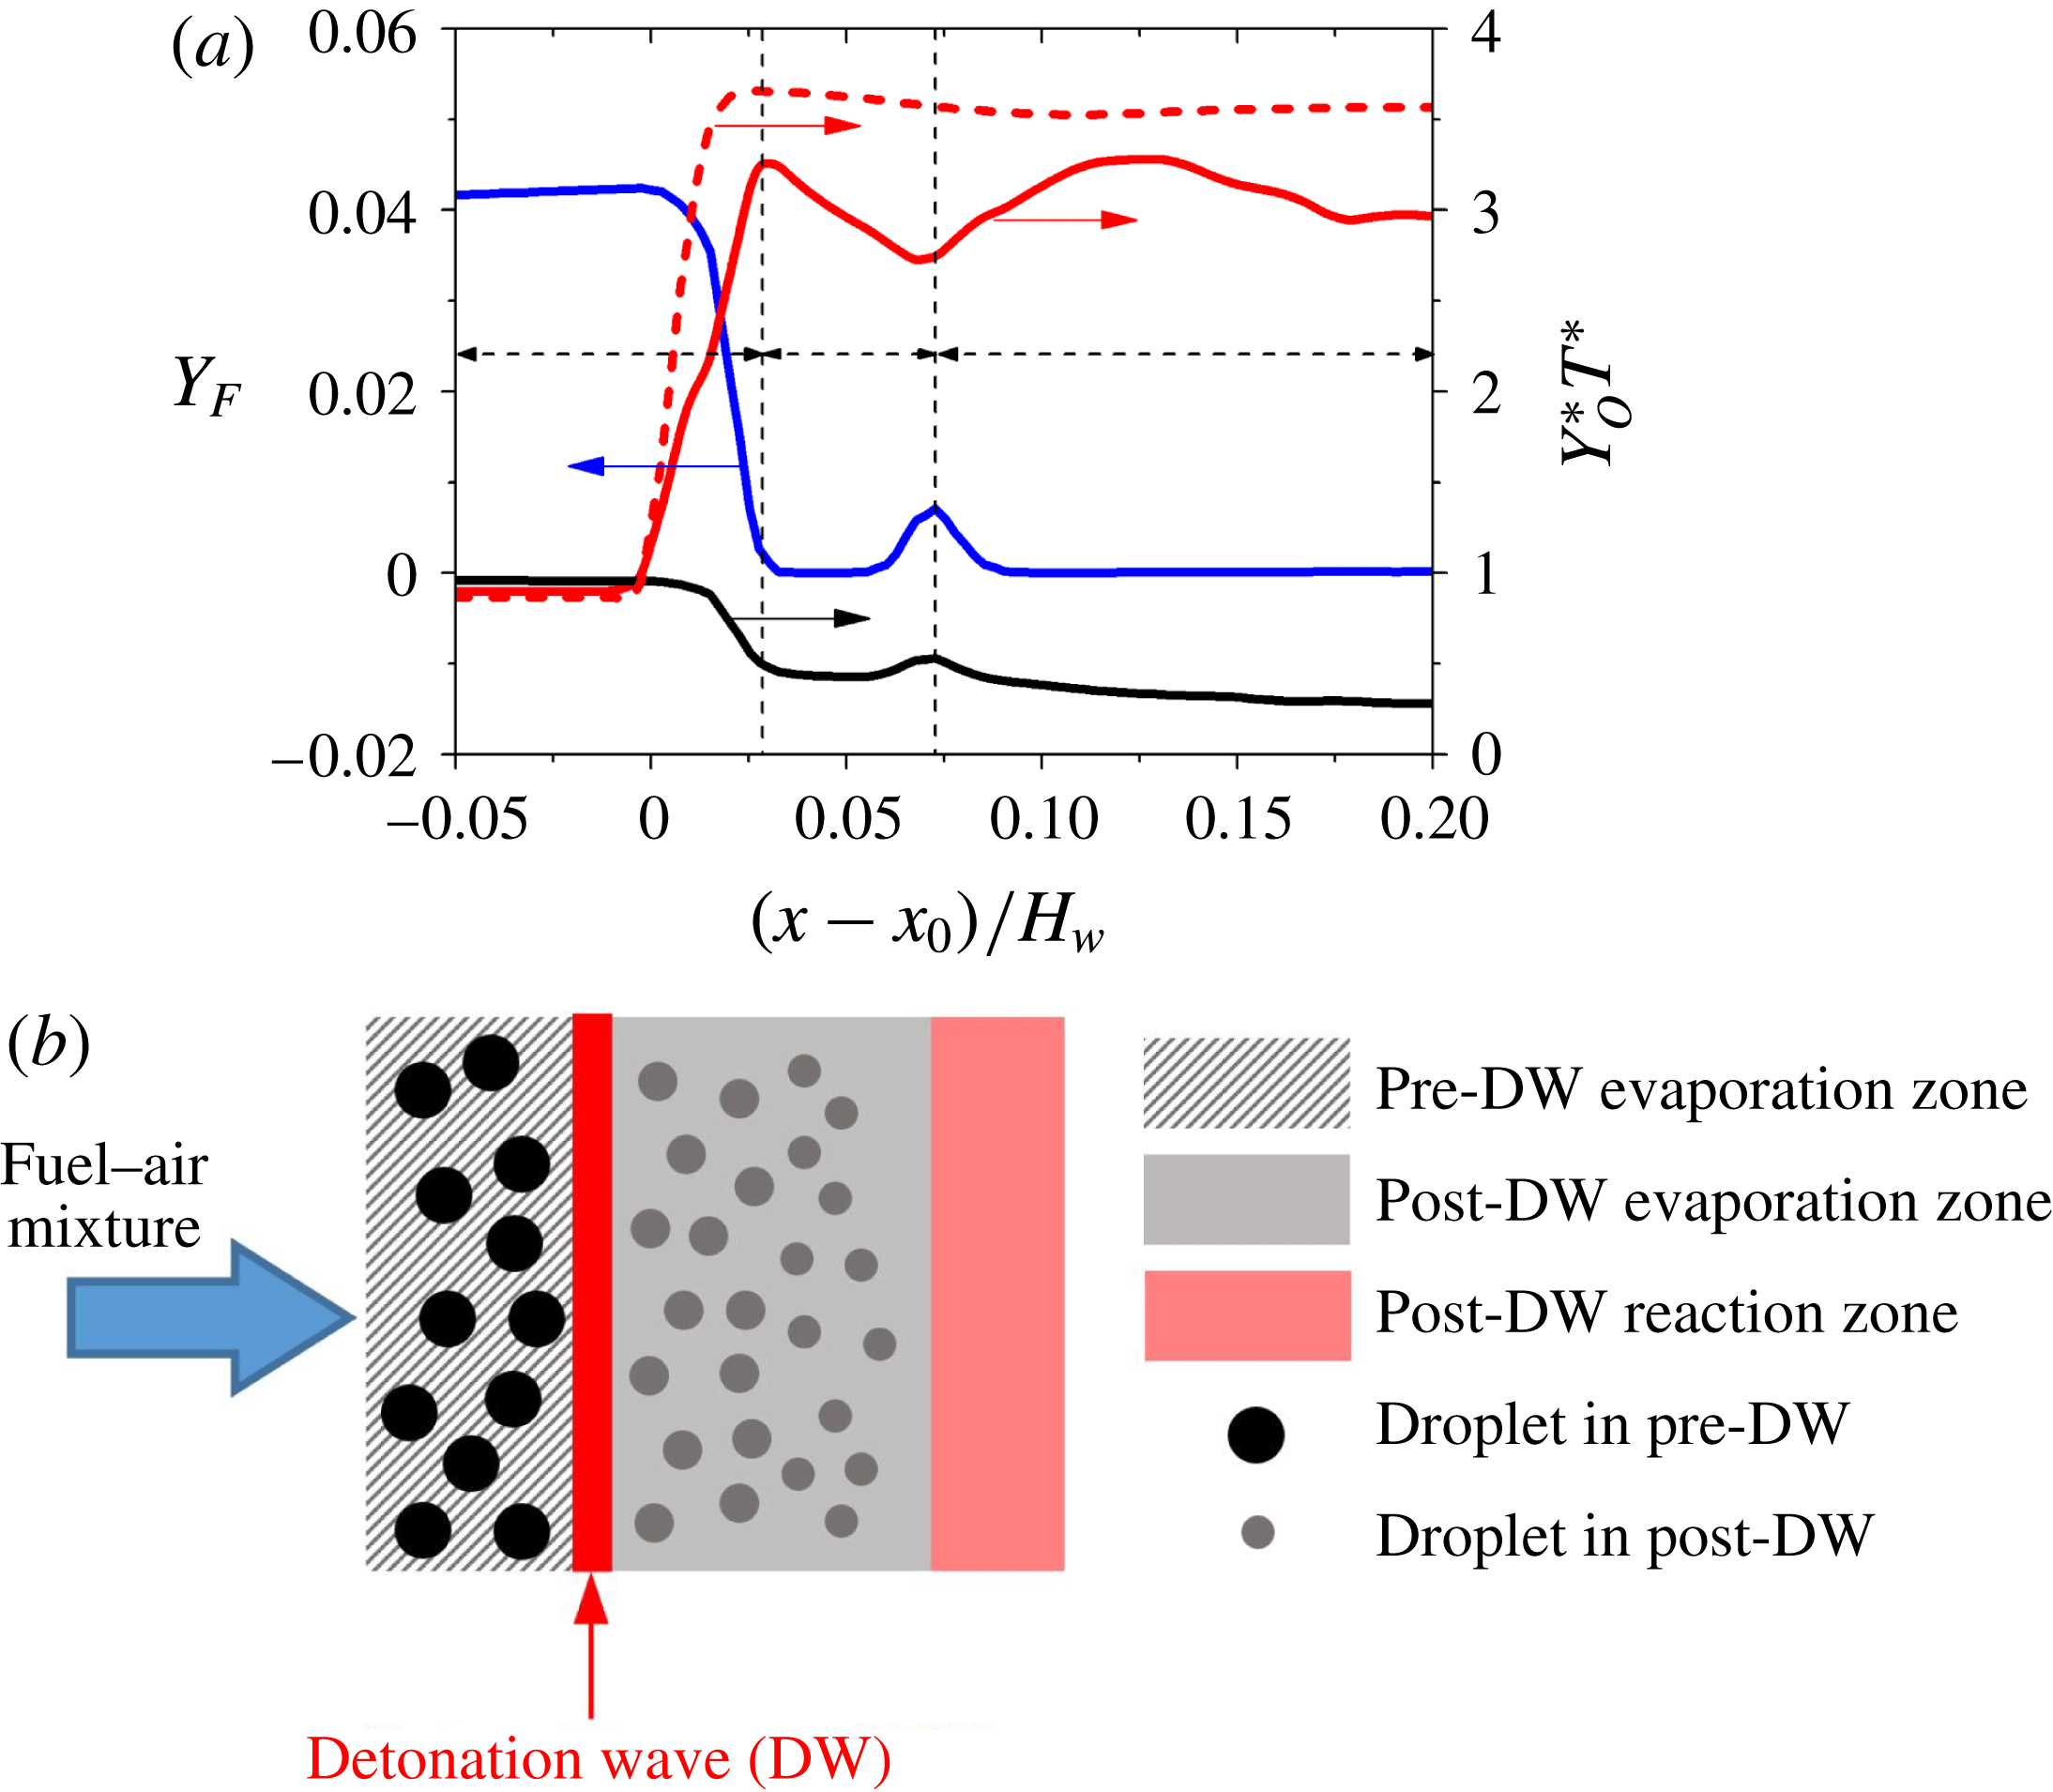
To study the influence of the evaporating droplets on the detonation wave structure, as well as the combustion characteristics, the streamwise profiles along
 $y=1.3H_{w}$
(across the ODW) are shown in figure 8(a). The temperature distribution of case D along the same line is used as a comparison. Here, the fuel mass fraction,
 $Y_{F}$
(blue lines), oxygen mass fraction,
 $Y_{O}^{\ast }$
(black lines), and gaseous temperature,
 $T^{\ast }$
(red lines), are plotted. The
 $T^{\ast }$
and
 $Y_{O}^{\ast }$
plots are normalised by
 $T^{\ast }=T/T_{0}$
and
 $Y_{O}^{\ast }=Y_{O_{2}}/Y_{O_{2},A}$
, respectively, and
 $Y_{O_{2},A}$
is the oxygen mass fraction of the air at the inlet. The combustion characteristics presented by the distributions of
 $Y_{F}$
,
 $Y_{O}^{\ast }$
and
 $T^{\ast }$
indicate that there are mainly three regimes for the interactions between ODW and droplets, namely, formation of OSW (regime I), evaporative cooling of droplets (regime II) and post-ODW reaction (regime III). Before the analysis of the flame structure, it should be noted that premixed combustion is found in the region where both
 $Y_{F}$
and
 $Y_{O}^{\ast }$
increase or decrease together as
 $x$
varies, and a non-premixed one appears in the region where either
 $Y_{F}$
or
 $Y_{O}^{\ast }$
increases while the other decreases as
 $x$
varies. At first,
 $Y_{F}$
increases slowly along the flow direction before the ODW front due to the low evaporation rate of the large droplets for case D-DL. As the fuel vapour from the evaporation mixes with the local oxygen to form reactive mixtures, the detonation occurs associated with a sudden increase of
 $T^{\ast }$
and a quick consumption of the reactive mixtures. Regime I is where the ODW is initiated. The droplets evaporate incompletely in regime I, and they disperse downstream into regime II. The droplets evaporate quickly when they traverse the ODW, as shown by the sudden decrease of the droplet size in figure 5(b). Judging from figure 8(a),
 $Y_{F}$
increases because the heat release from the triggered exothermic reaction in the post-ODW gas accelerates the droplet evaporation. However, the increase of
 $Y_{F}$
results in a decrease of
 $T^{\ast }$
. This is because
 $T^{\ast }$
is suppressed by thermal cooling from the evaporation. This phenomenon can be found in the previous studies of spray combustion (Kitano et al.
Reference Kitano, Kaneko, Kurose and Komori2016; Ren et al.
Reference Ren, Wang, Xie and Wang2017), in which the reaction rate could be suppressed by the high local concentration of evaporated fuel vapour, and the gaseous temperature is reduced by evaporative heat loss. It is also observed that the evaporating fuel droplet could affect the flame structure and a non-premixed combustion occurs as
 $Y_{F}$
increases while
 $T^{\ast }$
decreases. The results indicate that the evaporative cooling effects are dominant in regime II, where the chemical heat release is insufficient to accelerate locally the exothermic reaction, because it needs to counterbalance the heat loss from the droplet evaporation. The energy exchange between the droplets and gaseous phase leads to the decrease of flame temperature. When the fuel droplets evaporate completely and the cooling effects become weak, the chemical reactions in the post-ODW gas continually consume the reactive mixtures, corresponding to a premixed combustion again, and an increase in
 $T^{\ast }$
from the heat release occurs. This region is termed a post-ODW reaction regime (regime III), because the effects from the exothermic reaction are predominant. In addition, it is found that the streamwise profiles of
 $T^{\ast }$
fluctuate downstream, mainly because of the unsteady dynamics of ODW, associated with the pressure fluctuations of post-ODW gas (Teng et al.
Reference Teng, Jiang and Ng2014).
Effects of droplets on detonating for case D-DL. (a) Streamwise distributions of gaseous temperature (red lines), and the mass fractions of fuel vapour (blue lines) and oxygen (black lines) along
 $y=1.3H_{w}$
. Here, solid lines refer to case D-DL and dashed lines refer to case D;
 $x_{0}$
refers to the initiation location of detonation wave. (b) Schematic diagram.

Figure 8(b) qualitatively depicts the effects of larger droplets on detonation for case D-DL. Before the fuel droplets pass through the detonation wave (DW), the large droplets evaporate slowly due to the small specific surface area. Hence, the fuel–air mixture is lean in this pre-DW evaporation zone, and the gaseous temperature
 $T_{0d}$
affected by the evaporating droplets has a slight decrease from the weak cooling effects. Accordingly, the DW formed in the lean reactive mixture has a reduced pressure, compared with that of case D, as shown in figure 5(c). The large droplets cannot complete the evaporation before DW, and they traverse the DW. The increase in temperature in the post-DW zone accelerates the evaporation of droplets, but cooling effects lead to the decrease in gaseous temperature in the post-DW evaporation zone, as predicted in figure 8(a). As the droplets finish the evaporation, the formed reactive mixtures contribute to the post-DW reaction, which is the combustion mode of deflagration.
As described above, the dynamics of ODW change the dispersion behaviour of droplets due to the momentum exchange between the two phases, and further affect the spatial distributions of fuel vapour from droplet evaporation. In addition, the interactions between ODW and evaporating droplets can cause a change in the structure of the detonation, mainly due to the energy exchange between the two phases. When the fuel concentration increases to a high value, the suppression of chemical reactions from the evaporative cooling effects decreases the gaseous temperature. Therefore, it is valuable to comprehend the conditions where this occurs, and the two-phase detonation process contains a complex relationship between droplet dispersion, evaporation and chemical reaction.
5 Conclusions
A numerical investigation of the two-phase oblique detonations induced by a wedge was conducted. The gas–droplet reacting flow system was captured by means of a hybrid Eulerian–Lagrangian method, in which the motions of dispersed fuel droplets were tracked in the Lagrangian frame. The effects of droplets and initial droplet sizes on the initiation characteristics were studied. The computational results revealed the following.
The initiation of the oblique detonation waves in a stoichiometric vapour–air mixture is achieved through a transition from a smoothly curved shock. The change of fuel from vapour to evaporating droplet makes the transition change from smooth to abrupt for the same inflow condition. As more fuel droplets are injected, the transition pressure increases, and the initiation of detonation is delayed, associated with a longer characteristic initiation length.
As droplet size becomes larger, the droplets have a longer lifetime and can pass through the detonation fronts. The interactions between the evaporating droplets and chemical reactions affect the detonation structures, resulting in a non-premixed combustion zone. In addition, the transition pressures are reduced and become smooth.
The observations of this research lay a foundation that could indicate the future investigations needed to reach a rigorous theory of the initiation and self-sustainment of oblique detonation waves using liquid fuel.
Acknowledgements
This work is partially supported by NSFC under the grant no. 51676111 and NSFC-NAF under the grant no. U1730104.