The study of why some economies grow while others stagnate faces an important puzzle: despite widespread agreement that political institutions matter, there is little consensus on what kinds of institutions matter and how they matter. We have not reached this quandary due to a lack of effort. Many trees have been felled to publish the results of cross-country growth regressions with dozens of different variables, institutional and otherwise. Nearly all of this work, however, has something in common: the estimation of a linear model of economic growth that is assumed to be universal across countries and times. We have milked this approach for all that it is worth. We cannot determine what kinds of institutional forms are most critical for fostering growth in particular circumstances by estimating the average effects of institutional outputs across diverse contexts.
By starting with the premise that there are multiple growth paradigms, this article takes a fundamentally different approach. A paradigm is defined as a pattern or style of economic growth that is associated with a set of technological and social characteristics, and that is supported by particular institutional outputs.Footnote 1 Specifically, I argue that the effects of three types of institutional outputs—state authority, constraints on rulers and political participation rights—differ in the paradigms of investment- and innovation-based growth. Country characteristics determine the extent to which each growth paradigm is applicable, and growth outcomes vary according to whether a country's institutions are congruent with the relevant paradigms.
The empirical results from a mixture models estimation approach support the claim that there are multiple growth paradigms, and subsequent analysis using these estimates reveals that institutional outputs have different effects in these paradigms. For countries that are far behind the technological frontier, investment-based growth through capital accumulation is engendered by high levels of state authority and political rights. Additionally, in contrast to predictions from the New Institutional Economics (NIE) that constraints on rulers facilitate investment, I find instead that constraints impede productivity growth in an investment-based growth paradigm. Breaking with the assumption of a universal growth paradigm thus opens unexplored terrain and permits important, fresh insights.
The next section describes the general argument of this article more fully. I then develop general predictions based on this argument and explain how the mixture models estimation method offers a way to (1) identify the presence of different growth paradigms in the cross-national data and (2) estimate the context-dependent effects of political institutions on economic performance. The two subsequent sections present the findings and provide some concluding thoughts about the value of incorporating the context-dependent effects of political institutions on economic growth.
Growth Models And Context Dependence
The core argument of this article is built upon two claims drawn from the existing literature. First, economic growth is not a unitary process. Secondly, the effects of institutions depend on the context. Together, these arguments harken back to Gerschenkron's (Reference Gerschenkron1962) notion that the institutional factors that drive growth in “backward” countries are not the same as those that foster growth among more “advanced” countries. The resulting theoretical framework suggests a fundamentally different empirical approach to understanding the role of institutions in growth.
Countries differ in many ways that affect how institutions influence growth processes, but in the past we have treated these differences as statistical nuisances rather than as contextual factors. Typical empirical tests control for such factors in order to identify the effect of a particular institutional form or output on average across the sample. This average effect may be meaningful if there is a universal style of economic growth that applies to all countries equally, but it has little substantive meaning if there are multiple growth paradigms in which institutions matter differently. Nevertheless, very little work has been devoted to explicitly testing the context-dependent effects of broad institutional outputs. Rodrik, among others, criticizes the common assumption in the empirical literature that “there is a single set of institutions worth emulating” (2007, 162).
Studies have demonstrated the merits of breaking with the assumption of a single linear growth model with either sample-splitting methods (Durlauf and Johnson Reference Durlauf and Johnson1995; Tan Reference Tan2010) or Markov-switching estimation techniques (Bloom, Canning and Sevilla Reference Bloom, Canning and Sevilla2003; Jerzmanowski Reference Jerzmanowski2006) to identify groupings of observations that belong to the same growth regime (that is, paradigm). This work, however, leaves the role of institutions in growth largely unexplored. The approach in this article differs in three ways. First, its conception of institutions is richer than that employed in these studies.Footnote 2 Secondly, it estimates the effects of institutions within a particular context rather than using an institutional indicator to identify different subsamples. Thirdly, like Przeworski et al. (Reference Przeworski, Alvarez, Cheibub and Limongi2000) and Baum and Lake (Reference Baum and Lake2003), it recognizes that growth is generated by different factors—productivity growth, investment and human capital growth—each of which can be affected by different institutional forms in different ways.
Breaking with a Universal Growth Model
A growing body of work in economic growth theory argues that the growth process is not universal. As Pritchett (Reference Pritchett2003) contends, a single growth model cannot adequately represent the complexity of the phenomenon we observe as “growth.” In Pritchett's framework, the process of growth through industrial transformation differs from the process of steady growth at the technological frontier. Aghion and Howitt (Reference Aghion and Howitt2006) and Acemoglu, Aghion and Zilibotti (Reference Acemoglu, Aghion and Zilibotti2006) similarly describe separate paradigms of investment- and innovation-based growth. These approaches provide theoretical grounding for the expectation that the kinds of institutional outputs that support growth differ across contexts.
In an investment-based growth paradigm, growth is driven by “implementation innovations” and consists of sustained, high levels of capital investment and the local adoption of technologies developed elsewhere. This paradigm is most suitable when countries are far behind leading-edge countries on the technology ladder and when levels of human capital are low. For countries in these circumstances, establishing the foundation for economic development is a necessity. This foundation includes the maintenance of social order, the construction of infrastructure, and the provision of other basic public goods such as education and public health services. Implementation innovations are fostered by raising the level of elementary and secondary education and by creating a stable climate for investment (Aghion and Howitt Reference Aghion and Howitt2006).
For countries in this paradigm, private investment capital is typically scarce, market mechanisms to co-ordinate complementary investments are weak and the presence of established competitors in the world market makes industrialization a challenge. In these circumstances, investing in new technologies and learning new production methods is risky. States can thus promote productivity growth by subsidizing investment in new technologies, seeking to attract foreign investment and shielding firms from competition from more established competitors. The danger of state involvement is that anticompetitive policies create entrenched political constituencies and become hard to withdraw.
In an innovation-based growth paradigm, by contrast, growth consists of “leading-edge innovations” that develop new technologies and push the frontier outward (Aghion and Howitt Reference Aghion and Howitt2006). Since there is no economic roadmap, the kinds of policies that work well for investment-based growth are no longer effective. It is much more difficult for state planners to identify the key technologies of the future and pick which industries or firms will be economic “winners” and “losers.” Additionally, driving up rates of capital investment and sheltering firms from competition become increasingly inefficient as growth depends more on leading-edge innovation. Instead, growth is founded on high levels of human capital and inventive activity. Policies that promote a competitive domestic market, with easy entry and exit for firms, will more likely support higher rates of innovation and will more easily adjust to changes in the world economy.
Given the differences in these two forms of growth, the kinds of institutions that support growth are different as well. As Acemoglu, Aghion and Zilibotti argue, “institutions that are appropriate for early stages of development therefore become inappropriate for an economy close to the frontier” (2006, 64). Since institutional outputs contain inherent trade-offs for economic policy making, it is not surprising that context matters in this way.
Institutional Outputs and their Trade-offs
The institutional outputs examined in this article—state authority, constraints on rulers and political participation rights—capture conceptually distinct institutional properties. State authority refers to the degree to which a state maintains a monopoly of administrative/military control over a territory and has the ability to implement public policies. Constraints on rulers, by contrast, are institutional structures that impose checks on rulers and restrict their ability to change policy unilaterally by separating power across a number of rulers (Tsebelis Reference Tsebelis2002). Finally, political rights are defined as citizens’ ability to participate in politics, express policy preferences and choose their rulers. Full political rights thus assume political contestation.
These institutional outputs are usually studied in isolation. The empirical literature in the NIE, for example, focuses on constraints on rulers as the key institutional characteristic that fosters economic growth. The presence of multiple veto actors is theorized to reduce rulers’ ability to engage in opportunistic behavior and make arbitrary changes in policy (North and Weingast Reference North and Weingast1989). Political constraints are thus expected to increase investor certainty and protect property rights, and promote economic growth through greater private investment (Henisz Reference Henisz2000; Stasavage Reference Stasavage2002; Nooruddin Reference Nooruddin2011; Weymouth Reference Weymouth2011). Yet, separating powers across multiple actors produces a trade-off between “state indecisiveness and irresoluteness” (Cox and McCubbins Reference Cox and McCubbins2001). When economic reforms are necessary, policy stability can result in stagnation.
The role of the state is similarly contingent on the context. Several studies focus on the essential role of state capacity in creating conditions that facilitate economic growth (Chibber Reference Chibber2003; Fukuyama Reference Fukuyama2004; Kohli Reference Kohli2004; Bates Reference Bates2006). For these authors, the NIE's emphasis on constraining rulers seems inappropriate or misplaced. Instead, state weakness lies at the core of the most severe problems in the developing world, and building state capacity is an important priority. As Evans argues, strength at the center of the political-economic system is needed to provide the foundation for predictable policies that facilitate private investment, such as public investment in infrastructure and human capital, as well as enforcement of contracts (Reference Evans1992, 151). The record of states as agents of development, however, is mixed at best. States appear especially ill equipped to pick the “winners and losers” of the future for countries at the technological frontier of the world economy. The need for states to solve co-ordination failures and supply investment capital also declines as economies become more developed.
Likewise, the role of democratic political competition in creating the conditions for economic growth is ambiguous. In theory, political participation rights give citizens greater ability to hold rulers accountable for poor performance and induce rulers to provide higher levels of public goods (Lake and Baum Reference Lake and Baum2001). However, participation rights can create pressures for inefficient redistribution, prevent the adoption of policies that squeeze consumption in order to fund capital investment and provide avenues for vested interests to block policy changes. Unsurprisingly, then, reviews of the many studies of the relationship between democracy and growth produce no definitive conclusions (Przeworski and Limongi Reference Przeworski and Limongi1993; Almeida and Ferreira Reference Almeida and Ferreira2002). A meta-analysis by Doucouliagos and Ulubaşoğlu (Reference Doucouliagos and Ulubaşoğlu2008) confirms there is no direct relationship between democracy and growth, and finds that democracy may affect growth indirectly by increasing levels of human capital and providing a policy environment that is more conducive to growth.
In short, each of these institutional outputs presents trade-offs that make it difficult to believe that their effects on economic growth are consistent across countries in very different circumstances. To the extent that processes of economic growth differ for countries at different positions in the global economy, we should expect that the kinds of institutional outputs that are most conducive to growth also differ.
Predictions: Institutions In Investment- And Innovation-Based Growth
This analysis suggests that there should be two distinct growth paradigms in the cross-national data, and that the effects of political institutions differ in these paradigms. We should thus expect investment-based growth to be the dominant paradigm where the gap between a country and the world's leading economies is high, its inventive capacity is low and its level of human capital is low. We should find that the growth rate of capital stock per worker is considerably faster for countries engaged in investment-based growth than for those engaged in innovation-based growth. By contrast, growth will be driven to a greater extent by human capital and productivity improvements for countries in an innovation-based growth paradigm.
Investment-Based Growth
For the reasons outlined above, state capacity creates the foundation for investment-based growth by supporting public investment, expansion of access to education, development of transportation infrastructure and the maintenance of an attractive climate for foreign investment. The state can play an active role in economic planning, solve collective action problems, provide access to capital and nurture infant firms to increase industrial capacity. The gains from sheltering firms from competition, at least initially, outweigh the potential negative consequences of reducing innovative activity by new entrants.
Conversely, states that lack authority, such as the neo-patrimonial states described by Kohli (Reference Kohli2004), do not provide rulers with the capacity or legitimacy to pursue economic transformation policies or deliver public goods effectively. These states typically become a vehicle for particularistic interests to secure rents, and polices to foster investment-led growth fail due to misuse of resources and administrative bungling. The absence of a competent national bureaucracy makes the state an ineffective agent of development even when rulers pursue it. State authority, as Khan (Reference Khan2000b) notes, is required to manage subsidies efficiently, since bureaucrats need the power to withdraw subsidies in order to make them effective. Where states are weak, foreign investors shy away.
The effects of political rights in an investment-based growth paradigm are more nuanced, since they manifest themselves differently through the factors of capital stock and productivity growth. On the one hand, broad political rights may lead to slower growth of capital stock because they reduce the state's ability to mobilize capital by squeezing consumption or extracting resources from agriculture. Political pressure for redistribution may also reduce the capital available for private investment, shifting the composition of growth away from capital accumulation.
On the other hand, broad political rights can enhance the prospects of productivity growth in various ways. First, they may make rulers more accountable to citizens, leading to an increased provision of public goods such as education and public health (Baum and Lake Reference Baum and Lake2003). Secondly, as argued in Acemoglu and Robinson (Reference Acemoglu and Robinson2012), inclusive political institutions prevent the capture of the state by narrow economic interests that would use political power to enrich themselves to the detriment of the broader society. A similar argument appears in Khan (Reference Khan2000a), who contends that democratic institutions hold down rent-seeking costs by expanding the level of information about government policies and breaking the grip of entrenched interests, especially when states are weak. Overall, then, political rights are more likely to facilitate improvements in productivity rather than support the rapid growth of capital stock.
Political constraints on rulers in the form of the separation of powers, however, are not expected to enhance investment-based growth. Constraints are neither necessary to facilitate the growth of capital stock nor likely to produce policies that provide greater public goods and build human capital. The conventional logic from the NIE empirical literature is that constraints on rulers facilitate investment by protecting property rights. This logic, however, is oriented toward explaining the behavior of private investors and ignores the role of the state as an important agent for mobilization of capital for countries that are far behind the technological frontier. History provides several examples in which rapid capital mobilization has come when rulers of centralized states used their power for this purpose, as exemplified in the East Asian developmental states and, at the extreme, in the Soviet Union.
Innovation-Based Growth
The institutional mix that supports innovation-based growth is different. Basic state authority is unlikely to explain a country's degree of success at innovation-based growth. First, countries that reach this degree of economic development generally have states that are sufficiently capable of providing the foundation of a modern economy. We are unlikely to see relevant variation in state authority for countries at the frontier of the world economy, at least compared to the degree of variation in low-income countries. Secondly, the effectiveness of markets for providing capital, co-ordinating investments and selecting winners is much greater. States become less necessary as agents of economic development.
Economic performance is weaker, moreover, when the state's power is used to protect vested interests from the entry of new competition based on new methods and technologies. At the technological frontier of the economy, firms face threats from unanticipated, disruptive technologies and new competitors. They can either adjust to this new competition or seek protection from it. To the extent that vested interests are able to use political power to block the entry of these new competitors, productivity growth will falter. Acemoglu, Aghion and Zilibotti (Reference Acemoglu, Aghion and Zilibotti2006) argue that political institutions, such as the separation of powers, that impede the ability of vested interests to use the policy making process to block competition will be advantageous. Crucially, the central effect of political constraints is thus to support growth in productivity rather than capital stock, in contrast with the predictions of the NIE.
Finally, at the frontier of the world economy, the positive effect of political rights on public goods provision may be less potent, since scarcity of public goods is not a key constraint on growth for most countries in these circumstances. It is plausible to expect, however, that politicians will still tend to shy away from policies that require economic sacrifices from the population. Promises that sacrifices will produce future gains may not be credible, and it may be easier to mobilize opposition than support when the sacrifices are well specified but the benefits are diffuse. For example, it may be difficult to enact polices that would reform labor market policies in order to facilitate more flexibility in hiring at the expense of job security. On balance, then, the kinds of vigorous political competition associated with high levels of political rights may slow the rate of innovation-based growth.
Summary
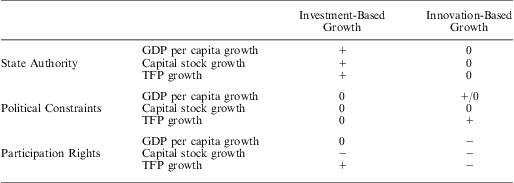
Overall, the institutional outputs that matter for economic growth depend on the style of growth that is most suitable (see Table 1). Catch-up growth, driven by capital accumulation and public goods provision, is more strongly linked to basic state authority and political rights than to political constraints on rulers. State authority provides the basic foundation for investment-based growth, while constraints on rulers have little effect. Greater political rights, however, curtail the potential for rapid capital stock growth by preventing the suppression of consumption, but they facilitate growth in total factor productivity by increasing the provision of public goods.
Predicted Effects of Institutional Outputs
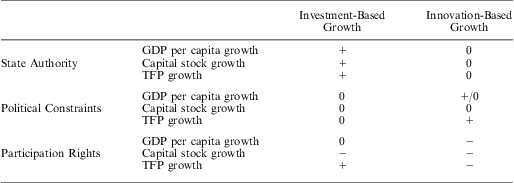
Conversely, innovation-based growth, driven by technological innovation and productivity enhancements, functions most effectively when political leaders are constrained from interfering in the allocation of investment capital and firm survival. Rapid and unanticipated technological changes render state planning difficult, and multiple veto gates make it difficult for vested interests to use the political system to shield themselves from unforeseen competitors. Political constraints thus support productivity growth in an innovation-based growth paradigm, while the level of state authority is not a key determinant of the rate of growth. Finally, the political pressures that arise from competitive political participation may hinder economic reforms that require short-term sacrifices.
Description of The Empirical Approach
The empirical approach taken in this study consists of two steps. The first step uses a finite mixture model (Titterington, Smith and Makov Reference Titterington, Smith and Makov1985; McLachlan and Peel Reference McLachlan and Peel2000) to identify the theorized growth paradigms; the second step employs these results in a more familiar growth regression analysis. Mixture models are increasingly used as estimation tools in situations when the population contains latent clusters and there are some unobserved factors that produce these clusters. Other (known) factors can help identify the clusters probabilistically.
In this case, the accumulation of growth factors—such as total factor productivity (TFP), capital stock and human capital—occurs heterogeneously in the population of country-years due to the presence of different growth paradigms. The discussion above argues that there are two such paradigms and creates a theoretical expectation for what kinds of clusters may be present in the observed data. Within each paradigm, growth in GDP per capita is assumed to be distributed normally, and is described by linear models in which the key components of growth matter differently. The method simultaneously estimates the coefficients on these explanatory variables for each paradigm while using country characteristics to estimate the extent to which each observation is described by the model for each paradigm.
A Mixture of Normal Models
In linear regression, the dependent variable y is a random draw from a single population, conditional upon the linear predictor xβ and a disturbance with variance σ 2. The conditional value of y is thus normally distributed.
 $$\phi \left( {y|x,\beta, {{\sigma }^2} } \right)\, = \,\frac{{\rm{1}}}{{\sigma \sqrt {{\rm{2}}\pi } }}{\rm{exp}}\left( {{\rm{ - }}\frac{{{{{(y\,{\rm{ - }}\,x\beta )}}^{\rm{2}}} }}{{2{{\sigma }^{\rm{2}}} }}} \right)$$
In using mixture models, we assume instead that the population contains S components in which the data generation process for y differs. In the context of this article, a component is a growth paradigm. The proportion of the population that belongs to component  $$$s \in S$$$
is referred to as ps, where
 $$$\mathop{\sum}\sidelimits_{s\, = \,{\rm{1}}}^S {{p}_s}\, = \,{\rm{1}}$$$
and
 $$${{p}_s}\geq {\rm{0}},\,\forall s$$$
. We do not know with certainty from which component a particular observation was generated, but we can estimate these origins probabilistically using a vector of observed characteristics z and associated parameters λs. The weighting function
 $$${{p}_s}(z,{{\lambda }_s})$$$
takes the form of a multinomial logit.
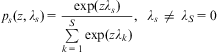 $${{p}_s}(z,{{\lambda }_s})\, = \,\frac{{{\rm{exp}}(z{{\lambda }_s})}}{{\mathop{\sum}\limits_{k\, = \,{\rm{1}}}^S {\rm{exp}}(z{{\lambda }_k})}},\; \; {{\lambda }_s}\, \ne \,{{\lambda }_S}\, = \,{\rm{0}}$$
In this weighting function, the parameter vector for paradigm S, labeled as λS, is constrained to equal zero for purposes of identification. The observed y's are thus a mixture of draws from S multivariate normal densities.
 $$h(y|x,z,\theta )\, = \,\mathop{\sum}\limits_{s\, = \,{\rm{1}}}^S {{p}_s}(z,{{\lambda }_s}){{\phi }_s}(y|x,{{\beta }_s},\sigma _{s}^{{\rm{2}}} )$$
In Equation 3, θ is the vector of all parameters:  $$$\theta \, = \,{{({{\lambda }_1}, \ldots, {{\lambda }_S},{{\beta }_{\rm{1}}}, \ldots, {{\beta }_S},\sigma _{{\rm{1}}}^{{\rm{2}}}, \ldots, \sigma _{S}^{{\rm{2}}} )}^'} $$$
. For the linear predictor in each paradigm, there is a set of coefficients (βs), making S sets in all. Leaving aside the constrained λS, there are S−1 sets of coefficients (λs) for the weighting function. The parameters are estimated through maximum likelihood using the Finite Mixture Models (FMM) package for Stata by Deb (Reference Deb2007). The estimation procedure iterates between estimating the probabilities with which each observation belongs to each component s and maximizing the log-likelihood for each component using these probabilities as weights.
In this presentation, y represents growth in GDP per capita, and there are two components (that is, S = 2) to represent the two growth paradigms. The explanatory variables, x, are growth in capital stock per worker ( $$$\dot{k}$$$
), growth in human capital per worker (
 $$$\dot{h}$$$
), and geographical and social factors that may affect the growth rate.Footnote 3 The variables describing country characteristics that determine the extent to which each component is appropriate are identified as z. These contextual variables provide an estimate of how likely it is that a particular observation comes from each paradigm.
The mixture models approach provides two important sets of findings. First, the coefficients (βs) on the explanatory variables for each component provide a description of the respective growth paradigms. To the extent that the factors that comprise economic growth (such as growth of capital stock per worker) differ across these paradigms in the expected manner, we should be more confident that this approach permits a fuller understanding of the growth process. Secondly, the estimated weights (ps) on each component identify the probability with which a country is identified with each growth paradigm during each year.
Time-Series-Cross-Sectional Estimation
In the second phase of the analysis, the estimated weights from the mixture models estimation become an independent variable in a more traditional linear regression analysis for time-series-cross-sectional data. Specifically, this weight variable (referred to as Comp1) is interacted with indicators of the three main institutional characteristics of interest.Footnote 4 To the extent that these interactions are statistically significant, the evidence will support the conclusion that the effects of institutions depend upon the degree to which Component 1, rather than Component 2, is the appropriate growth paradigm during that year. A second critical issue is whether these estimated institutional effects are consistent with the theoretical expectations regarding the roles of these factors in investment- and innovation-based growth.
Two sets of regression techniques are employed. The first is a random effects regression model with panel-corrected AR(1) standard errors. Since the institutional variables are either invariant or slow moving, fixed effects analysis is not appropriate. We should expect, moreover, that cross-sectional variation in institutions is more important than within-country variation for explaining economic performance. To account for unobserved fixed differences across countries, however, the second method employs the Fixed-Effects Vector Decomposition (FEVD) procedure described in Plümper and Troeger (Reference Plümper and Troeger2007) as updated to version 4.0. This procedure decomposes fixed effects into portions explained and unexplained by the invariant independent variables in the analysis. Due to space limitations, these results are reported in the online appendix.
Data
Data were obtained from a variety of sources to construct a dataset covering the period 1965–2008 with annual observations on up to 83 countries each year. The variables are discussed in three categories: economic variables, institutional variables, and country characteristics.
Economic Variables
To decompose growth in GDP per capita into its main factors, this article follows procedures similar to those outlined in Bosworth and Collins (Reference Bosworth and Collins2003) and Caselli (Reference Caselli2005). Starting with a Cobb-Douglas function, the growth rate of output per worker is separated into the TFP growth rate ( $$$\dot{A}$$$
), the growth rate of capital stock per worker (
 $$$\dot{k}$$$
) and the growth rate of human capital per worker (
 $$$\dot{h}$$$
). TFP growth is a residual factor that is not measured directly. Algebraically, it is the portion of growth in output per worker that remains after accounting for
 $$$\dot{k}$$$
and
 $$$\dot{h}$$$
.
Data on the level of capital stock per worker come from Bosworth and Collins (Reference Bosworth and Collins2003), extended to 2008 by the author. The level of human capital, ht, is based on the estimated earning power per worker resulting from the average number of years of education across all workers. For data on the average number of years of education per worker (YearsEduc), I use the most recent data from Barro and Lee (Reference Barro and Lee2010) and fill in missing cases from Cohen and Soto (Reference Cohen and Soto2007). I use these figures and apply the piecewise linear Mincerian formula that appears in Caselli (Reference Caselli2005).Footnote 5 Each of these annual growth rates is expressed in percentage terms.
Institutional Variables
An ideal measure of state authority would capture, over time, a state's control over its territory and its capacity to devise and implement public policies. No such measure exists for a broad sample of countries. Most attempts to measure state capacity are proxies of the “rule of law” or “bureaucratic quality” based on observed policy outcomes or investors’ perceptions as determined by risk analysis services. As Rodrik (Reference Rodrik2007) argues, these perceptions are strongly affected by observed economic performance rather than simply the outputs of institutions themselves. Another commonly used measure is the level of revenue collection, which is a proxy for the state's extractive capacity, one component of state authority. Yet tax revenues are also strongly affected by policy preferences and country wealth.
With these shortcomings in mind, this article adopts the measure of state antiquity (StateHist), developed by Bockstette, Chanda and Putterman (Reference Bockstette, Chanda and Putterman2002) and updated in 2005, as the proxy of state authority. StateHist is a 0-1 index that increases in the following factors: the number of years a government existed above the tribal level during the years 1 to 1950 CE, the number of years this government was locally based rather than foreign based and the percentage of territory of the modern country, based upon its borders in 1950, that was ruled by this government over the period. The assumption is that states become more institutionalized, and thus more authoritative, the longer they are in existence and maintain sovereignty.Footnote 6
StateHist has three important features. First, it is exogenous to the period of time covered in this study, which is not the case with many variables that measure institutional quality. Secondly, StateHist is not based on subjective assessments of institutional quality, which mitigates the potential that observed economic performance will bias the measure. Thirdly, StateHist incorporates both pre- and post-colonial history more fully than the settler mortality measure developed in Acemoglu, Johnson and Robinson (Reference Acemoglu, Johnson and Robinson2001) and has much broader country coverage.Footnote 7StateHist ranges from 0.028 for Kenya to 0.963 for EthiopiaFootnote 8 (median = 0.47, SD = 0.26). A one-standard-deviation change in the index thus roughly corresponds to the difference between Botswana (0.30) and Ireland (0.57) or Guyana (0.16) and Mexico (0.42).
The measure of political constraints (Checks) comes from the 2010 version of the Database of Political Institutions (Beck et al. Reference Beck, Clarke, Groff, Keefer and Walsh2001; Keefer and Stasavage Reference Keefer and Stasavage2003).Footnote 9Checks counts the number of veto actors in a polity. The variable is incremented by one for an independently elected chief executive, for each chamber of the legislature,Footnote 10 if an opposition party controls the legislature, for each party in the governing coalition needed to maintain a parliamentary majority, and for each party allied with the president/government that is closer to the opposition on a right-left ideological spectrum. As coded originally, Checks runs from 1 to 18. Since it is unlikely that the effect of Checks is linear across this range, its logged value is used in this analysis. On the log scale, Checks ranges from 0 to 2.89 (median = 1.1, SD = 0.64). An increase of one standard deviation in Checks thus roughly corresponds to the difference in 2000 between Egypt (0.69) and Costa Rica (1.39).
The concept of political rights is represented by the index of the competitiveness of political participation (ParComp) from the 2010 version of the Polity IV dataset created by Marshall and Jaggers (Reference Marshall and Jaggers2009). This variable ranges from 0–5, with higher values indicating the greater extent to which “alternative preferences for policy and leadership can be pursued in the political arena.”Footnote 11 The mean value of ParComp is 3.4, and its standard deviation is 1.4.
Country Characteristics
Four variables are used as predictors in the weighting equations of the mixture models estimation. The first, Patents, is derived from data on the number of patents filed in the United States by country of origin for each year since 1965 from the United States Patent and Trademark Office. Specifically, Patents is the log of the number of patents filed per million people.Footnote 12 Countries with higher levels of patent applications are expected to be more technologically advanced. Secondly, the variable YearsEduc measures the average years of education in the working-age population. The third variable is Gap, which is a proxy for technological distance based on the level of a country's real GDP per worker (rgdpwok) from the Penn World Table (Heston, Summers and Aten Reference Heston, Summers and Aten2009). Gap is the natural log of the ratio of GDP per worker in the United States to that of the country in question. Finally, to account for the possibility that the effect of Gap changes as the technology frontier moves outward, the model includes the interaction of Gap with the variable Year, which serves as a general indicator of the level of technology.
In the linear regression analysis, three country characteristics are included as control variables. For the level of ethnic fractionalization (EthnicFrac), I use the measure from Alesina et al. (Reference Alesina, Devleeschauwer, Easterly, Kurlat and Wacziarg2003). The advantage of this index is that it assumes group identities might be based either on racial or linguistic characteristics, depending on the country in question. The last two variables are TropicArea, the proportion of a country's land area that lies in the tropics, and Landlocked, a 0-1 indicator that equals 1 if a country has no seaports (Gallup, Mellinger and Sachs Reference Gallup, Mellinger and Sachs2001). These variables provide indicators of geographical conditions that might affect the attractiveness of a country for investment.
Findings
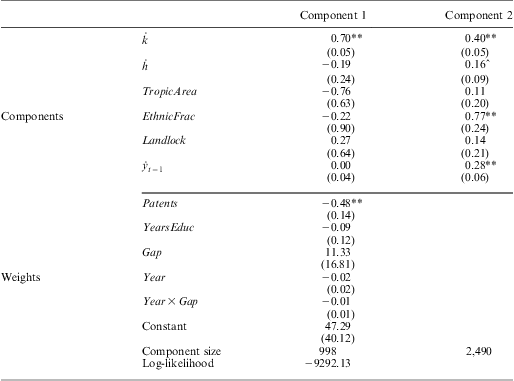
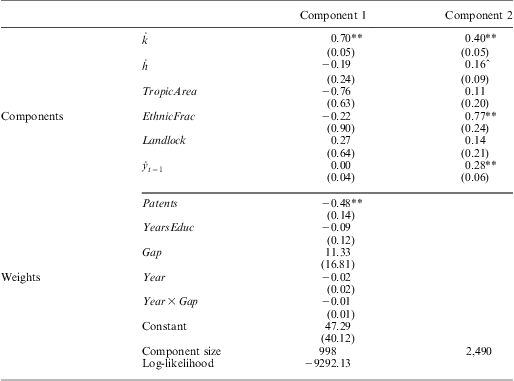
The mixture models technique demonstrates that there are indeed two distinct paradigms present in the cross-national data. The coefficients on the key explanatory variables for each paradigm are presented in Table 2, where they are labeled Components 1 and 2, respectively. In comparing the two sets of coefficients, it is evident that the effect of growth in capital stock per worker on overall growth in GDP per capita is much stronger in Component 1 (coefficient 0.7) than Component 2 (coefficient 0.4). These coefficients are different from each other with over 99 percent confidence. Conversely, growth in human capital has a positive effect in Component 2 but not in Component 1, though these estimates do not differ from each other with high statistical confidence (p < 0.91). Overall, then, the chief difference between these two paradigms in terms of core growth factors is the degree to which growth in capital stock is central.
Identification of Growth Paradigms
^p < 0.10, **p < 0.01.
Note: mixture of normal models estimated via maximum likelihood using the EM algorithm. Standard errors in parentheses.
The components differ in two other important ways. First, ethnic fractionalization is associated with a strong and positive effect on the growth rate of GDP per capita in Component 2 but not in Component 1.Footnote 13 Where EthnicFrac is one standard deviation higher (0.26), the annual per capita growth rate is 0.2 percentage points faster, on average. In Component 1, by contrast, the effect of EthnicFrac cannot be distinguished from 0. Secondly, the positive and significant coefficient on the lagged value of the dependent variable  $$$({{\dot{y}}_{t\,{\rm{ - }}\,{\rm{1}}}})$$$
in Component 2 suggests that this growth paradigm enjoys a steadier rate of growth. Unlike in Component 1, last year's growth rate helps explain this year's growth rate.
To better understand whether these paradigms match the descriptions of investment- and innovation-based growth, we can examine the coefficients on the weighting variables to determine which types of countries are best described by each paradigm. Of these variables, Patents is the strongest determinant. The coefficient on Patents of −0.48 indicates that the higher the level of patent filings in the United States, the more likely it is that a country's growth data are generated by Component 2. If one assumes that all other variables in the weighting equations are held constant at their median values, raising the level of Patents by one standard deviation (from 0 to 1.58) increases the probability weight on Component 2 from 0.45 to 0.64. When Patents reaches its highest value of 6.55, the weight on Component 1 rises to 0.95. This finding is consistent with a scenario in which Component 2 represents a paradigm for countries that grow through innovation.
Component 2 is also associated with countries that have higher levels of education, but the degree of statistical confidence in this estimate is low. Where YearsEduc is one standard deviation below the median and all other variables are set to their median values, the probability weight on Component 1 is 0.73. This weight decreases to 0.42 when YearsEduc is increased to one standard deviation above the median. Finally, the effect of Gap turns out to be negligible once the interaction with Year is taken into consideration.
The countries with a strong weight on Component 1 (Comp1 > 0.5) are almost exclusively low- and middle-income countries that are less industrialized. Among these countries, the mean percentage of GDP coming from agriculture is 28 percent and the mean percentage of the population that lives in rural areas is 67 percent. Geographically, they are concentrated in Africa, South Asia and South America.Footnote 14 By contrast, for countries with a strong weight on Comp2, the mean percentage of GDP coming from agriculture is 12 percent and the mean percentage of the population living in rural areas is 41 percent.
Countries with a very strong weight on Component 2 (Comp2 > 0.8) consist almost exclusively of Organisation for Economic Co-operation and Development (OECD) countries for most of the 1965–2008 time period. They are highly industrialized, with agriculture contributing only 4.5 percent of GDP on average and with 25 percent of the population living in rural areas. Some non-OECD countries, such as Argentina, Costa Rica, Malaysia, South Africa and Thailand, join this group in the late 1990s and early 2000s due to relatively high levels of education and patenting activity. On the whole, however, the countries in this group appear to represent the paradigm of innovation-based growth quite well.
Another way to illustrate the predictions of the weighting equation is to look at the evolution of the estimated weights over time in particular countries. Figure 1a presents these values for the United States, for which the weight on Component 2 never falls below 0.936 throughout the time period covered by this sample. In the corresponding figure for South Korea (Figure 1b), however, the picture is one of economic transformation in which the country moves rapidly away from Component 1 during the 1980s. This change reflects South Korea's shift to an innovation-based growth paradigm at the technological frontier of the world economy. The level of Patents climbed from 0 in 1965 to 4.81 in 2000, putting the country in the 90th percentile in terms of (logged) patents filed per million people.
Component weights for example countries

For Brazil, by contrast, the story is one of a more gradual transformation to a situation in which Component 2 gets a relatively high weight of 0.8 (Figure 1c). This change is driven by both rising levels of patenting, for which Brazil crosses the 75th percentile in 2006, and increasing levels of education. The mean number of years of education grew from 3.0 in 1960 to 7.6 in 2008. In Nigeria, the transformation is slower still. Component 1 receives greater weight than Component 2 until 1988, and the weight on Component 2 reached only 0.68 by 2008 (Figure 1d). In Nigeria's case, the change is driven principally by rising levels of education, which increased from an average of 1.2 years in 1965 to 4.0 years by 2008.
Overall, the two components identified in the mixture models estimation resemble the paradigms of investment- and innovation-based growth described above. Component 1, where growth in capital stock is the primary engine of GDP growth, applies most strongly to the least-industrialized countries in the developing world. They do not grow steadily, as evidenced by the coefficient of 0 on the previous year's growth rate. Component 2 contains a more diverse set of countries, but the countries that consistently get the strongest weight on this component indeed represent those that we would expect to be engaged in innovation-based growth.
Regression Results
The second stage of the empirical analysis builds upon the mixture models estimation to test whether the effects of the institutional outputs that matter for growth differ across the growth paradigms as predicted. The weights for each country-year indicate the extent to which the institutional effects should flow in particular directions. The greater the weight on Component 1, for example, the stronger is the expected positive role of state authority in supporting growth in GDP per capita in general and capital stock per worker in particular. Conversely, constraints on rulers should have a more positive effect on TFP growth when the weight on Component 1 is low. The weights, in other words, lend themselves to be used in interaction terms.
This approach brings an important advancement over traditional growth regressions in which the dependent variable is the growth rate of GDP per capita. Since growth is driven by different mixes of capital stock and TFP growth for countries in different growth paradigms, the component weights serve as a way to identify heterogeneity inside the sample that is otherwise ignored. To the extent that institutional outputs act differently on these growth factors, and to the extent that these factors accumulate differently for countries engaged in different styles of growth, traditional growth regressions miss the nuances of the relationships between institutions and growth.
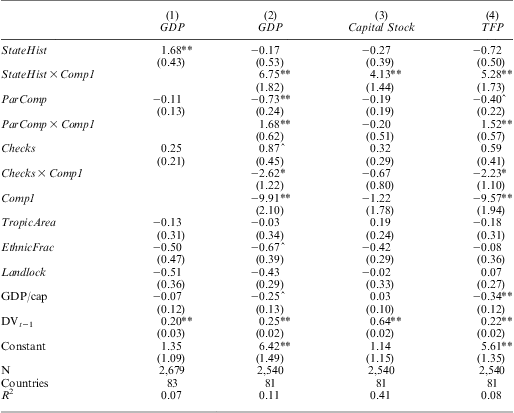
The first set of regression models is displayed in Table 3. The tests assume that differences across country units are random after accounting for the set of regressors, which contains slow-moving and invariant measures of a country's institutional, geographic and social characteristics. Panel-corrected AR(1) standard errors are employed due to heterogeneity across countries and serial correlation of the errors. In the first two models, the dependent variable is growth in GDP per worker. The latter two models focus on the specific growth factors of growth in capital stock per worker and TFP.
Growth Regressions with Growth Paradigms
^p < 0.10, *p < 0.05, **p < 0.01.
Note: random effects regression models with panel-corrected AR(1) standard errors in parentheses. DVt −1 is the one-period lag of the dependent variable in each model.
Model 1, which does not include the weight on Component 1, serves as a baseline for comparison. The coefficients on the three institutional variables represent their ‘average’ effects on growth in GDP per worker. Of the three, only StateHist is found to have an effect that is statistically different from 0 with high confidence. According to the estimated coefficient of 1.68, a one-standard-deviation increase in StateHist (0.26), roughly the change from Angola to Ireland, is associated with an annual growth rate in GDP per capita that is a bit under one-half of a percentage point faster, on average. Neither ParComp nor Checks is found to have a statistically discernible effect on overall growth in GDP per capita.
Adding to the analysis Comp1, the variable that indicates the extent to which an investment-based growth paradigm is applicable, brings considerable changes to the estimates. The effect of StateHist is indistinguishable from 0 for countries that are the most strongly associated with innovation-based growth (that is, Comp1 is near 0). When the weight on Comp1 is strong (0.65), however, StateHist is linked to much faster growth in GDP per capita. In this scenario, the predicted effect of a one-standard-deviation increase in StateHist is that the growth rate of GDP per capita will be 1.2 percentage points faster. Figure 2 displays this marginal effect and the associated 95 percent confidence interval
Marginal effect of StateHist on growth in GDP Per Capita
Note: predicted marginal effect of StateHist on growth in GDP Per Capita, with 95 percent confidence interval, across range of Comp1. Constructed using the estimates from Table 3, Model 2.
.
The effects of the two remaining institutional variables also are influenced by the weight on Comp1. ParComp is estimated to have a substantively large, positive effect on growth in GDP per capita for countries that are strongly associated with an investment-based growth paradigm, but the effect is negative for countries that are strongly associated with innovation-based growth. For Checks, however, the predicted effects lie in the opposite direction. Constraints on rulers are associated with slower growth rates for countries in the investment-based growth paradigm.
Figure 3 depicts the marginal effect of ParComp as a function of the weight on Component 1. When that weight is close to 0, an increase in ParComp by one unit (which is equivalent to the difference between South Korea and Sweden in 2000) is predicted to decrease the growth rate of GDP per worker by about three-quarters of one percentage point. Where the weight on Component 1 is high, however, the same-sized increase in ParComp is expected to produce an increase in the growth rate of about one-half of a percentage point. Both of these predictions are significant at the 95 percent confidence level.
Marginal effect of ParComp on growth in GDP Per Capita
Note: predicted effect of one-unit increase in ParComp on growth in GDP Per Capita, with 95 percent confidence interval, across range of Comp1. Constructed using the estimates from Table 3, Model 2.
Constraints on rulers, as measured by Checks, appear to have a negative effect on the overall growth rate for countries most strongly associated with an investment-based growth paradigm. Where the weight on Component 1 reaches the top of its range, increasing the level of Checks by one standard deviation (0.64) is expected to reduce the overall growth rate by about two-thirds of a percentage point. This prediction is significant at the 0.1 level.Footnote 15
Models 3 and 4 on Table 3 focus on the growth factors of capital stock per worker and TFP. Using these factors as dependent variables facilitates the investigation of the pathways through which institutions matter for growth. The overall picture is very clear. State authority, as measured by StateHist, is associated with growth in both factors for countries in an investment-based growth paradigm. Where the weight on Component 1 is small, by contrast, StateHist is found to have no systematic effect. Sustained growth starts with a capable state.
The effects of constraints on rulers are quite different from most accounts in the NIE theoretical literature,Footnote 16 but they are consistent with the argument above that the state is often an important agent of capital mobilization for investment-based growth. First, as can be seen in Model 3, Checks does not have a robust effect on the growth rate of capital stock per worker. Countries with higher levels of Checks do not achieve faster growth of capital stock overall. Even if constraints on rulers facilitate private investment by protecting the property rights of investors, they may have the opposite effect on the state's ability to provide capital. State mobilization of capital typically involves the extraction of revenue from agriculture or labor, and logic suggests that it becomes more difficult to implement policies of this kind when there are more veto actors in the polity.Footnote 17
Instead, to the extent that constraints matter, they do so through the pathway of productivity growth. As can be seen in Model 4, the effect of Checks on TFP growth is negative for countries strongly associated with the investment-based growth paradigm (see also Figure 4). On the one hand, constraints on rulers are linked to greater policy stability. While stability may be beneficial when status quo policies are desirable, the process of economic transformation through industrialization typically brings significant social changes that require flexible policy responses. Greater barriers to policy change can impede the industrial transformation. The findings, however, did not provide statistically significant evidence to support the expectation that constraints have a positive effect on productivity growth in an innovation-based growth paradigm.
Marginal effect of Checks on growth in Productivity
Note: predicted effect of one-unit increase in Checks on TFP growth rate, with 95 percent confidence interval, across range of Comp1. Constructed using the estimates from Table 3, Model 4.
Notably, competitiveness of political participation has quite different effects on growth in capital stock per worker and productivity. In general, higher levels of ParComp are associated with slower growth of capital stock per worker (Model 3). Although the individual coefficients on ParComp and its interaction with Comp1 are not different from 0 with high confidence, their combined effect is statistically significant for most of the range of Comp1 (see Figure 5). Where ParComp is one standard deviation (1.4) higher, the annual rate of growth of capital stock per worker is about one-quarter to one-half percentage point slower. This finding is consistent with the idea that greater political participation can slow the accumulation of capital stock either through greater taxation of capital to fund public spending or by making it more difficult for the state to extract resources to fund capital investment.
Marginal effect of ParComp on growth in Capital Stock Per Worker
Note: predicted effect of one-unit increase in ParComp on growth rate of Capital Stock Per Worker, with 95 percent confidence interval, across range of Comp1. Constructed using the estimates from Table 3, Model 3.
When it comes to TFP growth, however, the effects of ParComp strongly depend on the growth paradigm in question. For countries in an investment-based growth paradigm (that is, the weight on Component 1 is at its maximum), higher levels of ParComp are associated with faster productivity growth. Raising ParComp by one unit would raise the annual TFP growth rate by about 0.8 percentage points. The opposite is true for countries engaged in innovation-based growth. Where the weight on Comp1 is near 0, a one-unit increase in ParComp is associated with a decline in productivity growth of about 0.5 percentage points.
This finding is consistent with the argument developed above. Namely, political pressures on rulers that arise from mass participation are a double-edged sword: they encourage rulers to do things like provide public goods, but they also make it hard for rulers to implement more painful reforms. Where public goods provision has been scarce, the dominant effect of these pressures is economically beneficial for productivity. In societies where these basic services are already provided, the aggregate effect of mass participation on productivity growth turns negative as governments become less capable of decisive action to fix problems.
Results from using the FEVD method to account for fixed differences across countries, while permitting the invariant and slow-moving variables in the analysis to help explain these fixed differences, are presented in the online appendix. These estimates are strongly consistent with those using random effects. The positive effects of state authority, as measured by StateHist, are again found to be much stronger for countries associated with the investment-based growth paradigm than those engaged in innovation-based growth. The coefficients on the variables associated with ParComp, the competitiveness of political participation, are generally stronger in magnitude and are different from 0 with greater statistical confidence. For Checks, however, the FEVD analysis produces coefficients that are weaker in magnitude and indistinguishable from 0 with high confidence. Whereas the first set of results indicated that Checks was associated with slower productivity growth among countries in an investment-based growth paradigm, we are unable to draw the same conclusion with high confidence after accounting for fixed differences between countries.
Robustness Checks
A potential concern with these findings is that the institutional variables themselves are contextual factors that help define which growth paradigm is more applicable to a country at a particular time. In other words, does the development of certain institutional characteristics cause a growth paradigm to become more relevant? To test whether the institutional factors are relevant for identifying the growth paradigms, I included them as variables in the weighting equation of a mixture models estimation. The results, which are reported in the online appendix, show that only ParComp is statistically significant. Countries with higher political participation are more likely to be associated with Component 2 (innovation-based growth).
In one sense, this result is unsurprising. Countries at the technological frontier tend to be democracies with high political participation. ParComp may only serve as an indicator, in other words, to help sort country-years probabilistically. If the relationship is instead causal, we have an interesting puzzle. If high political participation causes innovation-based growth to become more applicable, why do the growth regressions in both Table 3 and the online appendix show that high values of ParComp are associated with slower overall growth in Component 2, with the additional finding that this effect is due to slower productivity growth in particular? The theory presented here provides an explanation. High political participation is a double-edged sword, the benefits of which are felt when public goods are needed most desperately and the costs of which come from hindering the economic adjustments that maintain leading-edge growth.
A second concern may be that institutional choice is endogenous to development due to the distributional effects of economic development. To test whether distributional pressures alter which growth paradigm is most applicable, and thus the effect of institutions on growth, I included the measure of market income inequality (Gini coefficient) from Solt (Reference Solt2009) as a contextual variable in the weighting equation of a mixture models estimation. The results, again reported in the online appendix, reveal that inequality is not a relevant weighting factor. The growth regressions based on the resulting component weights are also fully consistent with the hypothesized expectations.Footnote 18
Discussion
In previous work in the NIE, a common precept has been that countries can grow rapidly if they can just get the institutions ‘right.’ Typically, this meant that institutions in low-income countries should look more like those in the advanced economies. The present study provides evidence consistent with a different perspective: the institutional prescriptions for ‘catch-up’ growth differ from those that sustain the growth of technologically advanced economies. These findings emerge when we break with the assumption that there is a universal growth paradigm.
A strategy of investment-based growth, in which countries draw from a menu of existing technologies to sustain capital investment, can be successful if states are sufficiently authoritative to facilitate this process. Competent states provide the foundation for both productivity improvements and capital investment (whether domestic or foreign in origin) either by creating conditions in which private investment is attractive or through the direct provision of capital. High levels of political participation rights temper the accumulation of capital stock, raising the overall growth rate while increasing the share of growth driven by productivity. Constraints on rulers in the form of institutional separation of powers, on the other hand, slow productivity growth.
This analysis suggests two variants of catch-up growth: one that produces rapid growth driven by intensive state-led capital investment in a climate of restricted political rights and another that leads to more balanced growth in a more open, contested political environment. The East Asian capitalist developmental states exemplify the former type, while India serves as an example of the latter. Either variant depends upon basic state authority, and high levels of constraints on rulers temper productivity growth in both types.
Among countries that reach the technological frontier, productivity growth becomes relatively more important. The level of state authority no longer explains variation in growth rates, and political constraints have, if anything, a positive effect on productivity growth. This finding is consistent with the expectation that constraints hinder the ability of vested interests to use the political system to block competition that arises from unanticipated technological shifts. For these countries, higher levels of political rights are found to have a slight negative effect on the rate of productivity growth. The implication is that as countries reach the stage of innovation-based growth, the economically beneficial effects of competitive political participation for promoting the provision of public goods begin to be outweighed by the economic efficiency costs of broad voter demands.
Summary
The estimation procedure presented in this article demonstrates that we can attain a richer understanding of the interrelationships between political institutions and economic performance if we part with the assumption that a single linear growth model is sufficient to represent all countries and times. The findings strongly support the expectation that there are different growth paradigms and that political institutions have very different effects in these different paradigms. There is no single style of growth supported by an ideal institutional mixture. Analyzing the main factors of economic growth separately also reveals important nuances. The institutional outputs that generate rapid growth in one factor may not be helpful for supporting growth in another factor.
First, the analysis highlights the importance of basic state authority for countries at the bottom end of the world economy. For these countries, state authority is linked with both faster TFP and capital stock growth. The neoliberal claim that the state is the source of economic decay is far too simple. State policies can distort economies, but a weak state cannot provide the conditions for steady economic development.
Secondly, this study challenges the claims from the empirical literature in the NIE that constraints on rulers are the key to growth through the creation of the conditions in which private investment will flourish. Instead, constraints in the form of the separation of powers were found to have the strongest impact on productivity growth. Constraints were not associated with higher growth rates of capital stock per worker in any test. Instead, constraints impede productivity growth in an investment-based growth paradigm.
Thirdly, the effects of political participation rights are context dependent and operate differently through different growth factors. Among low-to-moderate income countries that lag behind the technological frontier, political rights lead to faster productivity growth but slower rates of capital accumulation. Among advanced economies, however, high levels of political rights can temper the rate of TFP growth. This finding helps explain the ambiguous effects of democracy in the broader empirical literature, which examines the effect of democracy on average across all countries.
Finally, an important implication of these findings is that we need not abandon the quest to understand broader relationships between political institutions and economic performance. Growing frustration with the lack of robust findings in growth regressions has caused some researchers to move to the other extreme, searching instead for country-specific growth recipes that outline particular policy adjustments. While this approach can certainly prove beneficial at the individual country level, there remains a fertile middle ground that is relatively unexplored with econometric analysis. Broad institutional features have consequences that are desirable in some contexts but not others.