


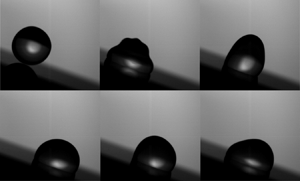



1. Introduction
Mathematician Marc Kac famously asked the question ‘Can one hear the shape of a drum head?’ in what is now synonymous with inverse problems in mathematical physics (Kac Reference Kac1966). The conjecture is that if one knows the frequency spectrum of the wave equation for the drum head, then the shape (or part of the shape) can be inferred from the spectral data. Our study of oblique drop impact is conveniently framed as an analogy to this question. In the spirit of Kac, we ask a similar question: can one infer the angle of an impacting drop? More precisely, if we are given the Fourier spectra of the liquid/gas interface vibrations for an impacting drop, can we back out information such as its incident angle  $\beta$, volume
 $V$ and contact angle
 $\alpha _p$?
The study of drop impact dates back to Worthington (Reference Worthington1877, Reference Worthington1895), who first observed the forms generated by a drop of milk falling onto a glass plate, piquing a curiosity into drop impact lasting more than a century (Rein Reference Rein1993; Rioboo, Tropea & Marengo Reference Rioboo, Tropea and Marengo2001; Richard, Clanet & Quéré Reference Richard, Clanet and Quéré2002; Thoroddsen et al. Reference Thoroddsen, Etoh, Takehara, Ootsuka and Hatsuki2005; Yeong et al. Reference Yeong, Burton, Loth and Bayer2014; Aboud & Kietzig Reference Aboud and Kietzig2018). Edgerton & Killian (Reference Edgerton and Killian1954) were so moved by Worthington's corona splash that they developed the technology to capture a full-colour image that is now labelled as one of TIME magazine's most influential images of all time. Since the seminal work of Worthington, there has been sustained scientific interest in the complexity of drop impact as a canonical multiphysics and multiscale problem in fluid dynamics, whose understanding is subliminal yet necessary for the efficacy of crop sprays (Bergeron Reference Bergeron2003; Mercer, Sweatman & Forster Reference Mercer, Sweatman and Forster2010; Delele et al. Reference Delele, Nuyttens, Duga, Ambaw, Lebeau, Nicolai and Verboven2016; Massinon et al. Reference Massinon, De Cock, Forster, Nairn, McCue, Zabkiewicz and Lebeau2017), aerosol drug delivery (Dolovich & Dhand Reference Dolovich and Dhand2011), quality control in rapid prototyping (Nayak et al. Reference Nayak, Mohanty, Nayak and Ramadoss2019; van der Meulen et al. Reference van der Meulen, Reinten, Wijshoff, Versluis, Lohse and Steen2020), and the mitigation of soil erosion from rain (Al-Durrah & Bradford Reference Al-Durrah and Bradford1982), and whose study has undergone a renaissance in the past few decades due to advances in high-speed imaging technologies (Versluis Reference Versluis2013).
Most prior studies of drop impact focus on normal impact with a solid substrate, de-emphasizing the role of liquid inertia and impact geometry (Yarin Reference Yarin2006; Grishaev et al. Reference Grishaev, Iorio, Dubois and Amirfazli2015; Josserand & Thoroddsen Reference Josserand and Thoroddsen2016). Here, we consider oblique drop impact onto partially wetting solids in the capillary-ballistic regime, defined by a moderate Reynolds number  $Re \sim O(100)$, and a low Weber number
 $We \sim O(1)$. We treat the impacting event as an inverse problem, reconstructing the impact conditions from the post-impact liquid/gas vibration frequency spectrum and modal energy partitioning.
Kern, Bostwick & Steen (Reference Kern, Bostwick and Steen2021) have shown recently that for normal drop impact, the drop's liquid/gas interface vibrates in mode shapes predicted for sessile drops (Bostwick & Steen Reference Bostwick and Steen2014; Chang et al. Reference Chang, Bostwick, Daniel and Steen2015; Steen, Chang & Bostwick Reference Steen, Chang and Bostwick2019). In this paper, we show that the same is true for oblique drop impact. For reference, we summarize those results as they form the basis for our reconstruction of the liquid/gas interface shape. Bostwick & Steen (Reference Bostwick and Steen2014) showed that the interface deformation  $y$ for a sessile drop with pinned contact line obeys an operator equation
 \begin{equation} K[y] + \lambda^2\,M[y] = 0, \end{equation}
where the  $M$ and
 $K$ operators are related to the fluid inertia and restoring forcing of surface tension, respectively. A spectral method is used to reduce the operator equation to a standard eigenvalue problem using the Rayleigh–Ritz method. Equation (1.1) admits eigenvalue
 $\lambda _{[k,l]}$ and eigenmode
 $y_{[k,l]}$ solutions, defined by the mode number pair
 $[k,l]$ inherited from a spherical harmonic classification scheme with
 $k+l=\textrm {even}$, needed to enforce the no-penetration condition on the solid support. Here,
 $k$ represents the number of nodes that a shape traces with its base state in side view, and
 $l$ represents the number of sectors or lines of symmetry that a shape has when viewed from above. Typical mode shapes are shown in figure 1. Each resonance mode has a natural frequency
 $f_{[k,l]}$ determined by the drop's pinned contact angle
 $\alpha _p$ (which can fall anywhere in the range of the contact angle hysteresis), contact-line radius
 $a$ (equivalently, volume
 $V$), surface tension
 $\sigma$, and density
 $\rho$. The predicted mode shapes form an orthogonal basis, and we use this fact to resolve the shape-change dynamics of the vibrating interface for a post-impact drop.
Sessile drop mode shapes defined by mode number pair  $[k,l]$ in two-dimensional polar, three-dimensional side, and three-dimensional top views. Here,
 $\alpha =90^\circ$.

2. Experiment
Drops are formed by pumping de-ionized (DI) water at 1  $\mathrm {\mu }$l s
 $^{-1}$ from a ramé-hart auto-dispensing system through 22 or 30 gauge syringe tips, resulting in drops of
 $13.8 \pm 0.1\ \mathrm {\mu }$l or
 $6.3 \pm 0.1\ \mathrm {\mu }$l, respectively. The formed drops are allowed to break freely from the syringe tip and accelerate due to gravity from a height
 $h$ ranging from
 $2.8$ mm to
 $25.1$ mm above a substrate inclined at angle
 $\beta =0\unicode{x2013}60^\circ$ from the horizontal, as shown in figure 2(a). This corresponds to impact Weber numbers
 $We \equiv 2\rho g h d/ \sigma = 0\unicode{x2013}16$, where
 $d$ is the pre-impact drop diameter. Drop radii are smaller than the capillary length scale
 $\ell _c=\sqrt {\sigma /\rho g}$, thus gravity can be ignored. The substrates are modified chemically to produce different contact angles
 $\bar {\alpha }$ and hysteresis
 $\Delta \alpha$, as shown in table 1. Details about the surface preparation can be found in Appendix A.
Experimental set-up. (a) Water drops are generated from an auto-dispenser and impact a substrate inclined at angle  $\beta$. High-speed imagery captures the impacting event. (b) Post-impact, the contact line spreads before coming to rest at pinning angle
 $\alpha _p$. Post-pinning, the drop's motion is restricted to liquid/gas interfacial oscillations according to sessile drop theory (Bostwick & Steen Reference Bostwick and Steen2014). The sessile drop geometry is defined by the spherical cap's radius
 $R$, the deformation of the liquid/gas interface normal to the base state
 $c$, the drop's footprint radius
 $a$, and the polar and azimuthal angles
 $\theta,\phi$, respectively.

Substrate identification with wetting properties defined by the equilibrium angle  $\bar {\alpha }$ and contact-angle hysteresis
 $\Delta \alpha$.

The impacting event is recorded using a Redlake Motion Xtra HG-XL high-speed camera at a minimum frame rate of 5000 fps. The motion of the drop's interface was post-processed in MATLAB by tracking the liquid/gas interface along a ray extending from the drop's centre using subpixel edge detection techniques (Trujillo-Pino et al. Reference Trujillo-Pino, Krissian, Alemán-Flores and Santana-Cedrés2013; Trujillo-Pino Reference Trujillo-Pino2019). Fast Fourier transforms (FFTs) were performed to determine the drop's frequency spectrum.
3. Results
The impacting event can be decomposed into three stages as shown in figure 2(b): ‘pre-impact’, ‘spreading’ (post-impact) and ‘pinning’ (post-impact). Pre-impact is defined by the drop falling freely until coalescence with the substrate. Spreading is defined by advancing and receding inertial motion of the contact line, separating the liquid/solid/gas phases. Pinning is defined as the instant in time when the contact line comes to its final resting position, after which the liquid/gas interface oscillates, dissipating energy through viscous dissipation. This final resting position can be characterized by the drop's pinning contact angle  $\alpha _p$, which can fall anywhere within the the drop's contact angle hysteresis, as illustrated in figure 4(a) by each substrate's range of
 $\alpha _p$. We consider only deposition drop impacts, where no splashing, receding breakup or rebound occurs, as illustrated in figure 2(b), and focus on liquid/gas vibrations during pinning.
The liquid/gas interface oscillates in a linear combination of mode shapes,  $y=\sum c_{[k,l]}\,y_{[k,l]}$, described by theory (Bostwick & Steen Reference Bostwick and Steen2014, Reference Bostwick and Steen2016). Each mode
 $y_{[k,l]}$ has a unique polar angle
 $\theta$ maximizing that mode's contribution to the interface shape
 $c_{[k,l]}$ defined as the disturbance normal to the drop's base state as measured at the onset of pinning (see Appendix B).
During normal drop impact,  $\beta =0^\circ$, we have shown that during pinning, the drop vibrates in a linear combination of axisymmetric
 $l=0$ modes with corresponding frequencies
 $f_{[k,0]}$ (Kern et al. Reference Kern, Bostwick and Steen2021). Figure 3(a) shows that for oblique impact, the frequency spectrum consists of both the
 $l=0$ and
 $l=1$ modes. The frequencies
 $\hat {f}$ were measured by performing an FFT of the time trace of
 $c$ at a polar angle
 $\theta$ that maximizes
 $c_{[k,l]}$ for each mode shape. Here,
 $\hat {f}$ is scaled by the capillary time
 $\tau$:
 \begin{equation} \hat{f}=f\tau=f\sqrt{\frac{\rho a^3}{\sigma}}, \end{equation}
where  $a$ is the footprint radius of the drop. For
 $l=0$ modes,
 $c_{[k,0]}$ is maximized at the drop's apex,
 $\theta =0^\circ$, but for the
 $l=1$ modes, the
 $\theta$ that maximizes
 $c_{[k,1]}$ depends on the pinning angle
 $\alpha _p$. We note from figure 3(a) that
 $\hat {f}$ is independent of
 $\beta$ and that experiments follow theoretical predictions well over a range of pinning angles
 $\alpha _p$. We also note a monotonic relationship in the frequency spacing between modes.
Scaled frequency ratios determine  $\alpha _p$. (a) Experimental and theoretical scaled frequencies
 $\hat {f}$ against pinning angle
 $\alpha _p$ for the
 $l=0,1$ mode shapes. Measured
 $\hat {f}$ are independent of
 $\beta$. (b) The frequency ratio
 $\hat {f}_{[4,0]}/\hat {f}_{[1,1]}$ is not monotonic with respect to
 $\alpha _p$, therefore a single frequency ratio
 $\hat {f}_{[k,l]}/\hat {f}_{[1,1]}$ is not enough information to determine
 $\alpha _p$. (c) By knowing two frequency ratios
 $\hat {f}_{[k,l]}/\hat {f}_{[1,1]}$,
 $\alpha _p$ can be determined uniquely (
 $\alpha _p$ increases in the clockwise direction).

To infer the pinning angle  $\alpha _p$ from the spacing in the frequency spectrum between any two modes is not sufficient, as
 $\alpha _p$ is double-valued with respect to
 $\hat {f}_{[k,0]}/\hat {f}_{[1,1]}$ (cf. Figure 3b). However, knowing two frequency spacings is sufficient. As such, a plot of
 $\hat {f}_{[k_1,0]}/\hat {f}_{[1,1]}$ against
 $\hat {f}_{[k_2,0]}/\hat {f}_{[1,1]}$, where
 $k_1\neq k_2$, provides a unique determination of
 $\alpha _p$ (cf. figure 3c), with
 $\alpha _p$ increasing as the curve is traversed in a clockwise direction. This invariance of
 $\hat {f}$ with
 $\beta$ combined with the monotonic relationship between
 $\hat {f}$ and
 $\alpha _p$ implies that we can determine the pinning angle
 $\alpha _p$ from knowledge of the resonance frequency of any two modes
 $\hat {f}_{[k,l]}\neq \hat {f}_{[1,1]}$ scaled by
 $\hat {f}_{[1,1]}$, such that
 $\hat {f}_{[k_1,l_1]}/\hat {f}_{[1,1]}= f_{[k_1,l_1]}/f_{[1,1]}$ and
 $\hat {f}_{[k_2,l_2]}/\hat {f}_{[1,1]}= f_{[k_2,l_2]}/f_{[1,1]}$. Once the pinning angle
 $\alpha _p$ is known, the radius
 $R$ can be determined from theory, given the liquid properties
 $\sigma, \rho$, resonance frequency of any mode
 $f_{[k,l]}$, and pinning angle
 $\alpha _p$.
3.1. Role of inclination angle  $\beta$

The decomposition of the liquid/gas interface oscillations into modal components shows that  $c_{[k,l]}$ is maximized for each
 $l=0,1$ mode at a specific polar angle
 $\theta$. Figures 4(a)–4(c) show a set of FFTs performed for a single experiment at different
 $\theta$. For all
 $l=0$ modes,
 $c_{[k,0]}$ is maximized at the drop's apex
 $\theta = 0^\circ$ (cf. figure 4a), whereas for the
 $l=1$ modes,
 $c_{[k,1]}$ is maximized at
 $\theta \neq 0^\circ$ (cf. figures 4b,c). These values of
 $\theta$ can be found from theory by knowing the drop's liquid properties (
 $\sigma, \rho$) and
 $\alpha _p$ (Bostwick & Steen Reference Bostwick and Steen2014). Note that figures 4(a)–4(c) show that changing
 $\theta$ does not shift
 $f_{[k,l]}$, but only the ratios of
 $\bar {c}_{[k,l]}$ for each mode, where
 $\bar {c}_{[k,l]}$ denotes the average magnitude of
 $c$ measured throughout pinning. Similarly, each mode shape has a set of
 $\theta$ where
 $c=0$, corresponding to nodes. For example, each mode with
 $l>0$ has a node at its apex
 $\theta =0^\circ$, as can be seen for the
 $[3,1]$ mode in figure 2(b). For each
 $\theta$ corresponding to a node, the corresponding frequency
 $\hat {f}$ is muted in the FFT, as shown in figures 4(a)–4(c).
Fast Fourier transforms of the drop's liquid/gas interface measured at different interface locations  $\theta$ for a single experiment. Here,
 $R=1.76$ mm,
 $\alpha _p=97.7^\circ$ and
 $\beta =18^\circ$. Note the different
 $y$-axis scales and how the positions of the frequency peaks do not shift when the measurement angle
 $\theta$ is varied. Interface disturbances
 $c_{[k,l]}$ are maximized at (a)
 $\theta =0^\circ$ for the
 $[2,0]$ mode, (b)
 $\theta =26^\circ$ for the
 $[3,1]$ mode, and (c)
 $\theta =53^\circ$ for the
 $[1,1]$ mode.

The decomposition of the frequency spectrum in figure 4 into  $l=0,1$ components can yield information about the inclination angle
 $\beta$. To illustrate, let us motivate by considering the case of an elastic collision between a point mass and substrate. The principle of momentum conservation dictates that a ball bouncing off a substrate will have an incident angle equal to its deflection angle. This idea suggests that we consider the drop as a point mass and focus on the motion of the drop's centre of mass (CoM) during pinning. Figure 5(a) shows the motion of a drop's CoM for a sessile drop with typical
 $l=0$ and
 $l=1$ mode shapes (Wesson & Steen Reference Wesson and Steen2020). The
 $l=0$ modes have CoM motion that is solely normal to the substrate (
 $\hat {z}$ direction), whereas
 $l=1$ mode shapes have CoM motion in both the
 $\hat {z}$ and
 $\hat {x}$ directions, with the
 $[1,1]$ mode being nearly horizontal (
 $\hat {x}$ direction). The primary carriers of the normal and horizontal CoM motions are the
 $[2,0]$ and
 $[1,1]$ modes, respectively.
Centre of mass trajectories explain liquid/gas interface disturbance decomposition. (a) Centre of mass (CoM) motion trajectories. Dotted lines represent extended trajectories (Wesson & Steen Reference Wesson and Steen2020). Solid blue lines represent CoM trajectories corresponding to 10 % disturbances of the interface,  $c/R = 0.1$. The CoM of the
 $l=0$ modes moves exclusively in the
 $\hat {z}$ direction, while the
 $[1,1]$ mode is primarily in the
 $\hat {x}$ direction. The CoM motions of the
 $[3,1]$,
 $[5,1]$,
 $[1,1]$ modes have components in both the
 $\hat {x}$ and
 $\hat {z}$ directions. (b–d) Decomposition of liquid/gas interface disturbance
 $c_{[k,l]}$ against impact angle
 $\beta$ for two sets of experiments. Impact kinetic energy ranged from 15 % to 25 % of the pre-impact liquid/gas surface energy. As
 $\beta$ increases: (b)
 $c_{[1,1]}$ increases and (c)
 $c_{[2,0]}$ decreases, monotonically. Note the different
 $y$-axis scales. (d) The ratio
 $c_{[2,0]}/c_{[1,1]}$ decreases monotonically with
 $\beta$, allowing one to determine
 $\beta$ uniquely from the modal decomposition.

During normal  $\beta =0^\circ$ impact, only
 $l=0$ modes are excited, and the CoM motion is purely in the
 $\hat {z}$ direction (Kern et al. Reference Kern, Bostwick and Steen2021). For drop impacts with
 $\beta \neq 0^\circ$, both
 $l=0$ (pure
 $\hat {z}$ motion) and
 $l=1$ (
 $\hat {z}$ and
 $\hat {x}$ motion) modes are excited, as shown in figure 3(a). As
 $\beta$ increases, we expect more of the drop's CoM motion to partition into
 $\hat {x}$ motion (
 $l=1$ modes), as could be inferred from figure 5(a). Figures 5(b) and 5(c) plot the modal decomposition
 $c_{[k,l]}/R$ for a range of drop impacts over increasing
 $\beta$ with
 $\alpha _p$ held constant. We see results that meet our expectations. For
 $l=0$ modes (
 $[2,0]$ shown), we see a decrease in
 $c_{[2,0]}$ as
 $\beta$ increases, whereas for the
 $[1,1]$ mode, we see an increase in
 $c_{[1,1]}$ as
 $\beta$ increases. Note the monotonic relationship between
 $\beta \in [0^\circ,60^\circ ]$ and
 $c_{[k,l]}/R$ shown in figures 5(b) and 5(c). The ratio
 $c_{[2,0]}/c_{[1,1]}$ is both resolvable and monotonic for
 $\beta \in [0^{\circ } , 30^{\circ }]$, as shown in figure 5(d), implying that knowledge of
 $\beta$ for an individual impact could then be inferred. That is, we could predict the inclination angle
 $\beta$ from the spectral data for
 $c_{[2,0]}$ and
 $c_{[1,1]}$, assuming that the characteristic
 $c_{[2,0]}/c_{[1,1]}$ against
 $\beta$ relation was previously determined for the system.
4. Concluding remarks
In this work, we performed experiments of oblique drop impact on partially-wetting substrates and asked the question ‘Can one infer the angle of impact?’ from the spectral data, thus making an analogy with the famous inverse problem of Kac (Reference Kac1966): ‘Can one hear the shape of a drum?’ Not all inverse problems are solvable. Even for Kac's drum, a solution starting from only the frequency spectrum is impossible (Gordon & Webb Reference Gordon and Webb1996). However, aspects of the solution, such as the area of the drum's interface  $\varOmega$, can still be known. Here, we found that knowledge of the drop's post-impact frequency spectrum
 $\hat {f}$ and liquid properties (
 $\sigma,\rho$) allows us to determine uniquely the drop's rest angle
 $\alpha _p$ and radius
 $R$ (equivalently, volume
 $V$), analogous to Kac's drum area
 $\varOmega$. With regard to the latter, we could have inferred the surface tension
 $\sigma$ just as easily given a known drop volume
 $V$ of density
 $\rho$, and this may be an important measurement for freshly deposited drops. Next, we showed how to determine the inclination angle
 $\beta$ from the modal decomposition of the liquid/gas vibrations
 $c_{[2,0]}/c_{[1,1]}$. Which leaves open the question, can the relation between
 $c_{[2,0]}/c_{[1,1]}$ and
 $\beta$ be determined a priori?
Our results have broad underlying implications for real-time monitoring of manufacturing processes utilizing drop deposition, e.g. the fabrication of solar cells (Stüwe et al. Reference Stüwe, Mager, Biro and Korvink2015; Karunakaran et al. Reference Karunakaran, Arumugam, Yang, Ge, Khan, Lin and Yang2019), LEDs (Haverinen, Myllyla & Jabbour Reference Haverinen, Myllyla and Jabbour2010) and electroluminescent displays (Kim et al. Reference Kim2015), as well as the analysis of blood spatter patterns in forensic science (Raymond, Smith & Liesegang Reference Raymond, Smith and Liesegang1996; Hulse-Smith & Illes Reference Hulse-Smith and Illes2007; Comiskey et al. Reference Comiskey, Yarin, Kim and Attinger2016). By analysing the impacting event from an energy perspective, contact-line dissipation during spreading can be calculated via the difference between the pre-impact energy and the pinning energy stored in the liquid/gas oscillations (Kern et al. Reference Kern, Bostwick and Steen2021). This spreading energy is related directly to the contact-line dynamics and the contact-angle hysteresis of the liquid/gas/solid system. Our work in this capillary-ballistic spreading regime is particularly noteworthy and contrasts the vast majority of studies focusing on viscous-dominated spreading that gives rise to the well-known Tanner's law (Grishaev et al. Reference Grishaev, Iorio, Dubois and Amirfazli2015), all while considering the complex liquid/gas dynamics post oblique impact.
Acknowledgements
We acknowledge Professor P.H. Steen's role in leading this research, and note his passing before the time of publishing. We are honoured to be able to continue this work and bring it to the field. We would also like to acknowledge the insight provided by Y. Xia, E. Wesson, J. McCraney, S. Weinstein, J. Ludwicki, J. Mattson and S. Daniel throughout completion of this work.
Funding
The authors gratefully acknowledge support from NSF grants 1530522, 1637960 and 1935590.
Declaration of interests
The authors report no conflict of interest.
Appendix A. Materials
Glass slides (VWR VistaVision, catalog no. 16004-430,  $3~{\rm in}\times 1~{\rm in}\times 1~{\rm mm}$), sulphuric acid (95–98 % min., MW 98.08, CAS# 7664-93-9), ethanol (reagent alcohol, absolute, CAS# 64-17-5; Macron Chemicals), toluene (99.5 % min., MW 92.14, CAS# 108-88-3), and acetone (CAS# 67-64-1; Macron Chemicals) were purchased from VWR International (Radnor, PA, USA). Silicon wafers (Silicon Quest International, catalogue no. 808-007) were purchased from Silicon Quest International (San Jose, CA, USA). Hydrogen peroxide (50 wt%, SKU 516813-500ML, CAS# 7722-84-1, MW 34.01 g mol–1) was purchased from Sigma-Aldrich (St Louis, MO, USA). Fluorosilane (heptadecafluoro-1,1,2,2-tetrahydrododecyl trichlorosilane, CAS# 78560-44-8, MW 581.56), trimethylsiloxy terminated poly(dimethylsiloxane) (PDMS) (Gelest, Product Code DMS-T22) and APTES 99+% were purchased from Gelest (Morrisville, PA, USA). Light mineral oil (CAS# 8042-47-5) was purchased from Fisher Scientific (Pittsburgh, PA, USA). Liquid nitrogen and high-purity compressed nitrogen were purchased from Airgas (Radnor, PA, USA). A 14–30 g assortment of syringe tips (Part no. 922-005) were purchased from CML supply (via Amazon).
A.1. Fluorosilane substrate preparation
Glass slides were sonicated (Ultrasonic Cleaner, model B2500A-DTH, VWR) for 20 min in water to remove solid particles from their surfaces, then immersed in piranha solution (70 % sulphuric acid/30 % hydrogen peroxide) for 20 min to remove any organic contaminants. The slides were then rinsed with DI water (purified by an Elga Ultra SC MK2, Siemens) and kept immersed until needed. Two grams of mineral oil and 2  $\mathrm {\mu }$l fluorosilane were deposited in a plastic Petri dish and homogenized via manually stirring. The fluorosilane/mineral oil solution was placed in a vacuum desiccator. A trap in the line between the desiccator and vacuum pump was filled with liquid nitrogen to prevent pump corrosion from vaporized fluorosilane. A vacuum was pulled on the desiccator for 30 min to remove any gaseous impurities in the fluorosilane/mineral oil solution. The glass slides were removed from the DI water, blown dry with high-purity compressed nitrogen, and placed onto a clean dry rack. The vacuum on the desiccator was slowly broken, and the rack holding the glass slides was placed into the desiccator alongside the fluorosilane/mineral oil solution. A vacuum was pulled on the desiccator, now containing both the fluorosilane/mineral oil solution and the rack holding the glass slides, for 30 min. The desiccator was sealed and allowed to set for a minimum of 3 h to allow the deposition to react. Prior to experimental use, the slides were rinsed with (1) ethanol, (2) DI water, and dried with high-purity nitrogen gas.
A.2. APTES substrate preparation
Glass slides were sonicated (Ultrasonic Cleaner, model B2500A-DTH, VWR) for 20 min in water to remove solid particles from their surfaces, and then immersed in piranha solution (70 % sulphuric acid/30 % hydrogen peroxide) for 20 min to remove any organic contaminants. The slides were then rinsed with DI water (purified by an Elga Ultra SC MK2, Siemens) and kept immersed until needed. The interior of a 400 ml staining dish and glass rack were rinsed with (1) soap, (2) reverse osmosis water, (3) ethanol and (4) acetone, blown dry with compressed nitrogen, and baked dry in the oven for 15 min. 200 ml acetone, 8 ml APTES and the glass rack were deposited in the cleaned staining dish. Each glass slide was blown dry with high-purity compressed nitrogen and set in the APTES/acetone solution on the glass rack. The slides were soaked for 20 min. After soaking, the slides were heated in the oven at 85  $^\circ$C for 20 min. Prior to experimental use, the slides were rinsed with (1) ethanol, (2) DI water, and dried with high-purity nitrogen gas.
A.3. PDMS substrate preparation
Silicon wafers were cut into  $1\ {\rm cm} \times 1\ {\rm cm}$ pieces and then immersed in piranha solution (70 % sulphuric acid/30 % hydrogen peroxide) for 20 min to remove any organic contaminants. The slides were then plasma cleaned (Harrick Plasma BASIC) at 18 W and 300 mmTorr for 30 min. The slides were then placed inside 20 ml borosilicate glass scintillation vials and wetted with DMS-T22 as received. The vials were then capped and baked in an oven at 100
 $^\circ$C for 24 h. Prior to experimental use, the surfaces were rinsed with (1) toluene, (2) acetone and (3) DI water.
Appendix B. Calculating $c$

MATLAB code was written to track the liquid/gas interface along a ray extending from the drop's centre using subpixel edge-detection techniques. A fast Fourier transform (FFT) of this resultant time trace was calculated over the entirety of pinning. The initial perturbation of the liquid/gas interface corresponding to each mode,  $c_{[k,0]}$, was calculated from the FFT, and the decay rate of the corresponding mode (
 $\gamma _{[k,0]}$) was shown to be constant throughout pinning. The
 $\gamma _{[k,0]}$ were measured by breaking the time sequence of images into segments obeying the Nyquist condition – which states that a signal must be sampled at a rate of at least twice the highest frequency component to be observed – performing a FFT on each segment, and measuring the amplitude of each frequency peak as it decayed.


 Open access

