I. INTRODUCTION
Production of lightweight structures to reduce fuel consumption and increase energy efficiency, while maintaining safety and comfort standards, has long been a challenge for automotive and aerospace industries. Different approaches Reference Mallick1 such as using materials of less weight but similar performance – polymers and composites – or altering the current parts by high-stiffness, reduced weight designs have been attempted by industries. The challenge for utilizing alternative designs is a manufacturing process with the capability of fabricating complex structures with reduced need for postprocessing to get the end products. Reference Mallick1
Additive manufacturing (AM) has attracted the interest of researchers over the past decade, as a layerwise technique enabling manufacturers to produce parts with high geometric complexity in reduced time and with no tooling requirement. Some of the materials and processes used are mature enough that AM techniques have been transformed from producing prototypes with poor and unrepeatable properties to producing end-use parts with properties comparable with the ones from conventional techniques.
Laser sintering (LS) is an AM process where a laser scans the surface of a layer of powder to sinter the particles to fuse and form a new part. Unlike other AM processes, LS allows building of parts from a wide range of materials including polymers, metals, and various types of composites, while possessing the advantages of AM. However, to use this process in automotive applications the mechanical properties of the parts must be satisfactory and must meet the standard requirements.
Tensile properties are the most widely provided properties of LS Nylon 12 by the manufacturers. There is also a noticeable amount of research dedicated to the behavior of polymer LS parts in tension; ultimate tensile strength and elongation at the breaking point of the parts Reference Zarringhalam, Hopkinson, Kamperman and de Vlieger2–Reference Goodridge, Hague and Tuck5 ; and the effect of build parameters; energy density, cooling rate, scan pattern, Reference Goodridge, Hague and Tuck5–Reference Goodridge, Tuck and Hague7 and build orientation Reference Amado-becker, Díaz and Ramos-grez8 on them. Other studies have assessed their compressive modulus and compressive strength in parts with different build orientations. Reference Ajoku, Saleh, Hopkinson, Hague and Erasenthiran9,Reference Ajoku, Hopkinson and Caine10
In the context of automotive and aerospace industries, many of the internal parts are naturally under dynamic loading of which the bearings and engine caps are good examples. Even if the cyclic loading is not directly applied within the system, the interaction of the entire structure with the road and/or with the surrounding environment could cause dynamic loading applied to the internal components. Reference Happian-Smith11 Furthermore many polymeric biomaterials such as biomedical implants and devices, which are considered as a growing market for AM processes due to their complex shapes, experience a combination of static and dynamic loading in their service conditions. Reference Mazzoli12
However, dynamic behavior of polymer LS parts has been scarcely studied previously, in spite of its vital importance. In a study by Blattmeier et al. Reference Blattmeier, Witt, Wortberg, Eggert and Toepker13 LS specimens with treated and nontreated surfaces were used to examine surface influence on their fatigue behavior in a load increase method, where the load amplitude was increased in sequences. Van Hooreweder et al. Reference Van Hooreweder, Moens, Boonen, Kruth and Sas14,Reference Van Hooreweder, De Coninck, Moens, Boonen and Sas15 have investigated thermal and microstructural response of LS parts to dynamic loading. Munguia et al. Reference Munguía, Dalgarno and Reid16 have conducted some initial studies on four-point fatigue bending of standard LS parts and axial fatigue loading of standard fused deposition modeling (FDM, trademarked name) parts. The long-term mechanical performance of running shoe midsoles made of laser-sintered elastomer material subject to cyclic compressive loading has been investigated by Davidson. Reference Davidson17
Since none of the few studies on dynamic performance of laser-sintered polymers have considered tension-only dynamic behavior of these materials, the focus of this work is to provide an understanding of the tensile–tensile dynamic performance of laser-sintered polymer parts. The behavior of these parts throughout their life is investigated by their load-cycle, stress relaxation, and hysteresis plots, and new findings are presented.
II. METHODOLOGY
For investigating the viscoelastic behavior of the material, Dynamic Mechanical Thermal Analysis (DMTA) testing was performed. The data from this experiment provided the elastic modulus and loss factor of the material and how they vary with temperature and frequency. The elastic modulus was used to design the dynamic test samples. Test specimens were made by LS from computer-aided design (CAD) models and tensile tests were performed to assess the loading range for dynamic testing. Samples were subjected to cyclic displacement-controlled tension–tension tests to observe their fatigue behavior.
III. TEST SAMPLE PREPARATION
A. Test sample design
1. DMTA
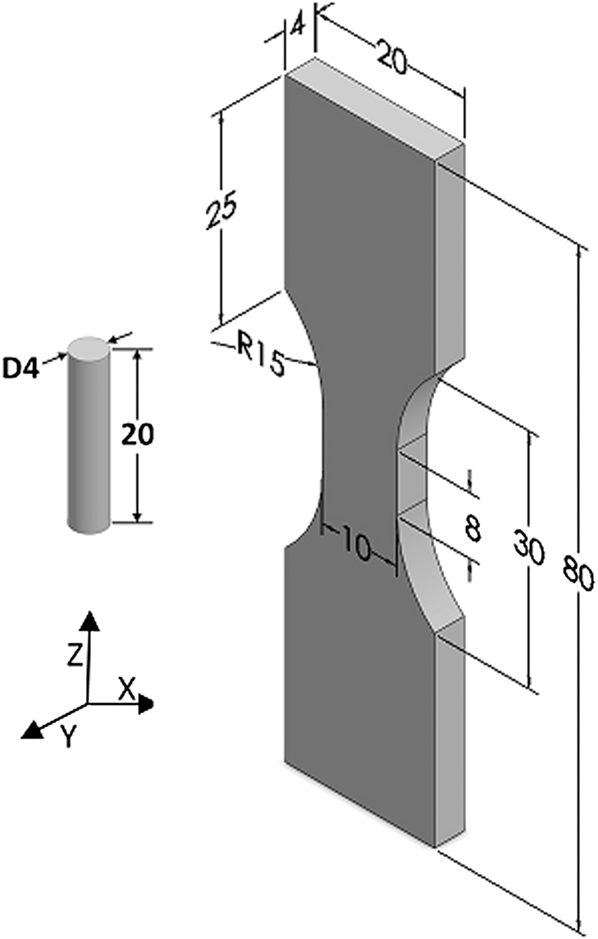
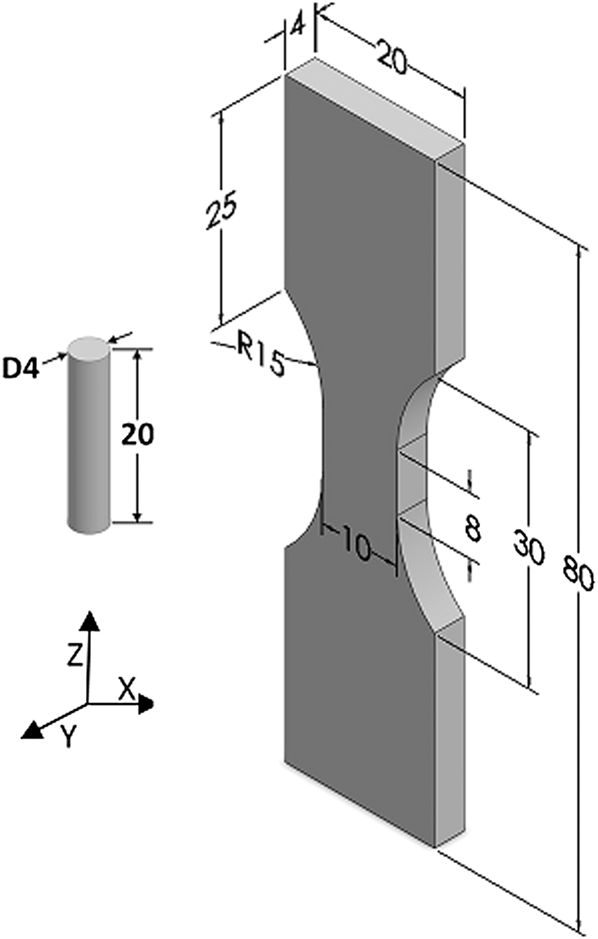
Test parts were manufactured in the shape of a simple cylinder with the dimensions shown in Fig. 1.
Dimensions and build orientation of the test specimens.
2. Mechanical testing
Tensile test specimens, whose geometries are shown in Fig. 1, were designed considering the limitations implied by the cyclic testing machine, such as grip dimensions. Calculations based on the modulus data from DMTA combined with machine loading capabilities resulted in a sample cross-section of 4 mm × 10 mm with effective length of 8 mm.
B. Test sample manufacturing
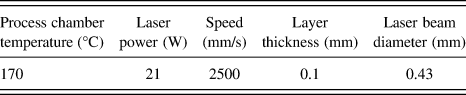
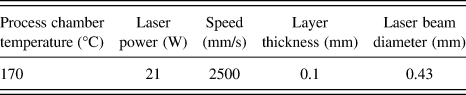
All specimens (DMTA and cyclic loading) were manufactured in “one-build” of a CO2-laser EOS P100 LS machine (EOS GmH-Electro Optical Systems, Krailing, Bavaria, Germany) to eliminate the possible difference in build conditions of different runs. Mixed EOS PA2200 (50% virgin, 50% used) as used by industry, otherwise known as Nylon-12 was used to manufacture the parts. Parts were built along (z) direction with their long axis perpendicular to the build platform as shown in Fig. 1, so that they would be loaded in their most critical direction and were all manufactured in one horizontal plane. Standard machine parameters, as shown in Table I, were used for manufacturing of the parts.
Standard machine parameters.
IV. EXPERIMENTAL PROCEDURE
Prior to testing, samples dimensions were measured by a set of digital Vernier calipers, the samples were weighed and their surface roughness was outlined by a SurfTest machine (Mitutoyo, Aurora, IL). Samples densities were also calculated from the measured mass and dimensions. These data were used to ensure that all test specimens were in similar conditions.
A. DMTA
A Metravib VA2000 Viscoanalyser (ACOEM group, Lyon, Rhone-Alpes, France) was used to perform DMTA tests on the sample. For calculating the elastic modulus of the material, the machine requires exact dimensions of the sample which were measured by a set of Vernier calipers (height = 20.1 mm, diameter = 3.98 mm). A sinusoidal strain of amplitude 0.001 was defined as the input signal of the machine. The machine parameters were then set as a starting temperature of 26.5 °C; the room temperature in the laboratory, and a final temperature of 110 °C. The frequency was also set to vary in each temperature step from 1 to 31 Hz in seven logarithmically spaced steps. The sample was bonded to the fixtures using cyanoacrylate adhesive and was then sealed in the thermal chamber. The machine measures the stiffness of the material in each step which is used to calculate the moduli and loss factor of the material.
B. Tensile test
All mechanical tests were performed by an MTS 858 table top system (MTS, Eden Prairie, MN), capable of applying both static and dynamic loads. Nine specimens were fixed in the machine using wedge grips and an increasing displacement with 5 mm/min rate was applied to the samples until they broke while the force was recorded.
C. Cyclic test
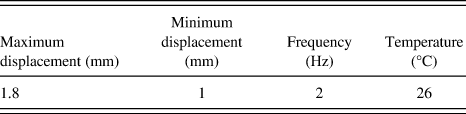
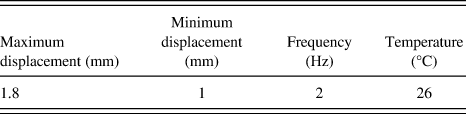
Same experimental setup was used for these sets of tests. Tension–tension displacement-controlled cyclic loading was applied to the specimens; the maximum peaks of which were selected based on their deflection at break and their minimum peak was selected to avoid inducing compression in the specimen (as shown in Table II), and the required force was recorded. The lower fixture of the machine, which contains the sensor, was fixed and the upper fixture was oscillated sinusoidally at 2 Hz by the actuator. Tests were carried out at room temperature (26 °C). Temperature of the specimens was measured by a thermocouple in contact with the surface of the sample as it was tested.
Cyclic test parameters.
D. Stress relaxation
Samples were fixed in the machine using the same grips and a displacement of 1.8 mm (maximum displacement in cyclic tests) was applied. The temperature was kept constant and samples were held at this displacement for a duration of 24 h while the load required to hold them was recorded.
V. RESULTS AND DISCUSSION
A. DMTA
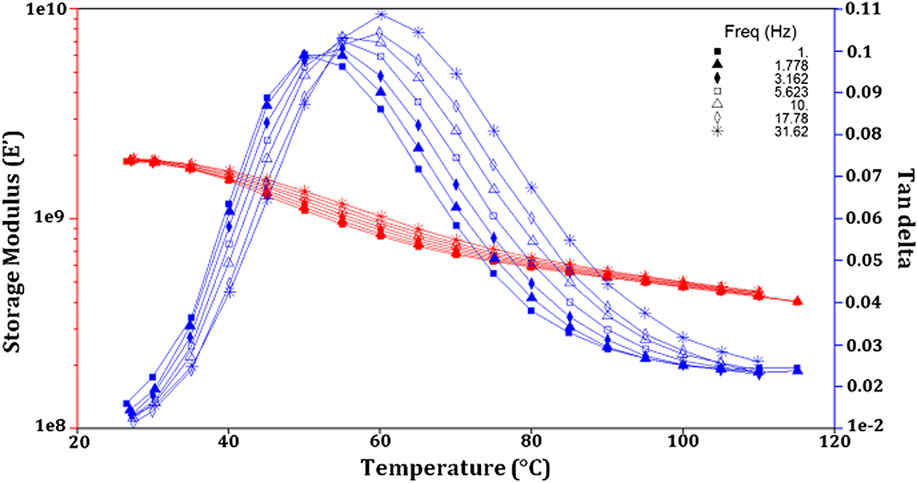
Figure 2 shows the change of storage modulus (E′), and loss factor (tan delta) of laser-sintered Nylon 12 with temperature in a frequency range of 1–31 Hz. The E′ plot presents a full picture of the load-bearing characteristics of the material as a function of changes in temperature while the tan delta curves help to identify the regions where relatively large changes in properties occur over relatively narrow bands of temperature. These regions show material transition stages and the most important of them is the glass transition. The glass transition region can be observed in the plots as maximum peak in the tan delta graphs. Reference Ferry18 The E′ of the material at ambient temperature was recorded as 1.9 GPa which is close to the amounts previously reported (2 GPa) Reference Zarringhalam, Hopkinson, Kamperman and de Vlieger2 and decreases continuously with increase in temperature. The glass transition temperature (T g) is observed as 52 °C at approximately 2 Hz which is comparable to the amounts reported for the solid Reference Greco and Nicolais19 although the T g of a polymer changes by the degree of crystallinity. Reference Olabisi and Adewale20
E′ and loss factor plots versus temperature in different frequencies.
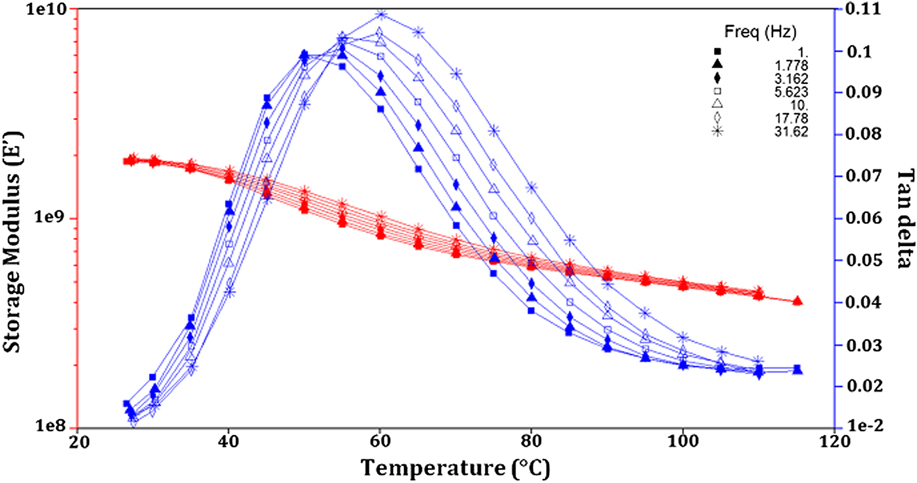
It can be seen in the plot that at higher frequencies, the E′ demonstrates higher values and the glass transition temperature shifts to a higher temperature. The glass transition is associated with the onset of long-range cooperative segmental mobility in the amorphous phase, in either an amorphous or semicrystalline polymer. In general, any factor that affects segmental mobility and those that influence the free volume available for segmental motion will affect T g.
B. Tensile test
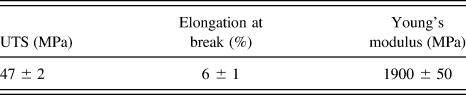
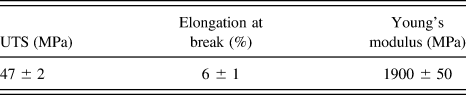
Tensile tests, the results of which are comparable with the literature Reference Ajoku, Saleh, Hopkinson, Hague and Erasenthiran9 were conducted to determine an appropriate load level for cyclic testing. Elongation at break of the samples was used to determine the starting maximum peak of the tests. Table III presents these values.
Mechanical properties of LS Nylon 12 parts in z-direction.
C. Cyclic test
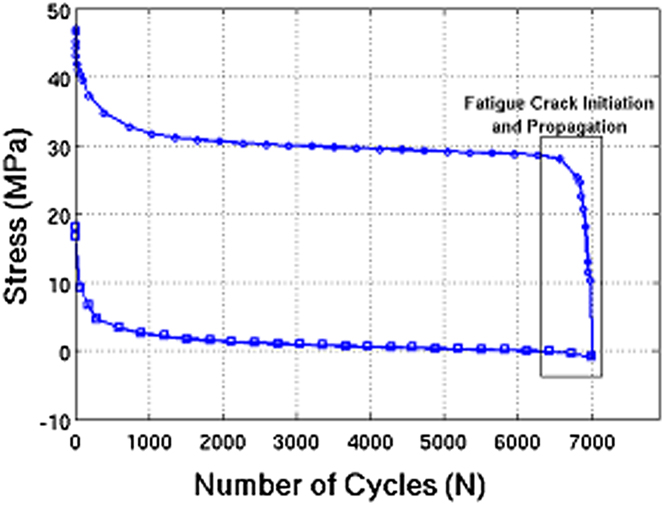
The stress history (evolution of the peak stress) of a cyclic test with maximum deflection of 1.8 mm and minimum deflection of 1 mm is shown in Fig. 3.
Stress versus number of cycles plot of a sample with maximum and minimum deflections of 1.8 mm and 1 mm.
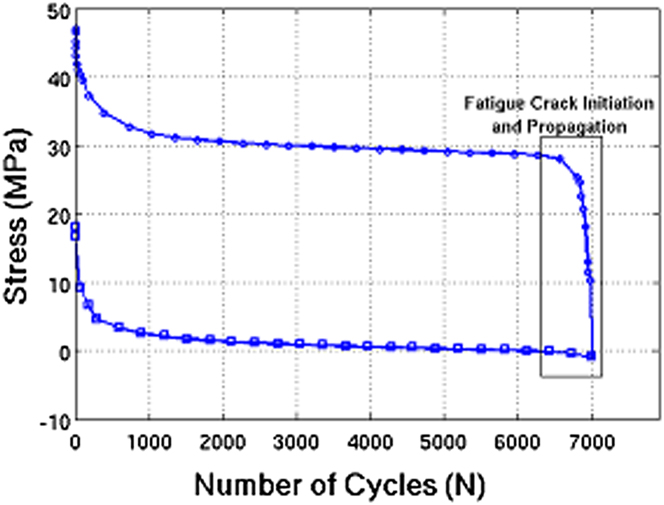
Although the minimum displacement was set to prevent compression, the sample still experiences compression at some point of the test. While the maximum and minimum values of stress recorded decrease over time, the difference between maximum and minimum remains constant until the final stages of cycling prior to failure, which indicates that creep is occurring. Therefore the sample does not seem to be experiencing fatigue until the final cycles. It is thought that the sample experiences a small amount of creep in each cycle which does not recover in the following cycles and causes a total increase in the specimen length and as a result a compression load on the specimen during latter stages of the test. No significant change in specimen temperature was observed during the tests.
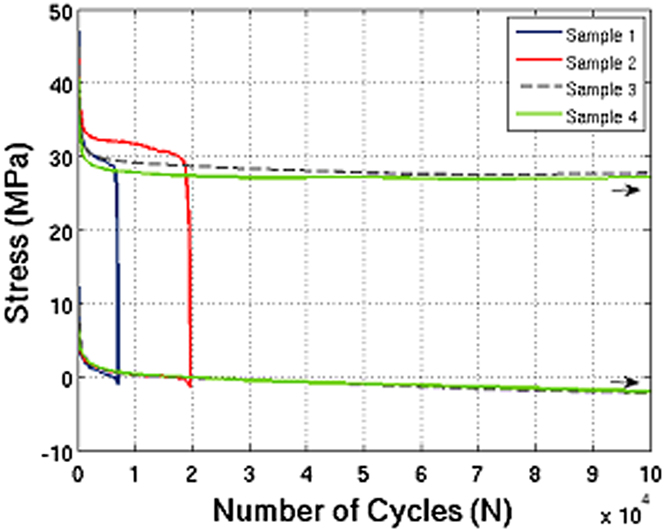
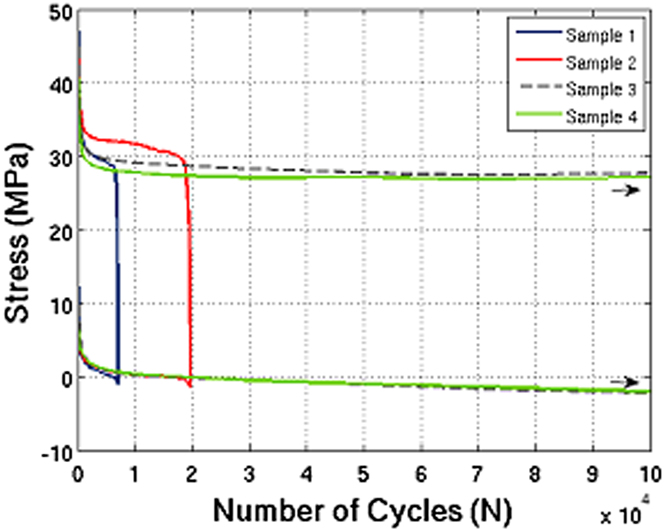
Applying the same test conditions to other specimens with the same size and built with the same machine parameters shows the variable behavior of this material under tension–tension cyclic loading. As illustrated in Fig. 4, while some of the samples have broken after a certain number of cycles, some others have gone on without breaking up to the point that they were removed from the machine.
Stress versus number of cycles plots of different test samples under the same test conditions.
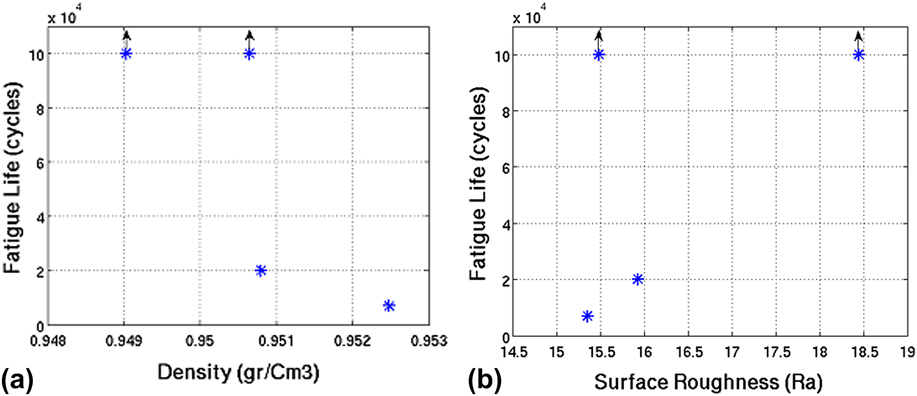
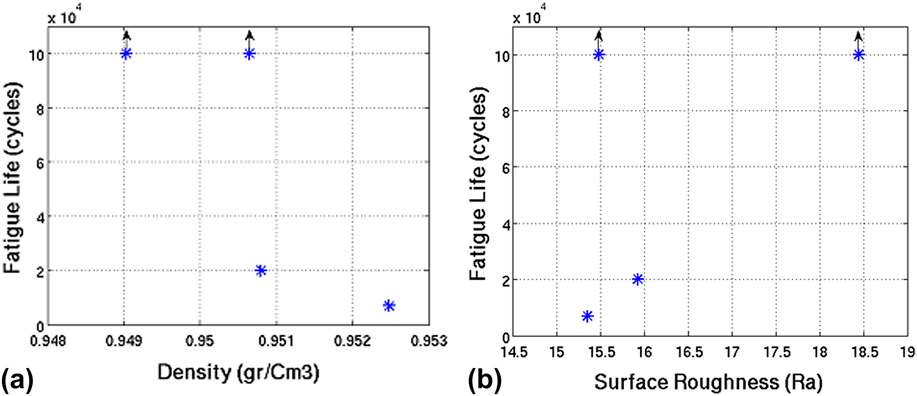
Fatigue life of the samples was plotted against their density and surface roughness (Fig. 5) to investigate possible correlations. It can be observed that the mentioned physical properties of the samples have no significant influence on their tension–tension fatigue life. Due to the porous and additive nature of the parts, presence of defects or inclusions might be the cause of weaker fatigue performance in some parts.
Comparison between (a) density and (b) surface roughness of cyclic samples with different fatigue life times.
D. Stress relaxation
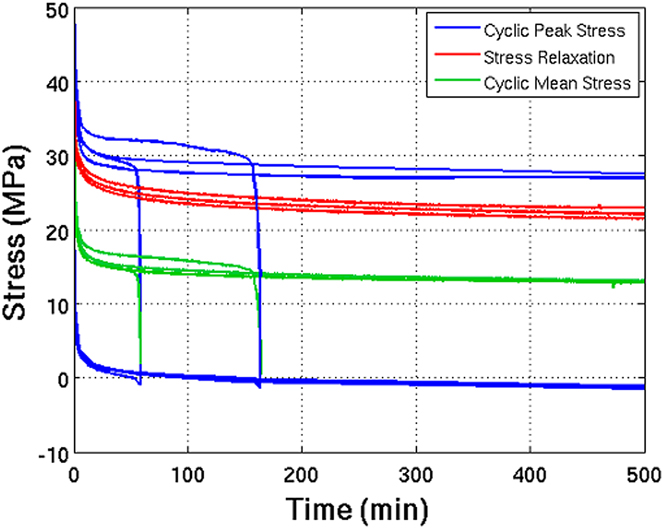
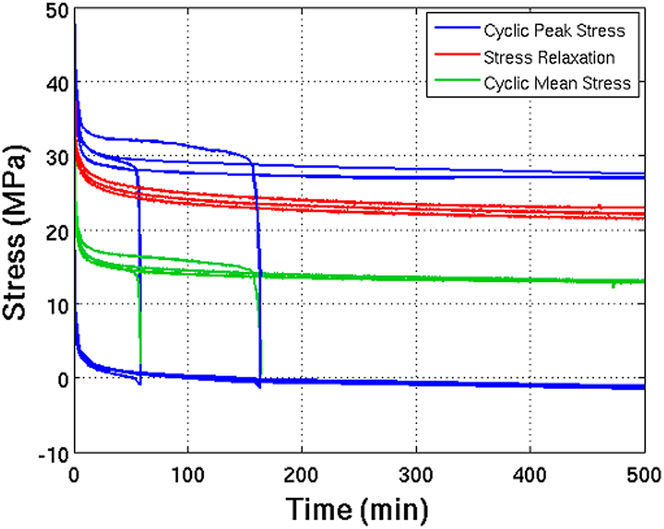
Stress relaxation tests were performed on three samples to compare their results with the results from displacement-controlled cyclic tests. The starting displacement was chosen as the maximum displacement in the dynamic tests (1.8 mm). For comparing the results peak stress plots of cyclically loaded samples, mean stress plots of the same samples and stress relaxation plots are shown in one graph in Fig. 6. It can be observed that despite the difference in stress level which is due to the difference in stress relaxation displacement (1.8 mm) and mean displacement in cyclic tests (1.4 mm), cyclic peak stress and stress relaxation plots follow similar paths up to the crack initiation points. This can be more clearly observed in comparing the stress relaxation and cyclic mean stress plots. It is apparent that the samples exhibit a combination of creep and fatigue behavior.
Stress versus time plots of samples under cyclic and stress relaxation tests.
E. Hysteresis
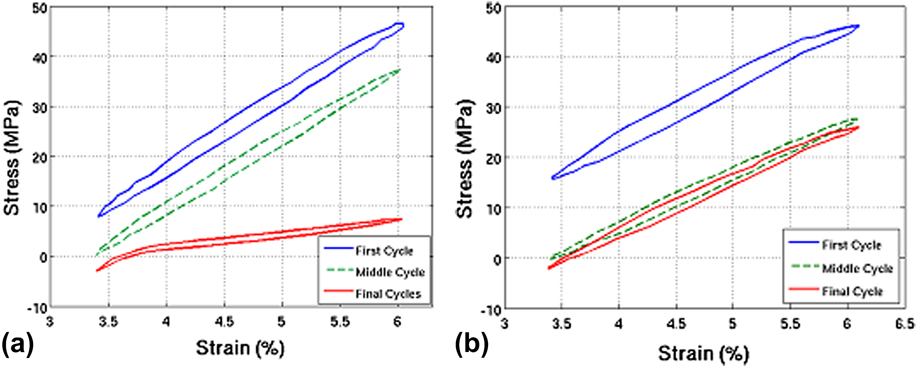
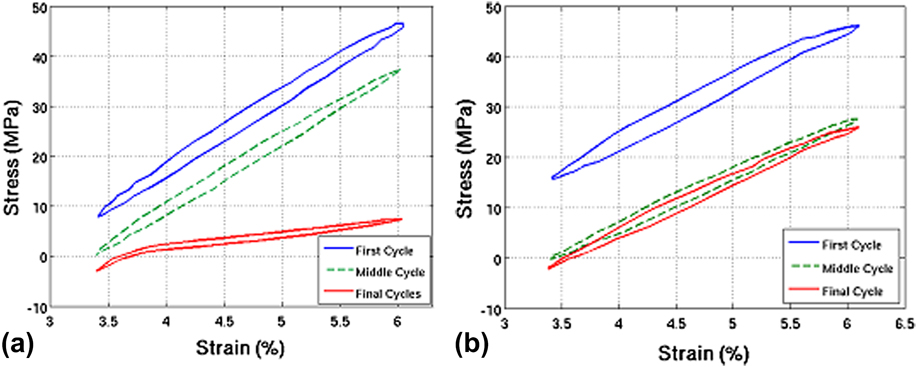
The initiation and subsequent evolution of the fatigue damage in a specimen can be identified when inspecting the hysteresis curves at different number of cycles and loading conditions. Figure 7 shows the hysteresis behavior of two different specimens (sample 1 and sample 3) during their cyclic life time. One of the specimens has broken but the other one remained unbroken. The hysteresis loops drop up to a certain number of cycles. After that a change of slope is observed in their tension part while the compression part remains unchanged. Looking closer at the force versus time plot in final cycles in Fig. 3 this is when the distance between minimum and maximum force peaks start to decrease. This effect is attributed to the production and growth of crazes after some induction period and demonstrates brittle crack propagation in the sample. Reference Suresh21 This can be distinguished from Fig. 7(b) where all the loops have the same slope up to the point the specimen has been removed.
Hysteresis loops of different specimens under the same test conditions (a) broken and (b) removed.
Micrographs of the fracture surface of one of the broken samples are provided in Fig. 8. A brittle fracture surface with no sign of necking or deformation in the loading direction can be observed in Fig. 8(a). Figure 8(b) provides a closer look at the fracture surface exhibiting transgranular nature of the brittle fracture. Curled broken fibrils due to crazing can be observed in Figs. 8(c) and 8(d). Reference Michler22
Micrographs of the fracture surface of a cyclic test specimen a) fracture surface showing brittle fracture, b) higher magnification shows the trasngranular nature of the fracture, c,d) curled drawn out fibrils due to crazing.

VI. CONCLUSIONS
Mechanical behavior of laser-sintered Nylon-12 parts was investigated under static and dynamic loading conditions. Viscoelastic behavior of the material was determined by DMTA tests and based on the graphs, as the frequency of the test increases, the T g increases which is due to molecular relaxations at higher temperatures. Dynamic tests were performed to investigate the performance of the test parts subject to tension–tension cyclic loading. The LS samples tested appeared to creep during the tension–tension test and experience compression, introducing creep and fatigue as two main causes of failure, therefore a pure cyclic tensile test was not achieved. Similar test samples showed different behaviors in the same cyclic testing conditions and no relationship was observed between their fatigue performance from their physical properties (density, surface roughness), further studies on the microstructure of the samples prior to testing is required to verify whether this is caused by defects from manufacturing. Study of the hysteresis loops led to identifying crazing and brittle crack propagation in the broken samples.