INTRODUCTION
The honey bee (Apis mellifera) is the most important pollinator of food crops and is essential for biodiversity. Globally, the total economic value of the worldwide pollination service that is mainly provided by honey bees amounted to $210 billion (€153 billion) in 2005, which is about 9·5% of the value of the world agricultural production for human consumption (Gallai et al. Reference Gallai, Salles, Settele and Vaissière2009). Nevertheless, populations of honey bees have steadily declined in recent decades, posing a serious threat to global food supply and our future (Potts et al. Reference Potts, Biesmeijer, Kremen, Neumann and Schweiger2010). The problem of bee losses escalated over the winter of 2006–2007 when colony collapse disorder, a mysterious malady characterized by mass disappearances and die-offs of honey bees, but not the queen and brood, wiped out tens of thousands of hives of bees across North America (Cox-Foster et al. Reference Cox-Foster, Conlan, Holmes, Palacios and Evans2007; vanEngelsdorp et al. Reference Van Engelsdorp, Underwood, Caron and Hayes2007). Since then, there has been more than 30% of honey bee colony losses reported each year (vanEngelsdorp et al. Reference Van Engelsdorp, Hayes, Underwood, Pettis and Gay2008, Reference Van Engelsdorp, Hayes, Underwood and Pettis2010, Reference Van Engelsdorp, Hayes, Underwood, Caron and Pettis2011, Reference Van Engelsdorp, Caron, Hayes, Underwood, Henson, Spleen, Andree, Snyder, Lee, Roccasecca, Wilson, Wilkes, Lengerich and Pettis2012; Pirk et al. Reference Pirk, Human, Crewe and vanEngelsdorp2014).
There are many proposed causes for honey bee losses, including pathogens, pests, pesticides, malnutrition, migratory beekeeping or a combination of these factors (Higes et al. Reference Higes, Martin-Hernandez, Botias, Bailon and Gonzalez-Porto2008; vanEngelsdorp et al. Reference Van Engelsdorp, Evans, Saegerman, Mullin and Haubruge2009; Carreck and Martin, Reference Carreck, Ball and Martin2010; Genersch, Reference Genersch2010; vanEngelsdorp and Meixner, Reference Van Engelsdorp and Meixner2010; Becher et al. Reference Becher, Osborne, Thorbek, Kennedy and Grimm2013; Smith et al. Reference Smith, Loh, Rostal, Zambrana-Torrelio and Mendiola2013; Human et al. Reference Human, Archer, du Rand, Pirk and Nicolson2014). Of the factors that negatively impact survivorship and longevity of honey bees, parasitic mites Varroa destructor (Anderson and Trueman, Reference Anderson and Trueman2000), remains the single most detrimental pest of honey bees with the most pronounced economic impact on the beekeeping industry worldwide (Guzman et al. Reference Guzmán-Novoa, Calvete, Mcgowan, Kelly and Correa-Benítez2009; Martin et al. Reference Martin, Highfield, Brettell, Villalobos and Budge2012).
The Varroa mite has been catastrophic for the world's beekeeping industry (Rosenkranz et al. Reference Rosenkranz, Aumeier and Ziegelmann2010) since its transmission from the original host, the Asian honey bee Apis cerana, to the Western honey bee, A. mellifera sometime in the early 1900s (Rosenkranz et al. Reference Rosenkranz, Aumeier and Ziegelmann2010; vanEngelsdorp et al. Reference Van Engelsdorp, Hayes, Underwood and Pettis2010). The entire life cycle of the mites is spent with honey bees. Both adult mites and nymphs use their piercing mouth-parts to penetrate the body wall of the bees to suck out the haemolymph. The repeated feeding results in a decline in colony vigour, compromised host immunity, shortened lifespan of the honey bees, and eventual death of the colonies within a few years if left untreated (DeJong et al. Reference DeJong, DeJong and Goncalves1982; Weinberg and Madel, 1985; Weinberg, Reference Weinberg1985; Kovac and Crailsheim, Reference Kovac and Crailsheim1988; Korpela et al. Reference Korpela, Aarhus, Fries and Hansen1992; Yang and Cox-Foster, Reference Yang and Cox-Foster2005). In addition to its direct impact on host health, the Varroa mite is also implicated as being a serious and deadly vector for transmitting viruses and bacteria in honey bee colonies (reviewed in de Miranda et al. Reference de Miranda, Chen, Ribière, Gauthier and Carreck2011). Viral infections in honey bee colonies have often been reported to be involved in the collapse of bee colonies infested with V. destructor (de Miranda et al. Reference de Miranda, Chen, Ribière, Gauthier and Carreck2011). This association of Varroa infestation with viral disease caused by deformed wing virus (DWV) has been reported to be responsible for the deaths of millions of colonies worldwide, wherever Varroa and DWV co-occur (Martin et al. Reference Martin, Highfield, Brettell, Villalobos and Budge2012). This poses an especially serious threat to honey bee health. Therefore, there is an urgent need for research to identify the genetic stocks that are resistant to Varroa mites and other diseases and to incorporate the resistance into overall bee populations in order to promote bee health, especially for the Chinese black honeybee.
The Chinese black bee is believed to be an ecological variety formed by the natural selection of Apis mellifera carnica and A. m. mellifera (Peng et al. Reference Peng, Luo, An, Huang and Guo2009) and was introduced into China between 1925 and 1926. Right now the Chinese black bee is only found in China's Northwestern Xinjiang Province, Northeastern Heilongjiang Province and Jilin Province, thereby naming them the Xinjiang black bees and Northeastern black bees. Compared with other A. mellifera subspecies, Chinese black honeybees are characterized by their large body size, resistance to disease, adaptability to cool, high-elevation ecological zones, tendency to fly at lower temperatures and ability to forage utilizing sporadic nectar sources (Peng et al. Reference Peng, Luo, Chun, Dong and Zhen2012). It has been reported that Chinese black honeybees could overwinter safely at temperatures as low as −32 to 35 °C which would be lethal to most of A. mellifera. They can also fly in temperatures about 8 °C when most bees stop foraging for nectar and pollen (Peng et al. Reference Peng, Luo, An, Huang and Guo2009). Over the years, Chinese black honeybees have naturalized and adapted to the regional climate conditions and floral resources and have been the predominant pollinators in Xinjiang and other northeastern provinces of China, resulting in their high economic and scientific research value (Klee et al. Reference Klee, Besana, Genersch, Gisder and Nanetti2007).
In order to better understand the evolutionary genetics and the unique selective advantages of Chinese black honey bees, we conducted a study to investigate the genetic relationship of Chinese black honeybees from different geographic locations and the pest/pathogen profile of Chinese black honey bees in different regions of the Xinjiang, Jilin and Heilongjiang Provinces in comparison with A. m. ligustica collected in bee colonies maintained in an apiary of the Beijing Apicultural Research Institute, Chinese Academy of Agricultural Science (CAAS).
MATERIALS AND METHODS
Ethics statement
Studies involved the Chinese black honey bee which is a protected species. Specific permissions were obtained from the Chinese ministry of environmental protection and the agricultural halls of Xinjiang, Heilongjiang and Jilin Provinces for the described field studies sponsored by Chinese National Natural Science Foundation (No. 31372383).
Sample collection
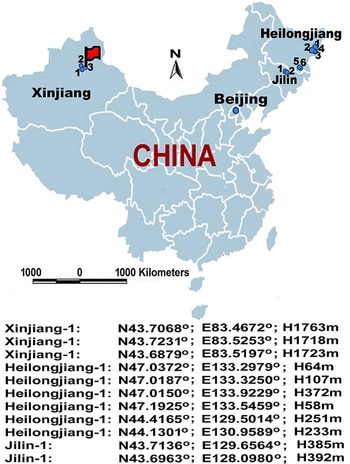
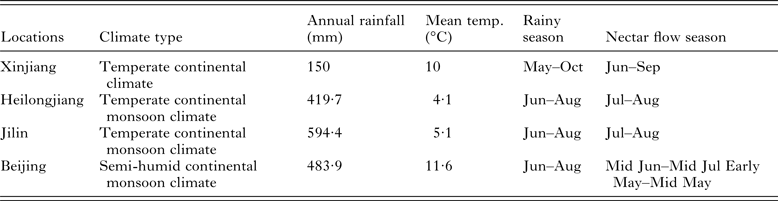
Chinese black honeybee samples were collected from major black honeybee conservational areas in the Xinjiang, Heilongjiang and Jilin Provinces between June and July in 2014. Honey bee samples (A. m. ligustica) maintained in an apiary of the Institute of Apicultural Research, CAAS, Beijing were also collected serving as a control group in the present study. The climate conditions and nectar flow season of major honey plants at locations of Xinjiang, Heilongjiang, Jilin Provinces and Beijing from which bee samples were collected are included in Table 1. Three apiary sites were selected in the Xinjiang Province and designated as Xinjiang-1, Xinjiang-2 and Xinjiang-3. Six apiary sites were selected in the Heilongjiang Province and designated as Heilongjiang-1, Heilongjiang-2, Heilongjiang-3, Heilongjiang-4, Heilongjiang-5 and Heilongjiang-6. Two apiary sites were selected in the Jilin Province and designated as Jilin-1 and Jilin-2. The longitude, latitude and altitude of each location were measured using Hand-held GPS (GARMIN eTrex Vista HCx, China) (Fig. 1). There were about 90% of strong colonies (seven to eight frames covered) that we monitored colonies in each apiary. The colonies were managed in standard ten frame Dadant hives. Only strong colonies with seven to eight frames covered with bees were selected to be included in the experiment. Three colonies at each apiary were used for sample collection and 20 adult workers were collected from each colony. A total of 720 worker samples were collected for further study. Half of the samples were used for the isolation of DNA and the examination of Coxidase I (COI) gene and gut parasites Nosema apis and Nosema ceranae. The remaining samples were used for RNA isolation and viral RNA testing.
A map of China showing the sampling location of the study. Chinese black bees were collected from multiple locations in Xinjiang, Heilongjiang and Jilin Provinces. Italian honey bees (Apis mellifera ligustica) were collected from an apiary in Beijing. Multiple locations from each province were designated with numbers and marked on the map. The geographic coordinates and elevation of each location defined by a GPS are listed below the map. One location in Xinjiang Province with pure breeding population of A. m. mellifera is marked by a flag.

Climate conditions and nectar flow season of the major honey plants at the locations from which bee samples were collected

RNA isolation and RT–PCR amplification
Total RNA was extracted from individual honey bees with the method described previously (Li et al. Reference Li, Qin, Wu, Sadd, Wang, Peng, Wu and Chen2012). RNA from a total of 360 bee samples was extracted using the TRIzol reagent (Invitrogen) and by following the manufacturer's instructions. All RNA samples were tested for the presence of common bee viruses, including Acute bee paralysis virus, Black queen cell virus (BQCV), Chronic bee paralysis virus, DWV, Kashmir bee virus, Israeli acute paralysis virus (IAPV) and Sacbrood virus. The prevalence of each pathogen was calculated based on the number of virus-positive samples at the time point of our investigation by the number of bees examined.
The primers used in the assays were the same as reported previously (Li et al. Reference Li, Qin, Wu, Sadd, Wang, Peng, Wu and Chen2012). The specific viral RNA was amplified using the Access RT–PCR kit (Promega, Madison, WI) according to the manufacturer's instructions. The reaction mixture contained: 1× AMV/Tfl reaction buffer, 0·2 mm each deoxynucleoside triphosphate (dNTP), 1 µ m of sense primer, 1 µ m of antisense primer, 2 mm MgSO4, 0·1 unit AMV reverse transcriptase, 0·1 unit Tfl DNA polymerase and 500 ng total RNA in a total volume of 25 µL. Amplification was undertaken with the following thermal cycling profiles: one cycle at 48 °C for 45 min for reverse transcription; one cycle of 95 °C for 2 min; 40 cycles at 95 °C for 30 s, 55 °C for 1 min and 68 °C for 2 min; and one cycle of 68 °C for 7 min. Negative (water) and positive controls (recombinant plasmid DNA with virus insert into PCR 2·1 vector) were included in each run of the RT–PCR reaction. PCR products were electrophoresed in 1% agarose gel containing GoldView (GV) and were visualized under UV light. PCR amplicons were sequenced to ensure their specificity.
DNA isolation and PCR amplification
The remaining 360 bee samples were used for DNA isolation. The abdomen of individual bees was removed with scissors and individually homogenized in 100 µL of Krebs Ringer solution with a sterile pestle. Total genomic DNA was extracted from 50 µL from the homogenate of the single bee abdomen using a DNA purification kit (Wizard® SV 96 Genomic DNA Purification System (Promega) as described previously (Li et al. Reference Li, Qin, Wu, Sadd, Wang, Peng, Wu and Chen2012). DNA samples were stored at −20 °C prior to molecular screening for parasites.
DNA samples also were used to amplify the intergenic transfer RNA (tRNA) leu-cytochrome Coxidase II (COII) region of mitochondrial DNA (mtDNA) to genetically classify the bee population in the present study following the method described in the The COLOSS BEEBOOK, standard methodologies for molecular research in A. mellifera (Evans et al. Reference Evans, Schwarz, Chen, Budge, Cornman, De la Rua and de Miranda2013). The extracted DNA was also used to determine the presence and the species specificity of microsporidia parasites, N. apis and N. Ceranae. Primers reported previously for amplifying the COI–COII intergenic region were employed in this study (Garnery et al. Reference Garnery, Solignac, Celebrano and Cornuet1993). The primers used for amplifying N. apis and N. ceranae were the same as described previously (Li et al. Reference Li, Qin, Wu, Sadd, Wang, Peng, Wu and Chen2012). PCR amplifications were performed using a Mastercycler 5333 (Eppendorf) in 25 µL volumes containing 500 ng of template DNA, 2·5 µL of 10 × PCR buffer, 2·0 µL of dNTPs (200 µ m), 0·25 µL of Ex Taqpolymerase (TaKaRa, Co. Ltd.) and 1 µL of each forward and reverse primers (10 µ m), plus 13·65 µL of water. Amplification was undertaken with the following thermal cycling profiles: initial DNA denaturation step of 4 min at 94 °C followed by 40 cycles of 30 s at 94 °C, 30 s at 56 °C and 60 s at 72 °C, and terminated with a final extension step of 72 °C for 10 min. For each run of the PCR reaction, negative (water) and positive (previously identified positive sample) controls were run along with DNA extracts of samples. PCR products were electrophoresed in a 1·2% agarose gels containing 0·5 µg mL−1 GV and PCR-amplified bands were purified and sequenced to verify their identities. Obtained DNA sequences were used for phylogenetic analysis.
Investigation of parasitic mite infestation
The level of mite populations within colonies was investigated by measuring numbers of mite fall within 24 h (Branco et al. Reference Branco, Kidd and Pickard2006). Three apiary sites in the Xinjiang Province (Xinjiang 1, 2 and 3), three apiary sites in the Heilongjiang Province (Heilongjiang 1, 2 and 3), two apiary sites in the Jilin Province (Jilin 1 and 2) and one apiary site in Beijing were selected for examination and comparison of parasitic mite infestation. Sixty colonies including colonies used for pathogen screening were used at each apiary. Only bee colonies with seven to eight frames that were covered by adult bees were selected for the assessment. All of the queens from these colonies were laying eggs normally. For each colony, a piece of white construction paper was inserted under a screened bottom board (1/8 inch wire mesh) which prevented the bees from reaching the paper beneath the bottom floor of a hive. The white construction paper utilized a grid to facilitate the counting process and had a sticky surface coated by Vase line to entrap the fallen mites. To avoid the accumulation of debris, which might make mite counting difficult, the sticky board was left in each hive for 24 h. After 24 h, the paper was removed and the total number of mites on the adhesive surface was counted. The sticky-board sampling was expedited with the use of an acaricides (Apistanstrips). The average mite count of each apiary from sixty bee hives was calculated (mean ± s.d.). The time period of the last parasitic mite treatment of every apiary was documented based on answers provided by beekeepers.
Further, the information of Varroa infestation of Chinese black honeybees in Xinjiang 1 and 2 as well as the Varroa infestation in Varroa-susceptible A. m. ligustica colonies (control) from a different location in Xinjiang from June 2012 to June 2014 were obtained from local apiary inspectors. Thirty bee colonies from each apiary location were monitored for mite infestation by counting natural mite dropping and using a screened bottom board as described above. The number of the mites falling down on the bottom board within a week was counted three times per week and added together. The monthly Varroa mite infestation at each location was calculated based on the average number of dropping mites of 30 colonies per week (mean ± s.d.). All the bee colonies were applied the same approaches for monitoring and treating Varroa mite populations by the same apiary inspectors.
Detection and assessment of Varroa mite infestation and DWV infection
The absence of Varroa infestation in an apiary in the Xinjiang 3 Province prompted the further investigation of the correlation between the level of Varroa infestation and DWV titre in bee colonies. We randomly selected six colonies separately from Beijing, Xinjiang-1 and -3, and then screened the DWV infection of each colony using the above method. Only colonies infected DWV were used for further examination. So, two bee colonies from Beijing, three colonies from Xinjiang-1 and four colonies from Xinjiang-3 were selected for this study.
The adult infestation rate of each colony was estimated by the method described in the Standard methods for Varroa research (Dietemann et al. Reference Dietemann, Nazzi, Martin, Anderson, Locke, Delaplane, Wauquiez, Tannahill, Frey, Ziegelmann, Rosenkranz and Ellis2013). Briefly, approximately 300 worker bees (a rectangular graduated container in which 300 bees fit) were collected from a brood frame and dumped into a sugar-roll jar. Three table spoons of powdered sugar were added into the jar and the mesh lid was screwed tightly on the jar. The mites were dislodged from bees by inverting and shaking the jar over the surface of a plastic tub half-filled with water for 1 m and counted. The sugar-coated bees were returned back to the colony. The Varroa mite infestation of a bee colony was determined by converting mites per 300 bees to per cent infestation and using the formula: % Varroa Infestation = [No. of mites/300 bees] × 100.
SYBR Green real-time quantitative Reverse Transcription Polymerase Chain Reaction PCR (qRT–PCR) was used to determine the titre of DWV in infected bees. Fifteen bees from each colony were quantified for DWV concentration. The specific DWV primers and the β-actin control primer were followed the previous study (Chen et al. Reference Chen, Higgins and Feldlaufer2004). The thermal profile parameters consisted of one cycle at 95 °C for 3 min followed by 35 cycles of 95 °C for 30 s, 55 °C for 1 min and 72 °C for 30 s. A negative control (no template) was included in each run of the reaction. The positive control was purposely not included in the reaction in order to avoid any potential chances of contamination. After amplification, a melting curve analysis was performed to determine the specificity of the PCR products. The PCR products were incubated for 1 min at 95 °C, ramping down to 55 °C at a rate of 0·2 °C s−1. The dissociation curve was constructed using 81 complete cycles of incubation where the temperature was increased by 0·5 °C per cycle, beginning at 55 °C and ending at 95 °C. qRT–PCR was replicated three times for each sample to address the variability of the analysis process. The equal amplification efficacy of DWV and β-actin primers was confirmed in the pilot study. The values obtained from each colony DWV infection and actin were averaged individually, and the data are represented as means ± s.e. The comparison of the relative amount of DWV level between colonies infected was conducted using the comparative Ct method (2-▵▵Ct Method). The result of DWV concentration of each colony was expressed as the fold difference in relation to the bee colony that had the lowest titre of DWV infection.
Phylogenetic analysis
The 576 bp sequences of mtDNA tRNAleu-COI region and 720 bp sequences of RNA-dependent RNA polymerase (RdRp) of DWV were used for phylogenetic analysis. The sequence data were aligned by ClustalX using default settings (Thompson et al. Reference Thompson, Gibson, Plewniak, Jeanmougin and Higgins1997) and visually checked using BioEdit (Hall, Reference Hall1999), followed by a BLAST database search to test sequence similarities (Altschul et al. Reference Altschul, Gish and Miller1990). The evolutionary history was inferred using the Neighbour-Joining method (Saitou and Nei, Reference Saitou and Nei1987). The evolutionary distances were computed using the Maximum Composite Likelihood method (Tamura et al. Reference Tamura, Nei and Kumar2004) and are in the units of the number of base substitutions per site Maximum Parsimony under a heuristic search was used to construct the phylogenetic relationship. Evolutionary analyses were conducted in MEGA6 (Tamura et al. Reference Tamura, Stecher, Peterson, Filipski and Kumar2013). Phylogenies were assessed by the bootstrap replication (N = 500 replicates). Numbers at nodes correspond to bootstrap values and bootstrap values of >50% were regarded as providing evidence for the phylogenetic grouping.
Statistical analysis
Statistical analyses were carried out in SPSS 17.0 (SPSS Inc., Chicago, IL). The prevalence of viruses and microsporidian parasite Nosema in each province was verified using Chi-square (χ 2) test. The one-way ANOVA was used to compare the statistical difference in Varroa infestation monitored by sticky-board among different apiaries. The degree of correlation between the level of Varroa infestation and titre of DWV infection with in bee colonies was measured by a correlation coefficient using a Pearson's correlation.
RESULTS
Genetic variation of Chinese black honeybees
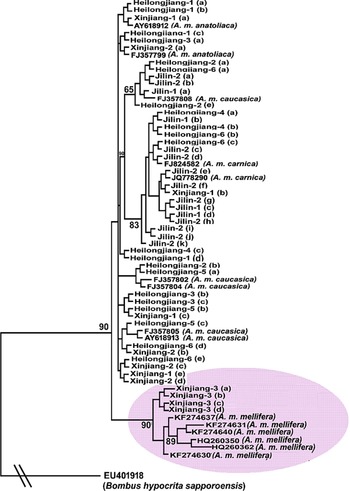
A total of 360 black bee samples from 11 locations in the Xinjiang, Jilin and Heilongjiang Provinces have been analysed using mtDNA tRNAleu-COI region amplified by PCR. The phylogenetic tree showed that the black bee populations were separated into two distinct groups. A group of black bees collected from a geographically isolated location in Xinyuan County, Yili, Xinjiang Province occupied the most basal position in the tree and formed a distinct clade together with sequences of A. m. mellifera retrieved from GenBank. This clade was supported by bootstrap analysis at a high confidence level, indicating a robust phylogenetic relationship. Within other branches, the black honey bees from the other ten locations in the Xinjiang, Jilin and Heilongjiang Provinces group did not appear to originate from a common ancestor and were grouped together with populations of A. m. canica, A. m. anatoliaca and A. m. caucasica in different sub-branches that were genetically divergent from A. m. mellifera. However, within the same branch, the bees collected from the Jilin Province were not grouped together with A. m. anatoliaca in sub-branches, as with bees from Xinjiang and Heilongjiang (Fig. 2).
Phylogenetic relationship of Chinese black honeybees. A phylogenetic tree showing the genetic relationship of Chinese black bees collected from different locations in Xinjiang, Heilongjiang and Jilin Provinces along with sequences of subspecies of honey bees Apis mellifera mellifera, A. m. canica, A. m. anatoliaca and A. m. caucasica retrieved from GenBank. The sequences of mitochondrial DNA (mtDNA) tRNAleu-COI region were used for phylogenetic analysis. The sequence of a bumblebee species, Bombus hypocrite sapporoensis, was used as an outgroup to root the tree. The phylogenetic tree was built using the Maximum Parsimony method. Chinese black honeybees form two distinct groups. One group of bees that were most similar to A. m. mellifera formed a distinct clade as shown by a shaded ellipse. The other clade of the tree was made of bees that were closely related to subspecies, A. m. carnica, A. m. anatolica and A. m. caucasica. Numbers at each node represent bootstrap values as percentages of 500 and only bootstrap values >50% are shown.

Pathogen profiles in examined Chinese black honeybees
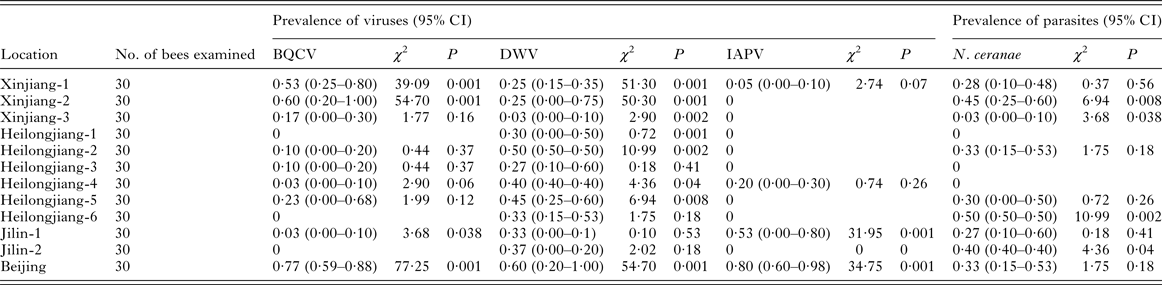
Of the seven viruses, only BQCV, DWV and IAPV were detected in the worker bees. Of the two Nosema species examined, only N. ceranae was detected. Compared with bee samples of Italian honey bees maintained in Beijing, Chinese black honeybees displayed lower levels of the virus infection. The infection rates of BQCV and DWV were significantly lower in Chinese black honeybees from three provinces than in Italian honey bees. The infection of IAPV was sparse in Chinese black honeybees and significantly lower than that in Italian honey bees. However, Chinese black honeybees did not appear to have lower levels of the microsporidia parasite Nosema infection. In fact, the highest and second highest rates of Nosema infections were found in bee hives kept in Heilongjiang-6 and Xinjiang-2, respectively (Table 2).
The prevalence of parasites and pathogens in black honey bees from Xinjiang, Heilongjiang and Jilin Provinces in comparison with Italian honey bees from Beijing, China

Note: The prevalence of viruses and microsporidian parasite Nosema in each province was compared with the total prevalence of that in all provinces and verified using Chi-square test statistical analyses was carried out in SPSS 17·0 (SPSS Inc., Chicago, IL).
The levels of parasitic mite infestation
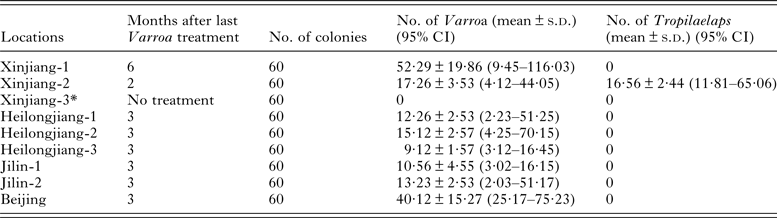
Of the 60 bee colonies with the similar population size, the investigation of parasitic mite infestation showed that the level of mite infestation varied between Chinese black honeybees and Italian honey bees A. m. ligustica. There was significantly statistical difference (P < 0·01) in the level of Varroa infestation between any of Chinese black honeybee hives maintained in the National Nature Reserves in the Xinjiang, Heilongjiang and Jilin Provinces and the bee hives of subspecies A. m. ligustica maintained in Beijing when time period (3 month) for the last treatment for Varroa was about the same for the colonies. Bee hives that were maintained in one apiary of the Xinjiang Province (Xinjiang-1) did not treat for mites in the past 6 months had the highest count of Varroa mites on the sticky board. The infestation of Tropilaelaps was detected in one apiary in Xinjiang-2 but not in any other of the inspected apiaries (Table 3).
The infestation of exotic parasitic mites, Varroa destructor and Tropilaelaps

Note: The asterisks indicate significant statistical differences by using Mann–Whitney test, P < 0.01.
One striking finding from this study was the observation of a particular group of the black honey bees from the apiary in Xinjiang 3, which were exclusively clustered together with A. m. mellifera (GenBank KF274637) in the phylogenetic tree. The tactics that the beekeeper had performed over a decade for keeping pure breeding black bee populations include strictly geographic and reproductive isolation to prevent hybridization with any other subspecies and selective breeding of local bees. In 2013, a heavy Varroa mite infestation in Xinyuan County led to the losses of 85% of honey bee colonies in this region. As a result, in autumn 2013 and spring 2014, led by the local government, two large-scale applications of controlling Varroa mites with chemical pesticides were conducted. The beekeeper who owns this apiary in the location of Xinjiang-3 claimed he had never had a problem with the mites of any kind and had never treated his hives for Varroa mites or other pests over the past decade. The routine apiary inspection by local government did not identify a case of Varroa infestation in this apiary in the past. In agreement with results of local apiary inspectors, our inspection of adult workers by sticking board and drone brood by opening capped cells of ten bee colonies in this geographic zone did not detect any Varroa mite infestation.
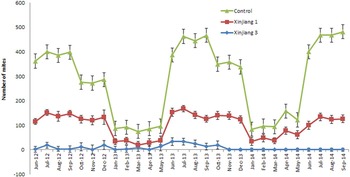
The comparison of Varroa infestation between Chinese black bees colonies and A. m. ligustica colonies over a 25-month period based on the information provided by local apiary inspectors showed that the number of mite dropping in Chinese black honeybee colonies was significantly lower than in A. m. ligustica colonies (P = 0·0001) through the entire observational period. Each year, the peak differences were observed between July and September. For both Chinese black honeybee and A. m. ligustica colonies, the level of Varroa infestation was relatively lower in months from January to May than in months from June to December (Fig. 3). Our study suggests that A. m. mellifera has an advantage over other subspecies for better resistance against Varroa mites.
Observation of the Varroa mite infestation in Chinese black bee and Italian bee (Apis mellifera ligustica) colonies. The comparison of Varroa infestation between Chinese black bees (Xinjiang 1 and 3) and Italian bee colonies (control) over a 25-month period (June 2012–June 2014) showed that the number of mites dropping on a screened bottom board in Chinese black bee colonies was statistically lower than in Italian bee colonies through the entire observational period. The Y-axis indicates the number of mites collected per month on the bottom board (mean ± s.e.), and the asterisks indicate significant statistical differences using the Mann–Whitney test, P < 0·01.

The correlation between the level of Varroa mite infestation and titre of DWV infection in bees
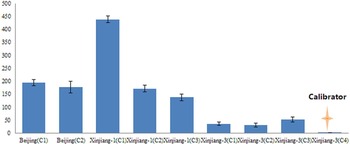
There was a strong positive correlation between the level of Varroa mite infestation and the level of DWV concentration in infected colonies (Pearson: r = 0·881, P = 0·002) (Fig. 4). One bee colony from Xinjiang-3 had the lowest of DWV titre and therefore was used as a calibrator. The DWV titres of bee colonies from Beijing were 177·53–194·53-fold (average 186-fold) higher than that in the bee colony from Xinjiang-3. The DWV titres of bee colonies from Xinjiang-1 were 137·56–438·41-fold (average 249-fold) higher than that in the calibrator. While no Varroa was detected in any examined bee hives maintained in Xinjiang-3, which never treated for Varroa mites, the percentage of Varroa infestation in bee hives kept in Xinjiang-1 ranged from 1 to 75% and the percentage of Varroa infestation in the bee hives kept in Beijing which had no pesticide treatment in the past 3 months, ranged from 17 to 33%.
The relative concentration of deformed wing virus (DWV) infection. A study was conducted to investigate DWV infection in three groups of honey bees from three locations, Xinjiang 1, Xinjiang 3 and Beijing which represent populations of mixed breeding of black honey bees, pure breeding of black honey bees, and Italian honey bees, respectively. The bars indicate the relative concentration of DWV titre which was quantified by RT–PCR and analysed by the comparative Ct method. The bee colony (C-4) from Xinjiang 3 had the lowest level of DWV infection and therefore was chosen as a calibrator. The concentration of other bee colonies was compared with the calibrator and expressed as n-fold difference.

Phylogenetic relationship of DWV
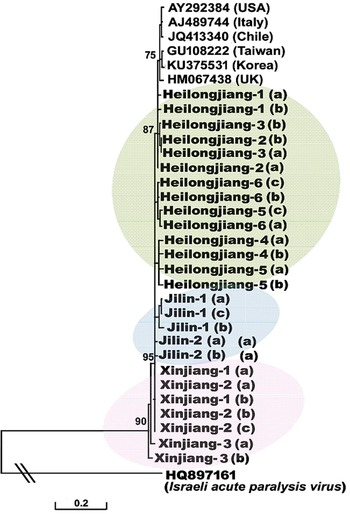
A phylogenetic tree to illustrate the genetic relationship of DWV isolates from black honey bees and the viral sequences retrieved GenBank showed geographically associated clustering. Viral isolates from the hosts that reside in the same geographic region tend to cluster together in the phylogenetic tree, suggesting that the clustering of DWV was affected by host population and reflects coevolution of the pathogen and its hosts (Fig. 5).
A phylogenetic tree showing the relationship of DWV isolates. The partial sequences of RNA-dependent RNA polymerase (RdRp) of DWV from black honey bees collected from different geographic locations of China and from Apis mellifera retrieved from GenBank were aligned using ClustalW. The tree was built using the Neighbour-Joining method. The tree is drawn to scale, with branch lengths measured in the number of substitutions per sites. The sequence of IAPV was used as an outgroup to root the tree. Numbers at each node represent bootstrap values as percentages of 500 and only bootstrap values >50% are shown.

DISCUSSION
Honey bee populations are continuing to dwindle around the world, threatening global food security and reducing biodiversity resources. A large body of research searching for cause(s) of colony losses has been conducted and has shed much light on the bee crisis. While a myriad of abiotic and biotic factors ranging from pesticides and malnutrition to infectious diseases have been reported to adversely affect the bee health, no single factor could be pinned as the ‘cause’ of the colony losses. An effective solution to combat the steep bee decline has not yet been identified.
Much recent research and actions worldwide are now devoted to identifying bees with disease-resistant traits and to breed disease-resistance to promote bee health. The selective breeding of resistant stock, especially bees resistant to the parasitic mite Varroa, arguably the single greatest threat to honey bees, is likely to be the best long-term solution to the bee disease problems. The trait-based approaches have been successfully used in breeding programmes for bee disease resistance. For example, hygienic behaviour, a heritable trait of individual workers that confers colony-level resistance against various brood diseases by quickly uncapping and removing dead or diseased brood from cells, has been actively used in selective breeding programmes (Spivak, Reference Spivak1996; Oxley et al. Reference Oxley, Spivak and Oldroyd2010). Another behaviour trait of honey bees, Varroa Sensitive Hygiene, in which bees detect and remove bee pupae that are infested by the Varroa has been selected for breeding effective mite resistance (Harbo and Harris, Reference Harbo and Harris1999, Reference Harbo and Harris2009). The grooming behaviour, a trait that involves removing and injuring mites from themselves or another bee has also been used for selection in breeding programmes (Arechavaleta-Velasco et al. Reference Arechavaleta-Velasco, Alcala-Escamilla, Robles-Rios, Tsuruda and Hunt2012). In the present study, the Chinese black honey bee populations that are distributed in Heilongjiang, Jilin and Xinjiang Provinces of China and well adapted to the local climatic conditions appeared to be cold tolerant and displayed a low prevalence of Varroa infestation, compared with Italian bees. In addition, the relatively low infections of DWV and IAPV in Black honey bees than in to Italian bees reflects the low incidence and prevalence of Varroa. Varroa mite has been experimentally proven to be an effective vector of the viruses (Bowen-Walker et al. Reference Bowen-Walker, Martin and Gunn1999; Shen et al. Reference Shen, Yang, Cox-Foster and Cui2005; Di Prisco et al. Reference Di Prisco, Pennacchio, Caprio, Boncristiani and Evans2011) and has been demonstrated to cause the frequency of DWV to increase from 10 to 100% (Martin et al. Reference Martin, Highfield, Brettell, Villalobos and Budge2012). The results of this study suggest a need for further exploration of the genetic mechanisms responsible for observed low prevalence of Varroa infestation in Chinese black honey bees and for the evaluation of unique resources for selection breeding on mite resistance. So, we could explicate that Chinese black honeybees including their hybridization have a stronger ability to resistant honeybee viruses than Italian honey bees, especially to resistant DWV. The observation of high level of Nosema infection suggests that the Chinese black bee does not possess a resistance to the Nosema infection.
The Xinjiang black bees and the Northeastern black bees have different genetic lineages. The Xinjiang black bee is an ecological strain of A. m. mellifera introduced from Europe. The Northeastern black bee was introduced to China from Siberia and was the hybrid descendant of the original Caucasian bee (A. m. caucasica) and Carniolan honey bee (A. m. carnica) which are classified into Carnica lineage (C group) and Oriental lineage (O group) (Ruttner, 1988), respectively. Phylogenetic analysis based on their mtDNA sequence data indicated that Chinese black bees were genetically divergent and are hybrids of A. m. carnica, A. m. anatolica and A. m. caucasica, indicating the original populations of Northeastern black bees could be influenced by hybridization with introduced subspecies A. m. anatolica. The observed genetic variation in populations of black bees from Xinjiang Province indicated that populations of A. m. mellifera have been significantly affected by gene flow from other subspecies of honeybees due to human activities and have lost their identity over the years. The identification of a geographically isolated population of A. m. mellifera at one specific apiary (Xinjiang 3) indicated that A. m. mellifera populations still existed in China and demonstrated a successful preservation of genetic integrity of pure breeding bee population. The exceptional high degree of resistance to cold weather, Varroa mites infestation and DWV infection observed in this population suggest A. m. mellifera offers valuable genetic resources for combating bee losses. The effective policies and restoration programmes have become urgent for the conservation of black honey bee A. m. mellifera in China.
ACKNOWLEDGEMENTS
We would like to thank Mr.Liu, and Liu Shan for collecting honey bee samples; Jiandong An, Guo Jun and Jiaxing Huang for laboratory assistance. The data were deposited in GenBank under accession number KR133202-KR133274.
FINANCIAL SUPPORT
This work was funded by The Agricultural Science and Technology Innovation Programme (W.J.P., grant no. CAAS-ASTIP-2015-IAR), Chinese National Natural Science Foundation (W.J.P., grant no. 31372383) and China Agriculture Research System (W.J.P., grant no. CARS-45) (Z.J.Z., grant no. 201203080-4).