I. INTRODUCTION
Nanocrystalline materials have been a focus of research in the last decades due to their exceptional properties, Reference Gleiter1,Reference Dao, Lu, Asaro, De Hosson and Ma2 being also intrinsically different from the corresponding coarse-grained materials. Reference Kuru, Wohlschloegel, Welzel and Mittemeijer3,Reference Rane, Welzel, Meka and Mittemeijer4 Nanocrystalline Ni–W films were produced successfully by electrodeposition and were found to exhibit outstanding mechanical properties and corrosion resistance. Reference Jones, Hamann, Lund and Schuh5–Reference Chianpairot, Lothongkum, Schuh and Boonyongmaneerat8 In recent years, magnetron-sputtered Ni–W films were investigated, Reference Borgia, Scharowsky, Furrer, Solenthaler and Spolenak9–Reference Kurz, Ensslen, Welzel, Leineweber and Mittemeijer12 focusing on the microstructure of these films. The presence of a high density of nanotwins was revealed. Reference Welzel, Kuemmel, Bischoff, Kurz and Mittemeijer11,Reference Kurz, Ensslen, Welzel, Leineweber and Mittemeijer12 The nanotwinned microstructures of these Ni(W) solid-solution films resemble to some extent those of pure nanotwinned metals such as Cu. The nanotwinned Cu microstructures were shown to be responsible for distinctly enhanced hardness, tensile strength, and resistance against fatigue, even in combination with ductility larger than for their nanocrystalline, untwinned counterparts. Reference Lu, Shen, Chen, Qian and Lu13–Reference Shute, Myers, Xie, Li, Barbee, Hodge and Weertman15 It will be shown that the formation of the nanotwinned microstructure in the case of Ni(W) is mainly W-content driven, in contrast to the apparently deposition-induced nanotwins found in pure metals such as Cu. The nanotwinned nature of the microstructure of Ni(W) films, as analyzed in this work, has the potential for drastic improvement of the mechanical properties.
Preceding work has shown that the magnetron-sputtered Ni(W) films exhibit a columnar grain morphology, being nanocrystalline with respect to the in-plane directions, and that these films are {111}fcc-fiber textured. Reference Welzel, Kuemmel, Bischoff, Kurz and Mittemeijer11,Reference Kurz, Ensslen, Welzel, Leineweber and Mittemeijer12 The grains exhibit a high density of planar faults, aligned perpendicular to the film-growth direction. The planar-fault density, which is defined with respect to face-centered cubic (fcc) stacking in the present work, depends on the W content: At low W content the Ni(W) films are a fcc-like solid solution, with Ni being replaced substitutionally by W, whereas for W contents >20 at.% the crystal structure of the solid solution cannot be described as fcc anymore; instead, the crystal structure of the solid solution can be conceived as (mainly) faulted hexagonal close-packed (hcp). Reference Kurz, Ensslen, Welzel, Leineweber and Mittemeijer12,Reference Kurz, Maisel, Leineweber, Höfler, Müller and Mittemeijer16 This, on first sight puzzling observation, could be successfully explained very recently on the basis of first-principles calculations which suggested that a hcp solid-solution phase is more stable than a fcc solid-solution phase in the considered concentration range. Reference Kurz, Maisel, Leineweber, Höfler, Müller and Mittemeijer16 The present work aims at (i) quantitative analysis of the planar-fault density for Ni(W) films of different W contents and (ii) investigation of the thermal stability of the planar faults.
Planar faults in, for example, minerals, Reference Cowley and Au17 intermetallics, Reference Jagodzinski and Hellner18 and close-packed metals Reference Warren19–Reference Estevez-Rams, Welzel, Madrigal and Mittemeijer22 have been often studied by x-ray diffraction (XRD) using different approaches based on, for example, the difference equation method Reference Wilson23 or the matrix method. Reference Hendricks and Teller24 The existing literature mainly deals with the planar-fault density determination from powder diffraction patterns of textureless or slightly textured polycrystals, possibly incorporating complications due to distinct peak broadening owing to, for example, microstrain; only some publications deal with single crystals. Reference Jagodzinski and Hellner18 Such treatments are incompatible with the here-discussed polycrystals exhibiting a very specific microstructure: strongly fiber-textured and highly faulted on only one variant of close-packed planes. This specific microstructure is to the best advantage for the current analysis: For fcc crystals faulted on only one variant of {111}fcc planes, reflections of crystallographically equivalent planes are influenced unequally which is highly problematic if a textureless polycrystal has to be investigated by XRD due to overlapping reflections of the {hkl} family being influenced differently by planar faults. On the contrary, the presence of a strong and sharp {111}fcc-fiber texture in combination with the occurrence of planar faults only on those {111}fcc planes perpendicular to the fiber axis leads to a separation of the fault-unaffected and fault-affected reflections of the components of the {hkl} family, using only the latter for quantitative determination of fault probabilities. Such kind of textured polycrystals were also investigated in Ref. Reference Csiszar, Balogh, Misra, Zhang and Ungar25 by tracing back the very specific diffraction intensity distribution in reciprocal space to a powder-like diffraction pattern using a transmission mode; hence, the advantage of the separation of fault-affected and fault-unaffected reflections is not utilized. To the author's knowledge only Ref. Reference Velterop, Delhez, De Keijser, Mittemeijer and Reefman26, which is also concerned with such kind of textured, metallic polycrystals, uses shifts and broadening effects of individual fault-affected and fault-unaffected reflections to determine fault probabilities which are much smaller than the ones acting in the present study. In the clay community (e.g., Refs. Reference Moore and Reynolds27, Reference Ufer, Kleeberg, Bergmann and Dohrmann28), a systematic preparation of textured clay minerals is a common technique to enhance the intensity of the so-called basal reflections (with diffraction vector perpendicular to the fault plane) to be measured. The so-called nonbasal reflections, not considered in such works, are investigated in the present study.
The XRD method developed and used in this study for quantitative description of planar-fault densities is described in Sec. III. B. Its validity is demonstrated by comparison with results obtained by (high-resolution) transmission electron microscopy (TEM). The quantitative results obtained for planar-fault densities in the Ni(W) films, by in situ and ex situ XRD experiments and by (HR)TEM analysis, are discussed in terms of preferred types of stacking of close-packed layers and their stability as a function of W content and temperature.
II. EXPERIMENTAL PROCEDURES
The deposition of the Ni(W) films by magnetron co-sputtering at room temperature on a-Si3N4/a-SiO2/Si<001> wafers was carried out as described in Ref. Reference Welzel, Kuemmel, Bischoff, Kurz and Mittemeijer11. All films had a thickness of 500 nm. Their composition was adjusted by changing the power applied to the W target, whereas the power at the Ni target was held constant. The compositions were analyzed by inductively coupled plasma optical emission spectroscopy. The W content will be given by a number representing its value in atomic percentage after the elemental symbols, i.e., NiW9 indicates a Ni(W) film containing 9 at.% W.
TEM investigations were performed with a Philips CM200 (FEI, Eindhoven, The Netherlands) operating at 200 kV, using a CCD camera. The cross-sectional thin foil specimens were prepared by the tripod method. Reference Benedict, Anderson and Klepeis29 Further, a thus prepared cross-sectional NiW17 specimen was investigated by HRTEM using a Philips CM30 ST microscope equipped with a LaB6 cathode operating at 300 kV and using a CCD camera.
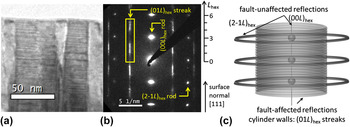
The electron-diffraction patterns recorded from the Ni(W) films exhibit both sharp and diffuse spots, so-called fault-unaffected reflections and fault-affected reflections, respectively, as shown exemplarily in Fig. 1(b). As visualized in Fig. 1(c), these fault-affected reflections and the additionally occurring diffuse intensity build cylinders of intensity in reciprocal space, whereas the fault-unaffected reflections are reflected as rings only (the rotational symmetry is caused by the fiber texture; the rotation axis is parallel to the fiber axis). It is convenient to introduce a hexagonal-rhombohedrally centered unit cell with a hex = ½ (a fcc − b fcc), b hex = ½ (b fcc − c fcc), and c hex = a fcc + b fcc + c fcc, i.e., c hex = 3d fcc (hkl = 111). Using this hexagonal indexing, fault-affected reflections fulfill the equation H − K = 3N ± 1 (with N as integer) and build the diffuse intensity distributions (streaks) parallel to the marked (01L)hex streak. The intensity distribution along this (01L)hex streak is a representation of the stacking sequence of close-packed layers. This (01L)hex streak highlighted in Fig. 1(b) cannot be measured by a conventional θ–2θ scan with constant direction of the diffraction vector, i.e., as in powder diffraction; instead the angles 2θ, θ, and ψ have to be used to measure along this intensity streak. Two different XRD methods were applied: (a) θ–2θ scans at different ψ angles between surface normal of the specimen and diffraction vector, i.e., traversing the intensity distribution along (01L)hex at a specific ψ angle (see Fig. 7 in Ref. Reference Welzel, Kuemmel, Bischoff, Kurz and Mittemeijer11), and (b) hkl scans along the streak, defining the followed track in reciprocal space using SPEC™ (PSIC mode), i.e., the angles 2θ, θ, and ψ are changed simultaneously such that the detector area moves along the (01L)hex streak. In view of the availability and comparability of data obtained from both XRD methods, these data sets are used without distinction in the current analysis.
As-deposited magnetron-co-sputtered NiW17 film: (a) bright-field TEM image of a cross-sectional sample showing columnar grains and planar faults aligned perpendicular to the growth direction; (b) corresponding electron-diffraction pattern showing streaking due to the aligned faults and showing the position and L hex range of the investigated streak in reciprocal space marked by a rectangle; (c) illustration of the intensity distributions in reciprocal space for series of fault-affected and fault-unaffected reflections; the present fiber texture is reflected by the rotational symmetry of the diffracted intensity. The given orientation of the surface normal refers to (a), (b), and (c).

The XRD measurements were performed at the Rossendorf Beamline BM20 at ESRF (Grenoble, France) and at the Surface Diffraction Beamline at ANKA (Karlsruhe, Germany) which both provide synchrotron radiation by a dipole bending magnet. At BM20, two setups were used: One setup included a Si mirror, a Si(111)-double crystal monochromator and a toroidal mirror coated with Rh in the primary optics setting the wave length to 1.53 Å and focusing the beam to a size of approximately 300 × 300 µm2. A linear detector (Mythen, Dectris Ltd., Baden, Switzerland) was used, covering approximately 3° in 2θ. The other setup was identical except that the Si mirror was replaced by a Rh-coated Si mirror in the primary beam path and that the applied wave length was 0.77 Å. A closed Eulerian cradle served for specimen alignment. At ANKA, the wave length was set to 1.53 Å, using a Rh-coated Si mirror and a Si(111)-double crystal monochromator. Reference Stierle, Steinhauser, Ruhm, Renner, Weigel, Kasper and Dosch30 The specimens were mounted on an open Eulerian cradle; the beam was adjusted such that its size was approximately 500 × 200 µm2 at the location of the specimen. A parallel-plate collimator was placed in the diffracted beam path, to obtain a parallel beam, in front of a point detector (scintillation counter, NaI).
The in situ and ex situ heating experiments were performed in a DHS 900 chamber (Anton Paar, Graz, Austria) under a flowing reductive gas containing 2 vol% H2 (N2/H2 for ex situ experiments and at ANKA and Ar/H2 at ESRF). Before each heating experiment, the chamber was flushed twice and evacuated in between.
For the ex situ experiments, the films were subjected to four thermal cycles from 305 K to different, successive maximum temperatures of 450, 600, 800, and 800 K applying steps of 25 K with a holding time of about 20 min at each step. In the third cycle, a holding time of 12 h at 800 K was performed.
For the in situ experiments, the temperature was raised up to 800 K in steps of 50 or 100 K and was held constant at each step during the measurement time of less than 20 min using type (b) mode (see above). At 800 K, the specimens were annealed for 1 h, before they were cooled down to room temperature, with one measurement step in between at 600 K. During the in situ measurement of the NiW25 film, irregularities in the storage ring caused some delay in the measurement leading to an additional annealing time of 1 h at 750 K. In the case of in situ measurements, the evaluation of the measured intensity distribution was not performed for each temperature step but only in the case of visible changes of the intensity distribution as compared to the intensity distribution measured at the preceding temperature step.
III. EVALUATION OF EXPERIMENTAL DATA
A. (HR)TEM evaluation
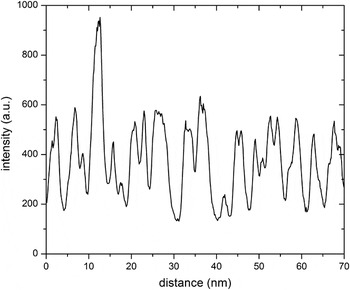
Planar-fault densities were determined from the diffraction contrasts in bright-field and dark-field TEM images [see Fig. 1(a)]. To this end, intensity profiles perpendicular to the planar faults were extracted from the electronically recorded images (see Fig. 2). Each inflection point is expected to correspond to one planar fault and thus a local planar-fault density can be determined. To get a global average, inflection points were counted for at least 15 different grains of each of the four as-deposited NiW3, NiW9, NiW17, and NiW21 films.
Intensity profile extracted perpendicular to the planar faults from an (electronically recorded) dark-field TEM image of an as-deposited NiW7 film.

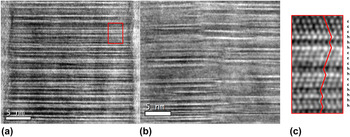
The additional HRTEM investigation allows a detailed study of stacking sequences of close-packed layers. Two exemplary HRTEM images of the as-deposited NiW17 film are shown in Fig. 3, presenting an obviously very high density of twin and stacking faults as well as other faulted sequences of close-packed layers. The stacking sequences were determined and expressed by the Jagodzinski notation using h and c [see Fig. 3(c) and Sec. III. B for definition] for sequences of about 1000 close-packed layers in 7 different grains. The fraction of h layers will be denoted as ‘degree of hexagonality η’ in the following and is given by
 $$\eta = {{{\rm{number}}\;{\rm{of}}\;{\rm{h}}\;{\rm{layers}}} \over {{\rm{number}}\;{\rm{of}}\;{\rm{h}}\;{\rm{layers}} + {\rm{number}}\;{\rm{of}}\;{\rm{c}}\;{\rm{layers}}}}\quad .$$
HRTEM images of an as-deposited NiW17 film showing a very high planar-fault density in the zone axis [100]hex: (a) all planar faults are aligned perpendicular to the growth direction and expand laterally through the whole columnar grain; (b) several planar faults start and end within this image at a collection of connected locations suggesting a small-angle tilt boundary (slight change of contrast); different planar-fault densities occur at different locations as in particular visible in (b); (c) enlargement of the region indicated by a red box in (a) denoting the atomic planes according to the notation of Jagodzinski.

B. XRD evaluation
The present study utilizes the intensity distributions (in contrast to Ref. Reference Velterop, Delhez, De Keijser, Mittemeijer and Reefman26) of nonbasal reflections (in contrast to Refs. Reference Csiszar, Balogh, Misra, Zhang and Ungar25,Reference Moore and Reynolds27,Reference Ufer, Kleeberg, Bergmann and Dohrmann28) along the cylinder walls of intensity, parallel to the cylinder axis, in reciprocal space, as visualized in Fig. 1(c). These intensity distributions are evaluated using the software package DIFFaXplus (version v2.400 Beta13 Reference Leoni, Gualtieri and Roveri31 ) which is based on the software package DIFFaX. Reference Treacy, Newsam and Deem32 This algorithm is able to fit diffracted intensity of crystals exhibiting randomly distributed parallel planar faults by adopting the kinematical diffraction theory and a statistical model based on a Markov chain to describe the stacking sequence of successive (in the present case close-packed) layers.
Regarding a close-packed structure, specific lateral displacements, perpendicular to the stacking direction, for the next close-packed layer occur, i.e., a shift of the next layer to the ‘right’ side or to the ‘left’ side upon stacking (‘+’ and ‘−’ in Hägg notation Reference Müller33 ; note that the stacking direction is equal to the film-growth direction of the Ni(W) films in the present case). Recognizing that a perfect fcc stacking of close-packed layers can be denoted as ABC or CBA, it follows that if the preceding ‘parent’ layer is denoted as A, the next layer might be B (shift to, say, ‘right side’) or C (shift to, say, ‘left side’). The probabilities for occurrence of these displacements can be noted in a ‘transition matrix’ formulation (see below) and refined on the basis of the measured XRD intensity data to evaluate the planar-fault densities quantitatively.
The notation of Jagodzinski Reference Müller33 is another, frequently used possibility to describe stacking sequences: If the neighboring layers of the considered atomic layer exhibit the same in-plane position, e.g., A is enclosed by two B layers, the enclosed layer is indicated as h layer, whereas in the case of the neighboring layers exhibiting different in-plane positions, e.g., A is enclosed by a B and a C layer, the enclosed layer is indicated as c layer. Thus, perfect fcc and hcp stacking sequences are denoted as …cccccc… and …hhhhhh…, respectively.
The evaluation procedure of the measured intensity distributions in the present study by DIFFaXplus has to be adjusted to the specific microstructures of the Ni(W) films. Therefore, the following presentation of the fitting procedure is divided into two parts: First, the case of fcc-like Ni(W) films is described which can be used for Ni(W) films exhibiting W contents <15 at.%. Second, the case of films with higher W contents up to 25 at.% is presented; these films are partly hcp-like. The films with W contents between 15 and 20 at.% show a coexistence of fcc-like and randomly stacked domains, whereas the higher W content films are almost solely hcp-like (for definitions see Sec. III. B. 1). However, randomly stacked domains and hcp-like domains in films with W contents >15 at.% are treated equally and are both denoted as hcp-like domains for simplification (without any loss of generality in the following treatment); these films are referred to as fcc + hcp films.
1. fcc-like Ni(W) films
In the case of fcc-like Ni(W) films, the transition matrix
 $${\rm {\bf T}} = \left( {\matrix{ {1 - \alpha _1 } & {\alpha _1 } \cr {\alpha _1 } & {1 - \alpha _1 } \cr } } \right)\quad ,$$
is used in the fitting procedure. The two rows of this transition matrix represent the probabilities of the occurrence of the two possible stacking types of close-packed layers for fcc. Stacking type 1 denotes layers which have been shifted by 1/3a hex + 2/3b hex + 1/3c hex with respect to a parent layer, ‘+’ in Hägg notation or, say, ABC. Stacking type 2 denotes layers which have been shifted by 2/3a hex + 1/3b hex + 1/3c hex with respect to a parent layer, ‘−’ in Hägg notation or, say, CBA. The first column of the transition matrix indicates the probability that the next layer of the considered stack complies with a ‘+’ shift; the second column indicates the probability that the next layer complies with a ‘−’ shift. Therefore, the transition matrix components T 12 and T 21 indicate the probability of a change of the stacking type from type 1 to type 2, i.e., from ‘+’ to ‘−’, and from type 2 to type 1, i.e., from ‘−’ to ‘+’, respectively. This change of stacking type generates the formation of one h layer, i.e., a planar fault with respect to fcc stacking, and the respective probability is given by α1 which is identical to the degree of hexagonality η as defined in Eq. (1). The probability that two consecutive layers with the same stacking type occur, i.e., two successive ‘+’ or two successive ‘−’ shifts, is represented by (1 − α1).
Note that if α1 is small, then the introduction of a planar fault (or h layer) implies that twinning occurs, as the likelihood that the following close-packed layer adopts the direction of lateral shift of the new stacking type is very large (1 − α1 >> α1). In principle, a stacking fault can occur as well (then two successive h layers must occur) but its probability is small (α1 << 1).
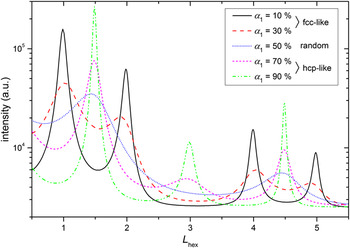
The influence of the parameter α1 = η on the intensity distribution in the reciprocal space is demonstrated by the results of DIFFaXplus simulations shown in Fig. 4. For pure fcc structures, intensity maxima at L hex = 1 and 4 occur. The existence of a twin variant (α1 << 1) leads to the additional maxima at L hex = 2 and 5. Obviously, the intensity maxima of the fcc-like structure broaden with increasing degree of hexagonality η (= α1) and shift to merge at L hex = 1.5 and 4.5 which indicates a random stacking sequence (η = α1 ≈ 50%). (Note the difference between the notation ‘randomly distributed faults’, i.e., stacking without regularities which can be described by a statistical model, and the notation ‘random stacking sequence’, i.e., approximately every second plane is faulted whereby the structure can be described by neither fcc nor hcp.) At even higher degrees of hexagonality, an additional intensity maximum at L hex = 3 develops, indicative of a hcp-like stacking.
Intensity distributions along the (01L)hex streak for different α1 = η values, simulated by DIFFaXplus using Eq. (2) and using similar additional parameters as refined upon application of DIFFaXplus to the measured data. At low degrees of hexagonality, i.e., α1 < 50%, intensity maxima at L hex = 1, 2, 4, and 5 occur, corresponding to fcc-like stacking. At high degrees of hexagonality, i.e., α1 > 50%, intensity maxima at L hex = 1.5, 3, and 4.5 occur, corresponding to hcp-like stacking. α1 = 50% corresponds to a random stacking sequence.

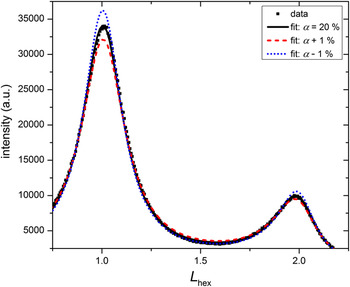
DIFFaXplus has been designed to simulate powder-diffraction patterns from an ensemble of layer-faulted crystallites exhibiting a random crystallite orientation distribution. Therefore, the calculation of intensity distributions along single streaks, as necessary for the investigated {111}fcc-fiber textured Ni(W) films with planar faults perpendicular to the fiber axis, is not directly possible (in contrast to the original DIFFaX software which, however, lacks refinement capabilities). Nevertheless, a refinement on the basis of the intensity distribution measured along a single streak in reciprocal space, using the transition matrix shown in Eq. (2), is possible with DIFFaXplus applying two measures: (i) The intensity versus L hex data was transformed into intensity versus 2θ′ data suitable as input for DIFFaXplus. To express the complication that each 2θ value of the intensity distribution is correlated with a specific ψ angle, which is a consequence of the necessity to measure the intensity distribution along the (01L)hex streak in reciprocal space, a prime is attached to the Greek letter for the diffraction angle, i.e., 2θ′. Thereby, confusion with the ordinary powder-diffraction angle 2θ is avoided. To allow comparison of data obtained at different wave lengths, the intensity distributions were plotted on the reciprocal L hex scale, although the fit was performed on the 2θ′ scale (as indicated above). (ii) Except for the investigated (01L)hex streak, the calculation of the intensity of all streaks and reflections was suppressed during refinement by use of corresponding DIFFaXplus commands. The inappropriateness of the 2θ dependence of the powder Lorentz and polarization factors used in the calculation of the intensity profiles was compensated by additional refinement parameters as the scale, the background, and the Debye–Waller factor. Further, the effect of 2θ dependence (as of the powder Lorentz and polarization factors) was minimized by considering only a small part of the measured intensity along the (01L)hex streak. Moreover, the lattice parameters (in hexagonal notation) and the 2θ offset were refined. Due to several correlations between those additional parameters, physically meaningful values could not be extracted for these parameters. However, the components of the transition matrix could be refined very reproducibly and the fit quality was very satisfying. A variation of the parameter α1 by ±1% leads to a significantly poorer fit, as evident from the intensity maxima and the less-appropriate intensity profile between the intensity maxima, as shown in Fig. 5.
Measured intensity distribution along the (01L)hex streak of an as-deposited NiW9 film (2θ′ varies from 42 to 53°) and results of fitting by DIFFaXplus [based on Eq. (2)] showing the sensitivity of the fit for varying the fault probability by only 1%.

2. fcc + hcp Ni(W) films
A measured intensity distribution along the (01L)hex streak as shown in Fig. 6 for an as-deposited NiW17 film, cannot be explained by the simulations shown in Fig. 4 using only one fault parameter, since it exhibits intensity maxima at L hex = 1, 2, and 1.5. A superposition of the intensity distributions simulated for α1 = 10% and α1 = 50% would result approximately in this measured intensity distribution, thus suggesting a coexistence of fcc-like and hcp-like domains, diffracting coherently. From here on, the hcp-like domain is treated as a fcc-like domain but with a different planar-fault probability, α2, with α2 >> α1, i.e., both planar-fault probabilities, α1 and α2, are defined with respect to fcc stacking. Therefore, also the hcp-like domain can be described by Eq. (2). To enable the possibility of a transition from a fcc-like domain to a hcp-like domain, and vice versa, for each next layer in the stack a probability is introduced for this transition: γ1 in the fcc-like domains and γ2 in the hcp-like domains, both being very small. The 4 × 4 transition matrix
 $${\rm\bf T} = \left( {\matrix{ {{\rm{fcc}}^{{\rm{Eq}}{\rm{.}}\;(2)} } \vrule height 17pt depth 5pt{{\rm{fcc}} \to {\rm{hcp}}} \cr \noalign{\hrule}{{\rm{hcp}} \to {\rm{fcc}}} \vrule height 17pt depth 5pt{{\rm{hcp}}^{{\rm{Eq}}{\rm{.}}\;(2)} } \cr } } \right) = \left( {\matrix{ {1 - \alpha _1 - \gamma _1 } {\alpha _1 } \vrule height 13pt depth 5pt{\gamma _1 } 0 \cr {\alpha _1 } {1 - \alpha _1 - \gamma _1 } \vrule height 13pt depth 5pt0 {\gamma _1 } \cr \noalign{\hrule}0 {\gamma _2 } \vrule height 13pt depth 5pt{1 - \alpha _2 - \gamma _2 } {\alpha _2 } \cr {\gamma _2 } 0 \vrule height 13pt depth 5pt{\alpha _2 } {1 - \alpha _2 - \gamma _2 } \cr } } \right)\quad ,$$
can be compiled to describe the allowed stacking possibilities (the lines in the matrix only serve to visualize the submatrices). Four different stacking types are introduced: The layers of stacking type 1 and 3 have been shifted by 1/3a hex + 2/3b hex + 1/3c hex with respect to a parent layer, ‘+’ in Hägg notation, and the layers of stacking type 2 and 4 have been shifted by 2/3a hex + 1/3b hex + 1/3c hex with respect to a parent layer, ‘−’ in Hägg notation. The fcc-like domains exhibit close-packed layers of stacking types 1 and 2 and the hcp-like domains exhibit close-packed layers of stacking types 3 and 4. Considering a stack of stacking type 1 (‘+’ shift in a fcc-like domain; first row of the transition matrix), the next layer has now three possibilities: (i) with a probability (1 − α1 − γ1) it complies with a ‘+’ shift remaining in the fcc-like domain; (ii) with a probability α1 it complies with a ‘−’ shift, i.e., change to stacking type 2, generating an h layer and remaining in the fcc-like domain; and (iii) with a probability γ1 the layer complies again with a ‘+’ shift but is the first layer of a hcp-like stacking corresponding now to stacking type 3. (In the present work, the change from a fcc-like domain to a hcp-like domain was defined to occur by a ‘+’ shift in the case of stacking type 1. It can be shown for small transition probabilities, γ i , that an interchange of the two γ i with the two zeros in their submatrix and, thereby, changing the type of shift to induce a change of domain types, leads to the same intensity distribution and an equal degree of hexagonality.) If case (iii) occurred, the next layer has again three possibilities but the respective probabilities changed now to (1 − α2 − γ2), α2, and γ2 since the parent layer corresponds now to a hcp-like domain, etc.
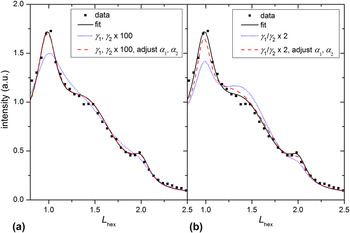
Illustration of correlation of the parameters α1, α2, γ1, and γ2 by DIFFaXplus fitting [based on Eq. (3)] to experimental data of a heat-treated NiW17 film at 305 K: Different sets of values for the parameters can lead to (almost) equally good fit results. The L hex scale corresponds to 2θ′ varying from 42 to 55°.

Reasonable fits could be obtained using the same additional fitting parameters, as the Debye–Waller factor etc., as for the fcc-like case (see Sec. III. B. 1). However, correlations between the parameters α1, α2, γ1, and γ2 occurred. This correlation can be demonstrated by simulations of the intensity along the (01L)hex streak: The fit to the intensity data from a NiW17 film (black, solid line) can be compared in Fig. 6(a) with a simulation using equally increased values for the parameters γ1 and γ2 by two orders of magnitude (all other parameters remain constant). This increase implies that both the fcc-like and hcp-like domains decrease in size, while the relative amounts of the fcc-like and hcp-like domains are preserved, because the γ1/γ2 ratio remains constant [see Eq. (5)]. The decrease in the size of the fcc-like and hcp-like domains leads to a drastic change in the intensity distribution (blue, dotted line). By additionally decreasing both α1 and α2, the simulated intensity distribution fits the data again very well (red, dashed line). A similar effect of correlation is shown in Fig. 6(b): Doubling (only) γ1 and, thereby, changing the absolute domain sizes and the relative amount of the fcc-like and hcp-like domains leads to a bad fit (blue, dotted line). But by additionally adjusting the parameters α1 and α2 an intensity distribution is obtained which fits the measured data again very well (red, dashed line). However, in this case, the maxima positions are not in perfect agreement with the measured data, suggesting that the increase of the relative amount of the hcp-like (or fcc-like) domains by doubling γ1 (or γ2) induces a shift of the intensity maxima positions.
It has thus been shown exemplarily in Fig. 6 that three different sets of values of the parameters α1, α2, γ1, and γ2 result in more or less equal intensity distributions along the (01L)hex streak, making a determination of the ‘true’ data set difficult. However, the degree of hexagonality of the structure, i.e., the fraction of h layers, which can be calculated from such a set of parameters, can serve as a ‘master parameter’: Whereas for fcc-like Ni(W) films, the degree of hexagonality η is equal to the fault parameter α1, the degree of hexagonality η of a fcc + hcp film has to be calculated from the degrees of hexagonality of the fcc-like and hcp-like domains weighted according to the domain-volume fractions f fcc and f hcp, i.e.,
 $$\eta = {f_{{\rm{fcc}}}}{\eta _{{\rm{fcc}}}} + {f_{{\rm{hcp}}}}{\eta _{{\rm{hcp}}}} = {f_{{\rm{fcc}}}}{\alpha _1} + {f_{{\rm{hcp}}}}{\alpha _2}\quad .$$
It seems plausible to suggest that the domain-volume fractions can be given as
 $$\eqalign{ & {f_{{\rm{fcc}}}} = {{{\gamma _2}} \over {{\gamma _1} + {\gamma _2}}}\quad \cr & {f_{{\rm{hcp}}}} = {{{\gamma _1}} \over {{\gamma _1} + {\gamma _2}}}\quad . \cr}$$
Generally, the domain-volume fractions as given in Eq. (5) can be rigorously calculated on the basis of the frequency of occurrence of the four different stacking types, i.e., the stationary state of a Markov chain (see e.g., Ref. Reference Klenke34), which has to be determined from the transition matrix. To this end, the left eigenvector of the transition matrix corresponding to the eigenvalue 1 has to be calculated, i.e., solving the equation,
 $${{\rm{\bf{x}}}^{\rm{T}}}({\rm{\bf{T}}} - \lambda {\rm{\bf{E}}}) = 0\;{\rm{with}}\;\lambda = 1\quad .$$
This leads to the left eigenvector,
 $${\rm{\bf{x}}} = {\left( {{{{\gamma _2}} \over {2({\gamma _1} + {\gamma _2})}},\;{{{\gamma _2}} \over {2({\gamma _1} + {\gamma _2})}},\;{{{\gamma _1}} \over {2({\gamma _1} + {\gamma _2})}},\;{{{\gamma _1}} \over {2({\gamma _1} + {\gamma _2})}}} \right)^{\rm{T}}}\quad .$$
Since the occurrence of stacking type 1 and 2 indicates a fcc-like stacking and the occurrence of stacking type 3 and 4 indicates a hcp-like stacking, the domain-volume fractions f fcc and f hcp are given by Eq. (5).
The values for the degree of hexagonality determined by Eq. (4) are practically equal for similar good fits with error margins of < ± 1%, whereas the parameters α1, α2, γ1, and γ2 were shown to have very different values depending on the fit (see above).
IV. RESULTS OF THE QUANTITATIVE FAULT ANALYSIS
A. Planar-fault density in the as-deposited state
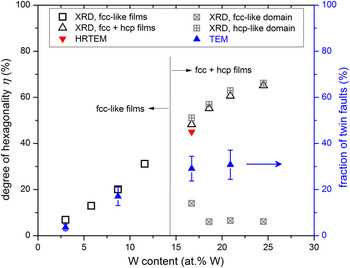
The twin densities of the as-deposited Ni(W) films as determined by TEM imaging (see Sec. III. A) have been plotted in Fig. 9. The fraction of twin faults increases from 4% to 31% for the W content increasing from 3 to 21 at.%; a tendency to saturate at high W contents is visible. The separate HRTEM image analysis of the NiW17 film resulted in a degree of hexagonality of η = 45% which is considerably higher than η = 29% as determined by TEM diffraction contrast analysis. This discrepancy is discussed in Sec. V. A.
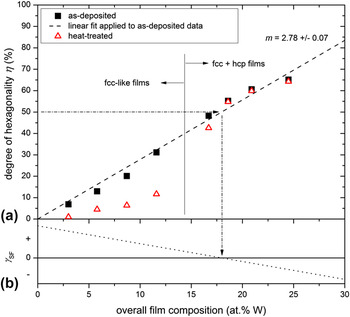
The degree of hexagonality of the as-deposited Ni(W) films as obtained by XRD analysis (i.e., DIFFaXplus fitting of intensity distributions) has been plotted as a function of W content in Fig. 8(a) (see black, solid symbols). Remarkably, the degree of hexagonality is practically proportional to the W content.
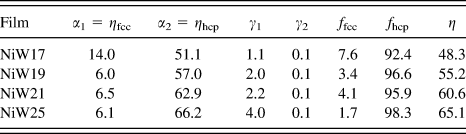
For the fcc + hcp films, the degree of hexagonality is separately indicated for the fcc-like and hcp-like domains in Fig. 9, disregarding the mentioned correlation between the four matrix elements α1, α2, γ1, and γ2. The degree of hexagonality in hcp-like domains, ηhcp (= α2), clearly increases with increasing W content, whereas the degree of hexagonality in fcc-like domains, ηfcc (= α1), appears to decrease slightly. Hence, both the fcc-like and hcp-like domains seem to become more perfect with increasing W content. The hcp-like volume fraction is already larger than 90% for the fcc + hcp film of the lowest W content and increases with increasing W content (see the volume fractions of the domains as listed in the Appendix), thus leaving only a very small volume fraction of fcc-like domains.
B. Thermal stability of the planar-fault density
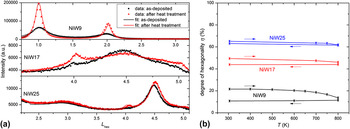
Intensity distributions along the (01L)hex streak as measured at the beginning and at the end of the complete in situ heating experiments (see Sec. II) of the NiW9, NiW17, and NiW25 films at 305 K are shown in Fig. 7(a). Obviously, the heat treatment induced pronounced changes of the measured intensity distribution only for the NiW9 film, whereas the intensity distributions of the NiW17 and NiW25 films changed much less (NiW17) or even only marginally (NiW25). Changes of the intensity distribution upon heat treatment reflect the tendency to detwinning, i.e., the removal of planar faults being defined with respect to fcc stacking, which was quantified by model fitting using DIFFaXplus. The results for the degree of hexagonality have been plotted as a function of temperature in Fig. 7(b). Whereas the degree of hexagonality of the NiW9 film drops down to one half of its value in the as-deposited state in the temperature range of 500–800 K, i.e., every second an h layer was converted into a c layer, the stacking of the close-packed planes of the NiW17 and NiW25 films remains almost unchanged: Slight detwinning was observed for the NiW17 film at temperatures higher than 700 K, whereas the change of the degree of hexagonality of the NiW25 film (which experienced a more pronounced annealing treatment; see Sec. II) practically remained the same.
Outcome of the in situ heat treatments: (a) intensity distributions along the (01L)hex streak as recorded for the as-deposited NiW9, NiW17, and NiW25 films (black data points) and the corresponding intensity distributions as recorded after the in situ heat treatment at 305 K (red data points); the solid lines show the respective fitted curves having a satisfying fit quality; (b) degree of hexagonality as a function of temperature; a fit was only performed if a change of the intensity distribution along the (01L)hex streak was visible with respect to the measurement at the previous temperature step.

The degree of hexagonality of the Ni(W) films, which were all ex situ heat treated with the same temperature program, has been plotted in Fig. 8(a) as well (see red, open symbols) and can thus be compared with the corresponding data for the as-deposited films. Obviously, the degree of hexagonality after heat treatment as a function of W content follows a pronouncedly nonlinear, S-shaped function, whereas the degree of hexagonality of the as-deposited Ni(W) films depends practically linearly on the W content. (In fact, regarding the S-shaped function of the degree of hexagonality versus the W content as clearly observed for the heat-treated Ni(W) films, upon close inspection for the as-deposited Ni(W) films the degree of hexagonality as a function of the W content seems to follow (already) the same trend, rather than being strictly linear.) Evidently, for W contents <15 at.% significant detwinning occurs upon heat treatment; in contrast, the degree of hexagonality remains almost constant for Ni(W) films exhibiting higher W contents. These results agree well with those obtained for the in situ experiments (see Fig. 7). Hence, the stability of planar faults (i.e., of h layers) increases with increasing W content which is linked to an increasing degree of hexagonality and to an increasing volume fraction of hcp-like domains (see Sec. IV. A).
(a) Results of the XRD analysis (i.e., DIFFaXplus fitting of measured intensity distributions): degree of hexagonality as a function of the overall W content of the as-deposited and ex situ heat-treated Ni(W) films. The as-deposited degree of hexagonality increases distinctly and practically linearly with the overall W content, as illustrated by the dashed straight line with slope m. The investigated films have been grouped into fcc-like and fcc + hcp films according to the used fitting procedure. The error bars match the size of the symbols and have, therefore, not been indicated. (b) Schematic evolution of the stacking-fault energy γSF as a function of W content based on the experimental results: The occurrence of a degree of hexagonality of 50% suggests a negligible stacking-fault energy. Pure Ni is known to exhibit a stacking-fault energy of about 125 mJ/m².

V. DISCUSSION
A. Validation of the XRD analysis
The results obtained from XRD analysis using a statistical approach to describe real stacking sequences of close-packed layers can be compared with the results obtained by direct observation using (HR)TEM. The HRTEM analysis revealed no regularities in the stacking sequences of the Ni(W) films, in agreement with the assumption of randomly distributed planar faults made in the statistical model used for XRD analysis. Note that for W contents >15 at.%, this randomness exists only within each of the two types of domains, since a bimodal distribution of the planar-fault density corresponding to the simultaneous presence of the fcc-like (low density) and hcp-like (high density) domains was observed by XRD. This two-phase nature is recognizable in the HRTEM micrographs shown in Fig. 3 although the domain sizes vary distinctly and at some locations a differentiation between a fcc-like and hcp-like domain is hardly possible [see Fig. 3(c)]. If intensity distributions are calculated on the basis of values for the transition parameters γ1 and γ2 which have been determined estimating domain sizes of about 10 layers from Fig. 3(b), the results are comparable to the measured intensity distributions.
It is obvious from Fig. 3 that the degree of hexagonality varies with position in the film. Therefore, the (HR)TEM investigations are expected to provide a less well averaged, statistical degree of hexagonality than the one obtained on the basis of the evaluation of the XRD data. Yet, the fault densities as determined in this work by TEM analysis agree very well with those determined by the XRD evaluation for the fcc-like NiW3 and NiW9 films (Fig. 9). Regarding the fcc + hcp films, the degree of hexagonality derived from HRTEM investigations is in accordance with the XRD results (whereas the TEM results deviate strikingly from the XRD results; see Sec. V. C).
Comparison of fault densities in as-deposited Ni(W) films determined by XRD (DIFFaXplus fitting), HRTEM (image analysis of the explicit stacking sequence), and TEM diffraction contrast analysis (counting of light/dark contrast changes). The XRD and HRTEM results are presented in terms of the degree of hexagonality, whereas the TEM analysis yielded the twin-fault density (right ordinate). The TEM and XRD results agree for the fcc-like films but differ for the fcc + hcp films (see text). The HRTEM result (only obtained for the NiW17 film) agrees with that of the XRD analysis.

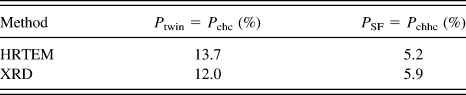
Further, the type of faults analyzed by XRD and HRTEM can be compared to validate the XRD analysis proposed in this work. The determination of the separate twin- and stacking-fault probabilities from the values determined for α1, α2, γ1, and γ2 according to the XRD evaluation is described in Sec. V. C. The results have been listed and can be compared with the results from direct analysis of the HRTEM images in Table I for the as-deposited NiW17 film. Evidently, these two independent evaluation methods lead to almost equal values for the fault parameters P twin and P SF.
Twin and stacking-fault probabilities of as-deposited fcc + hcp NiW17 film determined by HRTEM and XRD analysis; see text in Sec. V. C and Eq. (8).

B. Degree of hexagonality
The quantitative planar-fault analysis revealed unusually high planar-fault densities for all Ni(W) films. The smallest determined planar-fault density of 6% is already large compared to typical twin densities of nanotwinned materials reported in the literature, e.g., 2–5% for nanotwinned Cu. Reference Csiszar, Balogh, Misra, Zhang and Ungar25 For higher W contents, abnormally high planar-fault densities of more than 50% were observed, suggesting that on average every second atomic layer can be regarded as a planar fault. Note that for such high planar-fault densities the denotation ‘nanotwin’ or ‘planar fault’ is arguable, since the majority of the layers are h layers and an h layer then cannot be considered as a ‘fault’ anymore. Nevertheless, the denotation ‘planar fault (with respect to fcc)’ will be used to indicate h layers in this work.
This abnormally high planar-fault density, as well as the observed increase of the planar-fault density in the Ni(W) films with increasing W content [Fig. 8(a)], can be understood considering the ground-state diagram of (hypothetical) superstructures calculated by a first-principles methodology as presented in Ref. Reference Kurz, Maisel, Leineweber, Höfler, Müller and Mittemeijer16: With increasing W content, hcp-based superstructures become increasingly energetically stable and between 20 and 25 at.% W they are even energetically comparable to fcc-based superstructures, which are energetically most favorable for small W contents. At 25 at.% W, a (metastable) hcp-based superstructure was found to be the energetically most favored superstructure. (The heat of formation of the hcp-based superstructure is only 1.5 meV larger than the one indicated by the so-called convex hull which specifies the most stable phases at each concentration. The convex hull indicates that a phase separation into fcc-Ni–W and bcc-W would be energetically the most favored at 25 at.% W but the driving force for phase separation is marginal.) The energetic difference between the most favorable fcc-based and hcp-based superstructures can be taken as a measure for the planar-fault energy since a fcc structure can be converted into a hcp structure by adopting a twin-fault density of 100%. (The notation ‘planar-fault energy’ is used to emphasize the occurrence of different types of planar faults instead of utilizing the commonly used ‘stacking-fault energy’ suggesting the presence of mainly stacking faults which is not the case (see Table I). The planar-fault energy is defined to be the energy of one h layer per unit area.) Thus, a decreasing planar-fault energy is predicted for increasing W content, which is in accordance with the observed increase of the degree of hexagonality η with increasing W content [Fig. 8(a)]: The planar-fault energy is expected to cross zero at about 18 at.% W where the value of η = 50% determined by XRD analysis indicates the energetic similarity of fcc-based and hcp-based structures; see Fig. 8(b). For W contents >18 at.%, the planar-fault energy then becomes negative, as reflected by measured degrees of hexagonality η > 50%. This is in agreement with first-principles calculations predicting that the hcp-based structures are more stable than the fcc-based structures in the W concentration range from about 25 to 50 at.%. Adopting the result of an extrapolation of the observed linear dependence of the degree of hexagonality η on the W content [Fig. 8(a)], a pure hcp structure corresponding to η = 100% would occur for a NiW36 film. This prediction cannot be supported by experimental evidence, since in practice films with such high W contents were found to be amorphous after deposition. Reference Kurz, Ensslen, Welzel, Leineweber and Mittemeijer12 The latter experimental result might be suggested recognizing the observed slight decrease of the quotient ‘degree of hexagonality to W content’ at high W concentrations.
C. Twin- and stacking-fault probabilities
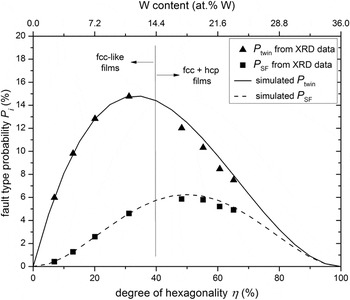
For determination of twin- and stacking-fault probabilities, the probability for successive lateral displacements of close-packed layers perpendicular to the stacking direction has to be considered, since twin and stacking faults are defined by specific sequences of successive Jagodzinski symbols: For the case of solely fcc-like domains, the probability to produce a twin fault, i.e., the probability of a layer sequence chc, is P twin = α1(1 − α1)2 and the probability to produce an intrinsic stacking fault, i.e., a layer sequence chhc, is P SF = α1 2(1 − α1)2. These equations have been used to simulate the twin- and stacking fault probabilities as a function of the degree of hexagonality η (= α1); the results have been plotted in Fig. 10. With increasing degree of hexagonality, the twin-fault probability P twin increases firstly linearly but then the slope of the P twin versus η evolution decreases. For η > 35%, P twin even decreases with increasing degree of hexagonality, i.e., for large degrees of hexagonality the probability to find only one h layer between two c layers decreases drastically. The stacking-fault probability P SF increases initially quadratically with increasing degree of hexagonality. For η > 50%, P SF decreases with increasing degree of hexagonality. It is much smaller than the twin-fault probability for η < 50%, reflecting the larger planar-fault energy of stacking faults compared with twin faults. Reference Hirth and Lothe35
Twin- and stacking-fault probabilities of the as-deposited Ni(W) films, as determined from the fitted fault parameters (see Sec. V. C), are given as data points as a function of degree of hexagonality, which is related to the W content by the dashed line in Fig. 8(a). Further, twin- and stacking-fault probabilities as simulated for a single-phase film [see Eq. (2) and Sec. V. C] are given by a solid and dashed line, respectively. The twin-fault probability increases initially linearly with the degree of hexagonality; for η > 35% it decreases pronouncedly. The stacking-fault probability increases initially quadratically with increasing degree of hexagonality; for η > 50% it decreases.

Analogously to the fcc-like case, the probabilities P twin and P SF can be determined for the fcc + hcp case by volume-fraction weighting the fault probabilities appearing in fcc-like domains, P fcc, and in hcp-like domains, P hcp,
 $$\eqalign{ & {P_{{\rm{twin}}}} = {P_{{\rm{chc}}}} = {f_{{\rm{fcc}}}}{P_{{\rm{chc,}}\;{\rm{fcc}}}} + {f_{{\rm{hcp}}}}{P_{{\rm{chc,}}\;{\rm{hcp}}}} = {\rm{ }}{f_{{\rm{fcc}}}}{\alpha _1}{(1 - {\alpha _1} - {\gamma _1})^2} + {f_{{\rm{hcp}}}}{\alpha _2}{(1 - {\alpha _2} - {\gamma _2})^2} \cr & {P_{{\rm{SF}}}} = {P_{{\rm{chhc}}}} = {f_{{\rm{fcc}}}}{P_{{\rm{chhc,}}\;{\rm{fcc}}}} + {f_{{\rm{hcp}}}}{P_{{\rm{chhc}},\;{\rm{hcp}}}} = {\rm{ }}{f_{{\rm{fcc}}}}{\alpha _1}^2{(1 - {\alpha _1} - {\gamma _1})^2} + {f_{{\rm{hcp}}}}{\alpha _2}^2{(1 - {\alpha _2} - {\gamma _2})^2}\quad . \cr}$$
Thereby, the faults represented by the transition interface from a fcc-like to a hcp-like domain and vice versa are neglected, which is justified because the transition probabilities γ i are small (see Appendix). The twin- and stacking-fault probabilities of fcc-like films and fcc + hcp films have been plotted as a function of W content in Fig. 10. It is obvious that the twin- and stacking-fault probabilities determined for the fcc-like films have to agree perfectly with the simulated ones because both were determined based on Eq. (2). However, it is remarkable that the twin- and stacking-fault probabilities determined for the fcc + hcp films, exhibiting a two-phase nature, are in good agreement with the ones simulated for a single-phase film exhibiting the same degree of hexagonality.
The twin- and stacking-fault probabilities of the NiW17 films determined by Eq. (8) have been compared with the twin- and stacking-fault densities determined by HRTEM in Table I. The agreement between these two independent analysis methods indicates that the occurrence of stacking faults (<6%, see Fig. 10) can be accurately explained by assuming a statistical stacking during growth, i.e., splitting of perfect dislocations is not a dominant mechanism for generation of stacking faults. (In the course of this project, the measured XRD intensity distributions were tried to be simulated by a statistical stacking model of close-packed layers allowing for stacking faults only applying DIFFaXplus. The thus calculated intensity distributions exhibit relatively pronounced reflection shifts which were incompatible with the measured intensity distributions.)
Regarding the fcc + hcp films, the fault density obtained by TEM analysis was found to deviate strikingly from the degree of hexagonality obtained by XRD analysis (Fig. 9). This discrepancy can be understood recognizing that only those types of faults can be counted by the TEM analysis which generate a diffraction contrast in the TEM images by the change of the stacking type, e.g., from type 1 to type 2 (‘+’ to ‘−’) as in the case of a twin fault; a stacking fault is limited to one layer of different stacking type and, therefore, virtually invisible. A linear dependence of the twin-fault probability P twin on the degree of hexagonality can be approximated for about η < 25% (Fig. 10) and, therefore, the degree of hexagonality determined by TEM can only be used for a good estimation in the concentration range 0–9 at.% W. For η > 35%, i.e., W content >13 at.%, P twin even decreases with increasing degree of hexagonality inducing an increasing discrepancy between the fault density estimated by diffraction contrast in TEM images and the (overall) degree of hexagonality as determined by both XRD analysis and HRTEM analysis, as indicated in Fig. 9.
D. Two-phase nature of Ni(W) films with W content >15 at.%
The measured XRD intensity distributions clearly indicate the presence of a bimodal distribution of the planar-fault density (fcc-like and hcp-like domains) in the concentration range 15–25 at.% W which was also suggested by the HRTEM images. This observed two-phase nature of Ni(W) films, can be rationalized by the first-principles calculations (see Sec. V. B): fcc-based superstructures are energetically preferred at 20.0, 21.1, 21.4, and 22.2 at.% W; a metastable hcp-based superstructure is more stable than a fcc-based superstructure at 25 at.% (see Fig. 5 in Ref. Reference Kurz, Maisel, Leineweber, Höfler, Müller and Mittemeijer16). Therefore, on the basis of the theoretical prediction, a phase separation into a fcc-based phase and a hcp-based phase is imaginable (at least in the concentration range 22.2–25 at.% W). The presence of two phases, fcc-like and hcp-like domains, was observed in this work for W contents >15 at.%. The hcp-like volume fraction increases with increasing W content and at 25 at.% W the fcc-like volume fraction was (still) about 2%. Therefore, the observed concentration range of the two-phase region is slightly larger than as predicted theoretically. Remarkably, the hcp-like volume fractions are very large as soon as they are observed experimentally and only a very small fcc-like volume fraction appears. This observation is not compatible with the expected behavior in a two-phase region between a fcc solid solution and a hcp solid solution, at least for starting from a homogeneous solid solution, since it violates the lever rule.
For fcc + hcp films, planar faults exist in both fcc-like and hcp-like domains, demonstrating the very small planar-fault energy in the concentration range 15–25 at.% (see Sec. V. B). As shown in Fig. 9, the fcc-like and hcp-like domains appear to ‘purify’ with increasing W content. This result may be of less significance, recognizing that the degree of hexagonality in fcc-like domains, ηfcc (= α1), and hcp-like domains, ηhcp (= α2), is correlated with their volume fractions (calculated by γ1 and γ2) and a quantitative interpretation of ηfcc and ηhcp may therefore be unjustified, at least for the cases of fcc-like domains of very small phase fraction.
E. Thermal stability of nanotwins
Heat treatment of the Ni(W) films leads to distinct detwinning of the fcc-like films exhibiting W contents <15 at.%, as supported by the first-principles calculations (see Sec. V. B), which predict stable fcc-based structures for W contents <15 at.%. Hence, randomly formed planar faults during growth are annihilated upon annealing of these films to decrease the overall energy of the film. At slightly higher W contents of 17 at.%, detwinning was observed as well, albeit to a considerably smaller extent and also the detwinning start temperature was 200 K higher than the one observed for NiW9, suggesting a smaller driving force for detwinning in NiW17, consistent with the presence of smaller planar-fault energies (see Sec. V. B). At even higher W contents, the hcp-based structures are predicted to become most stable (see above), which are conceived as originating from planar-fault incorporation with respect to fcc stacking. Therefore, the appearance of hcp-like domains for W contents >20 at.% is accompanied with a (structural) thermal stability of planar faults as indeed experimentally demonstrated [Fig. 8(a)]. This causes a higher stability of nanotwins in Ni(W) films with very small twin thicknesses (films of high W content) compared with nanotwins in Ni(W) films with larger twin thicknesses (films of low W content), which would not be expected for (just) low stacking-fault materials as, e.g., nanotwinned Cu or Ag. Besides this W-induced stabilization of nanotwins in Ni(W) by decreasing the planar-fault energy with increasing average W content [see Fig. 8(b)] another effect may influence the nanotwin stability: Segregation of W upon annealing, as discussed and demonstrated in Refs. Reference Welzel, Kuemmel, Bischoff, Kurz and Mittemeijer11,Reference Kurz, Ensslen, Welzel, Leineweber and Mittemeijer12, may occur at planar faults (so-called Suzuki segregation Reference Hirth and Lothe35 ) decreasing the planar-fault energy locally.
Stabilities of crystal structures, as predicted according to first-principles calculations, should be reflected more accurately by the heat-treated films, as the heat treatment could promote the formation of stable phases, rather than by the films grown during a magnetron-sputtering process in far-from-equilibrium conditions. However, the segregation tendency of W upon annealing of the Ni(W) films, as discussed above, obstructs a straightforward discussion of the structural results obtained by annealing. This segregation tendency may also explain the increase of the fcc-like volume fraction upon annealing for films with W contents >20 at.% [e.g., see results for the NiW25 film in Fig. 7(a)]: The total or at least local W segregation-induced decrease of the W content in the Ni(W) solid solution increases the planar-fault energy and leads to a larger driving force for detwinning.
VI. CONCLUSIONS
A new (x-ray) diffraction-analysis method was proposed for quantitative determination of the planar-fault density in materials exhibiting parallel planar faults. The method includes the following elements:
-
(1) The intensity distributions along certain ranges of streaks in reciprocal space are measured by XRD and fitted by means of a statistical model (see (2) below), using the DIFFaXplus software.
-
(2) The stacking sequences of (close-packed) atomic layers are described on the basis of a transition matrix, enabling, if needed, the occurrence of a two-phase nature (fcc + hcp) of the coherently diffracting domains by introducing four transition probabilities to be fitted [α1, α2, γ1, and γ2; Eq. (3)]. In case of stacking sequences of close-packed layers, these parameters can be used to determine the degree of hexagonality, i.e., the fraction of h layers.
The XRD analysis was validated by parallel (HR)TEM investigations.
Application of the new XRD analysis to Ni(W) films, exhibiting a {111}fcc-fiber texture and nanotwins parallel to the film surface, on the basis of intensity distributions measured along the (01L)hex streak, revealed (note that the planar faults are defined with respect to fcc stacking):
-
(1) The Ni(W) films are severely faulted, exhibiting degrees of hexagonality of up to 65%.
-
(2) The twin- and stacking-fault densities could be determined using the parameters of the transition matrix. It followed that the stacking-fault density is distinctly smaller than the twin-fault density for all investigated films.
-
(3) The degree of hexagonality, i.e., the fraction of h layers, of as-deposited Ni(W) films was found to be practically proportional to the W content (see (4) below).
-
(4) For Ni(W) films with W content >15 at.% a two-phase nature, fcc + hcp, was (even) revealed.
-
(5) The planar faults, i.e., the h layers, in Ni(W) films with W content >18 at.% were found to be thermally persistent. This thermal stability can be explained by the stabilization of hcp-based phases with increasing W content, i.e., negative planar-fault energies occur.
Fit parameters of the transition matrix, calculated volume fractions, and degrees of hexagonality of the as-deposited “two-phase” fcc + hcp films. All parameters have been expressed as a percentage.

ACKNOWLEDGMENTS
The authors are grateful for the allotted beamtime at ESRF and ANKA and thank all involved scientists for technical support (Dr. Carsten Bähtz and Dr. Olga Roshchupkina: Rossendorf Beamline, ESRF; Dr. Miguel Mantilla and Dr. Peter Wochner: Surface Diffraction Beamline, ANKA). Moreover, the following employees of the Max Planck Institute for Intelligent Systems are gratefully acknowledged: Mr. Frank Thiele (thin film growth, Central Scientific Facility ‘Thin Films’); Mrs. Ute Salzberger (TEM sample preparation, Stuttgart Center for Electron Microscopy); and Dr. Ewald Bischoff (TEM investigation). Moreover, the authors thank Mrs. Viola Duppel (HRTEM investigations, Max Planck Institute for Solid State Research) and Dr. Matteo Leoni (University of Trento) for helpful discussions concerning application of the software DIFFaXplus.
APPENDIX
The original fit parameters of the transition matrix describing the stacking sequences in the as-deposited two-phase fcc + hcp films have been gathered in Table A1, as well as the calculated volume fractions and degree of hexagonality.