Introduction
Air pollution is a serious environmental issue since a large proportion of humans living in urban areas breathe air that does not comply with the WHO Air Quality Guidelines.Reference Pascal, Corso and Chanel 1 One of the major sources of air pollution is fossil fuel combustion, coming mainly from road transport or industries. 2 Diesel exhaust particles (DEP) are a leading contributor to this problem, diesel combustion generating considerable amounts of fine ambient particulate matters (PMReference Donaldson, Tran and Jimenez 3 ). The multiple components of PM such as unburned fuel, lubricating oil, polycyclic aromatic hydrocarbons and other chemicals may act on different physiological mechanisms inducing numerous diseases. Epidemiological studies have shown that exposure to air pollution is related to respiratory and cardiovascular disordersReference Kelly and Fussell 4 but also to other physiological disorders. Namely, reproductive health in both sexes is negatively affected. In men, an increased fragmentation of sperm DNAReference Rubes, Selevan and Evenson 5 and more generally a decrease in semen quality were described.Reference Guven, Kayikci and Cam 6 – Reference Radwan, Jurewicz and Sobala 8 In women, an abundant literature reports the negative effects of air pollution on ovary function pointing to a significant impact on clinical pregnancy rate and miscarriage.Reference Frutos, González-Comadrán and Solà 9 , Reference Nieuwenhuijsen, Basagaña and Dadvand 10
Since in mammals the differentiation of gonads starts during fetal life, it is conceivable that exposure to DEP during this period may compromise ovarian or testicular function and the offspring fertility in adulthood. In mammals, the primordial germ cells colonize the genital ridges at early fetal life and then proliferate actively in the morphologically undifferentiated gonad.Reference Bowles and Koopman 11 , Reference She and Yang 12 Later, they differentiate to acquire the ability to enter meiosis, at puberty for males or during the fetal or neonatal life for females, depending on species. Simultaneously, the somatic cells of the undifferentiated genital ridge differentiate in cells expressing steroids or in cells acting as nursing and support cells for germ cells. Fetal life is thus a crucial period for sex determination and constitution of the stock of germ cells.Reference Bowles and Koopman 11 , Reference She and Yang 12 Thus, studies have been conducted to know whether atmospheric pollutants could affect the development of the gonads of the fetuses exposed in utero.Reference Slama, Thiebaugeorges and Goua 13 , Reference Rahmalia, Giorgis-Allemand and Lepeule 14
Epidemiological studies in the human have reported that exposure to cigarette smoke during the prenatal period could be responsible for a deregulation of fetal ovarian development.Reference Fowler, Childs and Courant 15 However, these studies point out the difficulties in the human to collect reliable data and highlight coherent patterns because of the lack of normal fetuses and of the diversity of environmental conditions of the analyzed cohorts.Reference Fowler, Childs and Courant 15 , Reference Hansen, Luben and Sacks 16
To circumvent these difficulties, and gain insight in the understanding of the mechanisms by which pollution during gestation affects gonad differentiation of the offspring, experimental studies have been carried out in animal models. An abundant literature in mice and rats reports that the exposure of animals to air pollution during gestation induces severe deleterious changes in the gonads of the offspring. In males, detrimental effects including reduction of daily sperm production, endocrine disruption affecting steroids and gonadotropins, decrease of the number of Sertoli cells presenting damaged mitochondria were reported after diesel exhaust (DE) exposure during the pre- or postnatal period.Reference Ono, Oshio and Niwata 17 – Reference Ema, Naya, Horimoto and Kato 20 In females, prenatal exposure to air pollution has been shown to induce a dramatic decrease in the size of the gonads due to alterations in germ cell development, gametogenesis and folliculogenesis that negatively affects the ovarian follicular reserve in offspring.Reference Veras, Damaceno-Rodrigues and Guimarães Silva 21 – Reference Mackenzie and Angevine 27
All these studies were done in rodents, mainly by exposure of the entire animals during gestation, and in some cases during lactation as well.Reference Kubo-Irie, Oshio and Niwata 19 , 24 , Reference Camlin, Jarnicki and Vanders 25 Questions remain which are difficult to answer: was the mother contaminated by ingestion (leaking) of pollutants or by inhalation? By which mechanism (acting on germ cell mitosis, or meiosis; or acting on somatic cells differentiation) does pollution affect the gonad? Are the data specific for rodents? For instance, the rabbit is commonly reported as a good model for reproductive toxicity studies.Reference Foote and Carney 28 , Reference Fischer, Chavatte-Palmer, Viebahn, Navarrete Santos and Duranthon 29 However, to our knowledge, in rabbits, only two papers report data from experimental exposure to air pollution during gestation. 30 , Reference Pepelko and Peirano 31 Exposure was performed using high PM concentrations (6–12 mg/m3; 8–20 h/day, 7 days a week) that is far higher than the mean values ranging from 15 to 115 μg/m3 (24 h/day, 7 days a week) in European cities.Reference de Nazelle, Bode and Orjuela 32 Surprisingly, these papers state that such an exposure has no effect upon the normal development of rabbit fetuses; in females, it does not cause any changes in the number of corpora lutea, implantations, resorptions, live fetuses or dead fetuses.Reference Pepelko and Peirano 31 Nothing was reported in males.
To answer these questions and attempt to clarify the contradictions, we chose to carry out a study in the rabbit species. An experimental protocol was thus designed to expose pregnant females and to collect gonads from the offspring. In contrast to the rodent models classically used in similar studies, the exposure did not coincide with the meiosis in the ovary since in rabbits this event is delayed to the perinatal period.Reference Daniel-Carlier, Harscoët and Thépot 33 Besides, as in the other models, the pregnant rabbits were exposed during the period at which somatic cells of the fetal gonads differentiate either in Sertoli or in granulosa cells according to the XY or XX genotype, respectively, and at which the germ cells of the fetal gonads undergo a series of mitosis.Reference Chretien 34 Consequently, exposure affected only the pre-meiotic period both in male and female offspring and could impact the sex determination of the gonad, the early differentiation of somatic cells, the multiplication and the early differentiation of germ cells. The present paper reports the data of this experimental study.
Materials and methods
Animals and ethical consent
New Zealand rabbits (HY07, Hypharm, Roussay, France) were bred at the UCEA rabbit facility (Unité Commune d’Expérimentation Animale, Jouy-en-Josas, France). Rabbit does were housed individually under controlled conditions of light (12 h light–12 h dark), with food and water available ad libitum. All experiments were performed with the approval of the local committee for animal experimentation [COMité d’ETHique appliqué à l’Expérimentation Animale (COMETHEA), Jouy-en-Josas, accreditation number 12/102].
Exposure conditions
The exposure protocol has been described in a previous paper.Reference Valentino, Tarrade and Aioun 35 It was conducted using the MAPCEL [Mobile Ambient Particle Concentrator Exposure Laboratory; National Institute of Public Health (RIVM), Bilthoven, The Netherlands], designed to perform inhalation toxicity studies in both experimental animals and humans. The DE was generated from an idling diesel engine, diluted with filtered and chemically purified air (Purafil, Purafil Inc., Doraville, GA, USA and Activated carbon, Norit, Amersfoort, The Netherlands). The concentration of some components of the exposure mixture have been already published, with notably 1 mg/m3 of PM2.5 (diameter of nanoparticles≈69 nm, <2.5 microns).Reference Valentino, Tarrade and Aioun 35 Animals were exposed by nose-only inhalation in custom made plexiglas tubes to either diluted DE (polluted group) or clean air (control group, exposed to filtered and chemically purified air) for 2 h/day, 5 days/week, from the 3rd to the 27th day post-conception (dpc) (i.e. 20 days altogether over a 31-day gestation). Females were not exposed immediately after mating but only 3 days after to avoid abortion due to handling without any relation to the exposure. The exposure is considered similar to the daily human exposure in large European areas when people drive or walk on big roads twice a day. However, this protocol does not take into account any prior exposures of the parents or the influence of pollutants on very early pregnancy.
Animals and experimental design
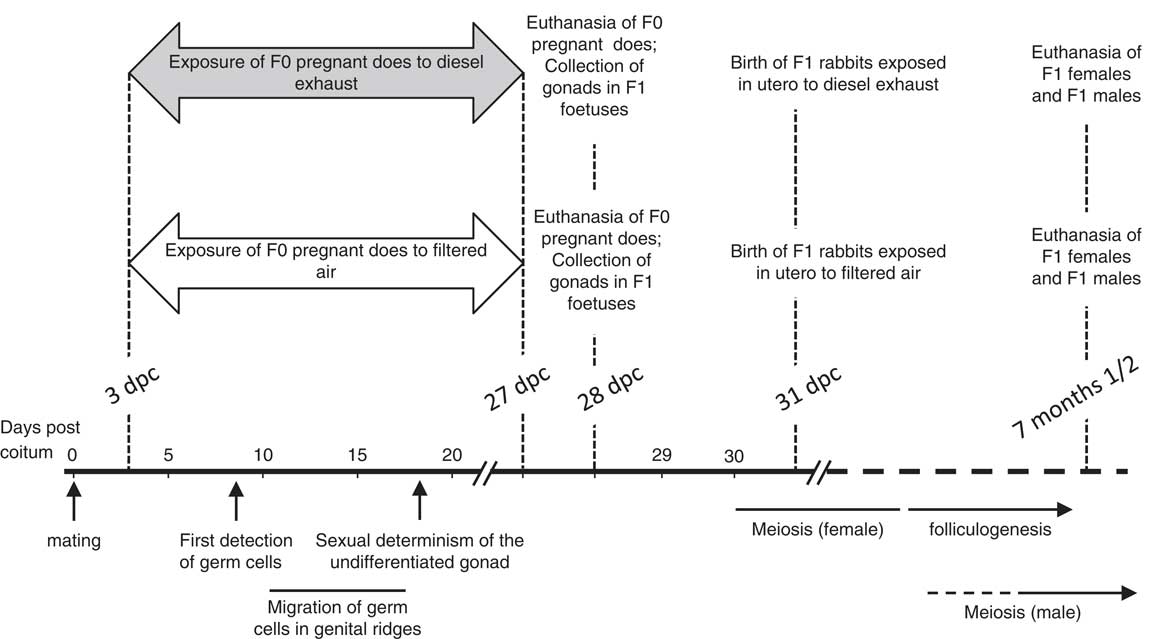
In total, 56 rabbits (named F0) were included in the experiment (Fig. 1 and Supplementary Table 1). After acclimatization to manipulation by experimenters for 2 months in order to reduce stress to handling, 23 pregnant does were exposed to DE and 33 others were exposed to the same device with filtered air during 25 days from 3 dpc. Each pregnant female remained in the same group during the entire pregnancy. Animals whose dams were exposed to DE during gestation were subsequently referred as the polluted group, while animals whose dams were exposed to filtered air were referred as the control group.
Experimental design. F0 does were exposed to diesel (33 animals) or filtered (23 animals) air between the 3rd and the 27th day after coitum [day post-conception (dpc)]. On day 28, some females (eight in the control group and seven in the polluted group) were euthanized to collect gonads in fetuses. Seven and a half months after birth, F1 males and females born in each group were fasted for 1 day and euthanized the next morning. Gonads and blood samples were collected. The scale indicates the principal features of gonad differentiation in the rabbit species. The first germ cells are detected at around 9 dpc. At 16 dpc, most germ cells have already entered the genital ridges. The first signs of sexual differentiation are observed at around the 18th day post coitum, with the detection of ovary or testis specific markers. In the ovaries, the first signs of meiosis are observed at around birth, and meiosis spans a period of 2 weeks after birth. In the testes, the first signs of meiosis are visible by 2 months after birth. The puberty is achieved in both sexes at 5–6 months.Reference Daniel-Carlier, Harscoët and Thépot 33 Clearly, the exposure period affects the early steps of gonad differentiation, characterized by the migration of germ cells in the genital ridges, their strong mitotic activity and sexual differentiation of the somatic cells according to their XX or XY genome.

At 28 dpc, 8 F0 females from each group were euthanized and gonads were collected from the fetuses. The rest of the F0 females were allowed to give birth and all offspring were raised in control conditions. After puberty at 7 and a half months, F1 rabbits were fasted for 1 day, then euthanized the next morning. Fasting was necessary to avoid any interference from dietary lipids in steroid ELISA assays using serum samples. Blood samples, ovaries or testes and epididymal sperm were collected. The gonads of all adults were weighed. The origin and distribution of the animals in the various analyses is indicated in the legend of each figure.
Histology and immunohistology of gonads
Freshly dissected fetal gonads were fixed in 4% paraformaldehyde in phosphate saline buffer (PBS) at 4°C. F1 adult gonads were fixed in Bouin’s fixative. After fixation, gonads were washed daily in 70% ethanol during 7 days then processed in an automated Shandon Citadel 2000 (Thermo-Fisher Scientific, Illkirch, France) before being embedded in paraffin wax for histological or immunohistological analysis.
When necessary, testis and ovary sections were stained with Harris haematoxylin and eosin using standard protocols in order to examine tissue morphology. For immunohistology, tissue sections underwent antigen retrieval by pressure-cooking in 0.01 M citrate buffer, pH 6.0 for 5 min. The sections were then incubated for 2 h in Blocking Reagent (MOM Kit, Vector Laboratories, Clinisciences, France) and incubated overnight at 4°C with a primary antibody diluted in MOM kit buffer (Supplementary Tables 2 and 3). The sections were washed in PBS and incubated with the appropriate secondary antibody (anti-rabbit IgG Fab2 Alexa Fluor 488 or 555, Cell Signalling; anti-mouse IgG Cy3, Millipore) for 45 min at room temperature. The sections were then rinsed in PBS and mounted in Vectashield mounting medium containing DAPI (Vector Laboratories). In parallel, incubation was carried out with the second antibody alone to determine the fluorescence background.
Observations were performed using a Leica DMRB epifluorescence microscope coupled to a DP50 CCD camera (Olympus) or a NanoZoomer (Hamamatsu Photonics, France).
Ovarian morphometric analysis
The whole ovary was processed in a series of sections, beginning at a section that contained medullary tissue. Five sections per adult ovary were analyzed (480-µm interval between two analyzed sections). Follicle counts were performed to compare the follicle pools in animals issued from polluted and control gestation. Classification of follicles was based on the previously published design.Reference Lundy, Smith, O’Connel, Hudson and McNatty 36 , Reference Bodensteiner, Sawyer and Moeller 37 Five well-defined stages of follicular growth from primordial to antral stage were recognized. Criteria used to classify follicles included the appearance and layers of granulosa cells as follows: one single layer of squamous granulosa cells characterizes primordial follicles; primary follicles have 1 complete layer of cuboidal granulosa cells; small pre-antral follicles are characterized with 2 or 3 layers of cuboidal granulosa cells; large pre-antral follicles display 4–6 layers of cuboidal granulosa cells; and antral follicles display an antral cavity. In addition, the number of atretic follicles was also assessed. Follicles were considered to be atretic if four or more granulosa cells in the cross-section contained apoptotic bodies. To avoid counting follicles twice, only follicles with an oocyte present in the studied section were taken into account. The number of follicles was normalized to the analyzed area that was measured using the free software ImageJ [ImageJ 1.48V, Wayne Rasband (wayne@codon.nih.gov), Research Services Branch, National Institute of Mental Health, Bethesda, MD, USA].
Sperm collection
For seminal analysis, the head of the epididymis was cut with scissors and placed in 1 ml of pre-warmed (37°C) PBS in order to recover the spermatozoa in the solution, as described elsewhere.Reference Dupont, Ralliard-Rousseau and Tarrade 38 Subsequently, sperm parameters related to motility were evaluated immediately in an aliquot by computer-assisted analysis (see below) and the remaining solution was centrifuged at 600× g for 10 min. The sperm pellet was incubated with trypsin (Trypsin EDTA, Eurobio, Les Ulis, France) at 37°C for 20 min, washed with PBS, fixed in Carnoy’s solution [2:1 (v/v) methanol:acetic acid) and stored at −20°C for DNA fragmentation analysis.
Computer-assisted sperm analysis (CASA)
Motility and velocity parameters of spermatozoa collected from the head of the epididymis were evaluated just after recovery using a CASA system (IVOS, Hamilton Thorne Biosciences, France). CASA outcomes included the percentage of motile spermatozoa, the curvilinear velocity (VCL), the straight-line velocity (VSL), the average path velocity (VAP), the beat cross frequency (BCF), the amplitude of lateral head displacement (ALH), the straightness (STR; VSL/VAP) and the linearity (LIN; VSL/VCL). Further explanation of these sperm variables measured by CASA can be found in the World Health Organization guidelines. 39
DNA fragmentation analysis
Sperm nuclear DNA fragmentation was evaluated using the terminal deoxynucleotidyl transferase (TdT)-mediated dUTP nick-end labelling technique (TUNEL assay) performed on spermatozoa samples stored at −20°C in Carnoy’s solution. Sperm pellets were washed twice with PBS, permeabilized for 5 min at 4°C with 0.1% (v/v) Triton X-100 (Sigma-Aldrich, France) in 0.1% (w/v) sodium citrate solution and washed twice with PBS. Fragmentation was assayed using the In Situ Cell Death Detection Kit (Roche Applied Science, France). In brief, spermatozoa were incubated 1 h at 37°C away from light with freshly made TUNEL solution containing FITC-labelled dUTP and TdT. A positive control sample was previously treated with DNase for 1 h at 37°C before incubation with the TUNEL solution. For the negative control, TdT enzyme was omitted. After incubation, spermatozoa were washed twice in PBS, spread out over slides and allowed to dry at room temperature in the dark. Once dried, DAPI solution was added and the slide was examined by fluorescence microscopy after mounted in Vectashield mounting medium. At least 400 spermatozoa were counted per each sample (200 spermatozoa by two different examiners). A representative picture of the analyzed spermatozoa is shown in the Supplementary Fig. 1. The percentage of spermatozoa with nuclear DNA fragmentation was calculated as the number of spermatozoa with FITC-positive nuclei (⩾10% of nucleus area stained) from the total number of sperm nuclei labelled with DAPI ×100.
Hormonal analysis
Blood samples were collected on the day of slaughter from adult F1 rabbits in the absence of any additive or clotting activator. Serum was obtained after centrifugation at 3500 g for 15 min at 4°C and stored at −20°C until analysis.
Serum concentration of testosterone (total testosterone, i.e., free and bound testosterone) was determined by a competitive binding immunoassay (Diasource TESTOSTERONE-ELISA, Louvain-La-Neuve, Belgium) following the protocol provided by the manufacturer. Testosterone was assayed directly in serum samples, as recommended. Validation was achieved by assaying successive dilutions of a rabbit serum sample, showing a good linearity and parallelism with the standard curve. As expected, testosterone was undetectable in the serum of male rabbits that had been castrated for over 2 weeks. In the present working conditions, the detection limit of the assay was 2.5 pg per assayed sample.
The concentrations of serum anti-Müllerian hormone (AMH) were measured with the ELISA test (AMH Gen II ELISA kit, Beckman Coulter France, Roissy, France) according to the method previously validated in the laboratory for ruminant serum.Reference Rico, Drouilhet and Salvetti 40 As expected, AMH was undetectable in serum of male and female rabbits castrated for over 2 weeks. For each rabbit, AMH concentrations were determined in 50 μl of serum diluted with castrated rabbit serum (serum without AMH). The standard range was also prepared with castrated rabbit serum. Preliminary testing by successive dilutions of a rabbit serum sample showed good linearity and parallelism in the standard range. In these working conditions, the detection limit of the assay was 32 pg/ml.
Statistics
The statistical analyses were performed using the GraphPad Prism 6 Software (GraphPad Software Inc., La Jolla, CA, USA). The rate of pregnancies and sex ratios of the offspring were analyzed using the Fisher’s exact test. For other statistical analysis, because of the small number of samples in some groups, comparisons between values collected on control and polluted animals were made by the Mann–Whitney test for non-parametric values. A probability lower than 0.05 was required for significance.
Results
Maternal exposure did not affect the issue of pregnancy: no difference in the level of pregnancy after mating, normal length of pregnancy (Supplementary Fig. 1 and Supplementary Table 1). The size of the litters (Supplementary Fig. 1), the weight of fetuses 28 days after coitus,Reference Valentino, Tarrade and Aioun 35 the growth curve and the weight of adults 7 and a half months after birth (Supplementary Fig. 1) did not differ in both groups.
In rabbits, the sex is determined at around 14–16 days after coitus.Reference Daniel-Carlier, Harscoët and Thépot 33 The sex ratio of the population was analyzed on the pool of animals issued from all pregnant dams (all G28 fetuses plus all born rabbits). Maternal exposure to DEP did not induce any difference in the sex ratio [48.1% of females and 51.9% of males in the control group (n=79); 57.8% of females and 42.1% of males in the polluted group (n=140); P=0.20].
Histological and immunohistological analysis of the gonads of F1 fetuses collected at 28 dpc
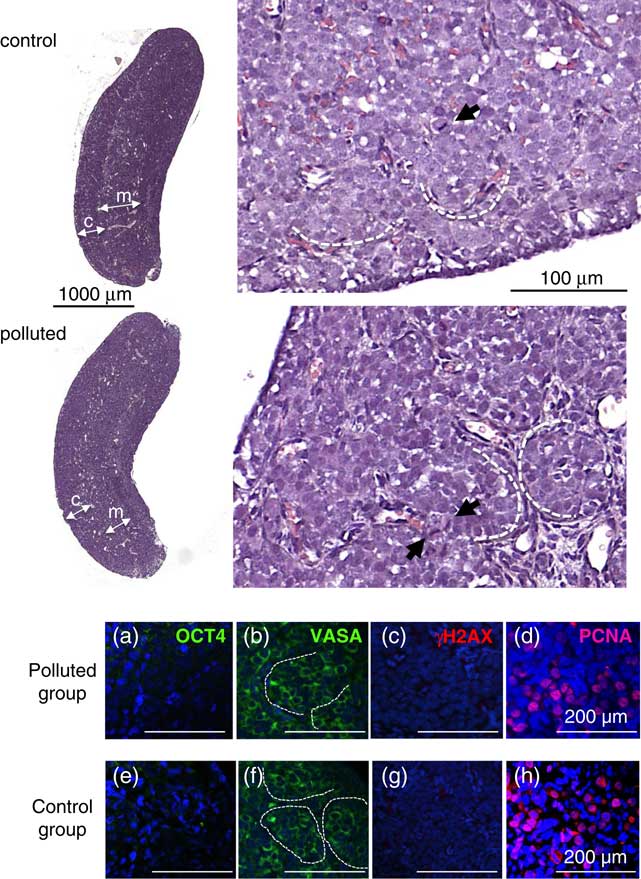
The histological analysis of ovaries of 28 dpc fetuses led us to identify the medulla/cortex organization that is classically observed in numerous mammals, showing ovigerous nests in the cortical part of the ovary with obvious figures of mitoses (Fig. 2). No clear difference could be detected between ovaries from control and polluted groups.
Histological and immunohistological analysis of ovaries of F1 fetuses collected at 28 day post-conception (dpc). In total, 6 μm sections of ovaries collected on female fetuses (F1) at 28 dpc were analyzed by histological (upper panels) or immunohistological methods (lower panels). The two gonads from 3 and 5 fetuses issued from, respectively, 3 and 3 litters were analyzed, respectively, in the control and polluted group. At small magnification, ovaries of both polluted and control groups presented the same size and organization. Germ cell nests were detected in the cortical zone (labelled ‘c’). The medullar zone (labelled ‘m’) contained vessels. In the large magnification panels, some germ cell nests are depicted by dotted lines. The black arrows point figures of mitoses. OCT4 (a, e), VASA (b, f), γH2AX (c, g) and PCNA (d, h) were localized by immunofluorescence. Panels show polluted (a, b, c, d) and control (e, f, g, h) ovaries. No fluorescent signal was detected both in control and polluted groups when using the antibody directed against OCT4 (a, e) and that directed against γH2AX (c, g). Immuno-labelling was performed in parallel with already studied positive samples from various sources that confirmed the specificity and the efficiency of each antibody (not shown). Besides, the VASA protein was clearly detected in the cytoplasm of germ cells in ovaries from both groups (b, f). No labelling was detected with the secondary antibody alone (not shown). The PCNA protein (d, h) was detected in the nuclei of cells similarly in ovaries from polluted and control groups. The numbers of germ cells (VASA positive) and of PCNA positive cells were similar in ovaries from both groups.
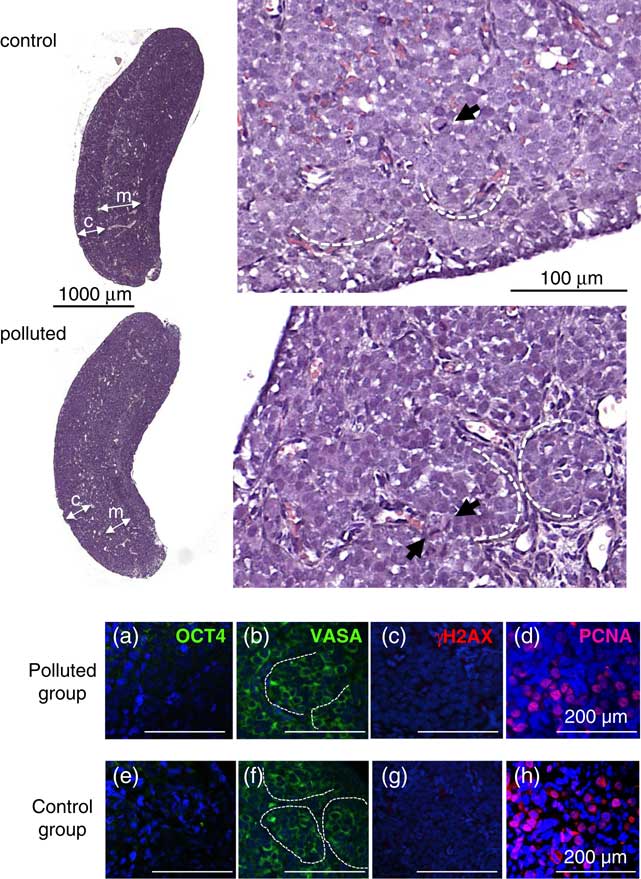
Some markers specific of the differentiation of germ cells were further studied by immunohistology. We looked for the OCT4 transcription factor, which is considered as a pluripotency marker present in the nucleus of undifferentiated germ cell, and the VASA protein that is normally located in the cytoplasm of germ cells and is characteristic of a later differentiated state. OCT4 was not detected in 28 dpc fetal ovaries neither in control group nor in exposed group (Fig. 2a and 2e). Besides, germ cells presented a clear cytoplasmic labelling when using the antibody against VASA (Fig. 2b and 2f). A similar labelling was observed with ovaries from both control and exposed groups.
After their entry in the genital ridges and until the initiation of meiosis, germ cells divide intensively.Reference Chretien 34 We searched for the presence of the PCNA protein that is currently considered as a marker of DNA replication and repair at cell division and meiosis.Reference Maga and Hübscher 41 As shown in Fig. 2d and 2h, a similar number of cells was labelled in ovaries from both groups, which is in favour of an intense mitotic activity as expected at this stage.
The fragmentation of DNA is a parameter classically analyzed to search for injuries after exposure to pollutants. We searched to detect by immunofluorescence the phosphorylated histone variant γH2AX that is a marker of DNA double-strand breaks. This histone variant is also typical of DNA crossovers occurring specifically in germ cells during the prophase 1 of meiosis.Reference Rogakou, Pilch, Orr, Ivanova and Bonner 42 , Reference Mahadevaiah, Turner and Baudat 43 As observed in Fig. 2c and 2g, γH2AX could not be detected by immunohistology in ovary sections from both groups that is in favour of an absence of DNA double-strand breaks.
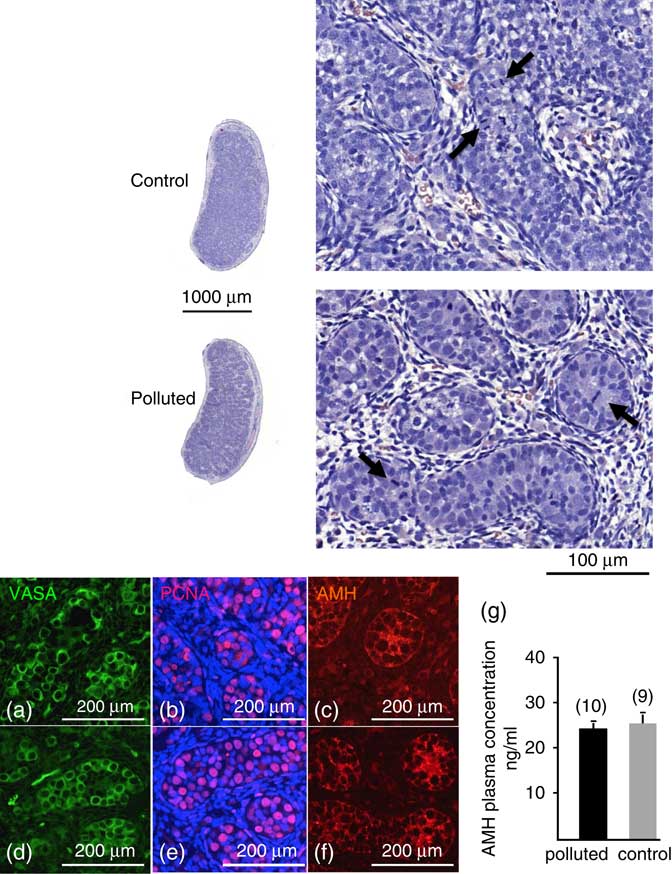
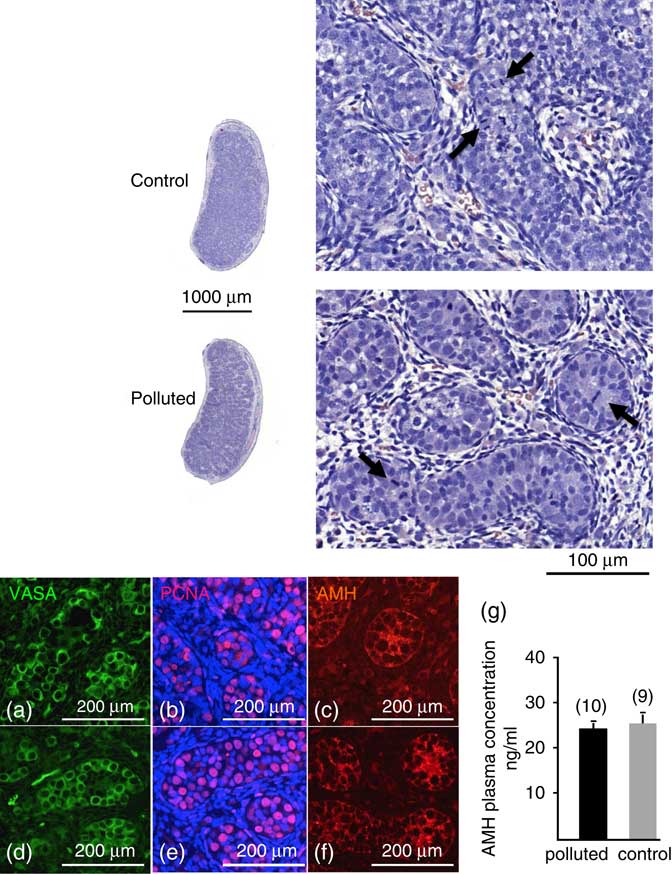
The testes collected on 28-day-old fetuses were analyzed (Fig. 3). As expected from previously published data,Reference Daniel-Carlier, Harscoët and Thépot 33 testicular cells were already organized in seminiferous tubules, surrounded by stroma cells including differentiating Leydig and Sertoli cells. Germ cells, characterized by a strong cytoplasmic VASA labelling (Fig. 3a and 3d), were localized inside the seminiferous tubules. We recognized numerous figures of mitoses in germ cells, which is confirmed by the PCNA labelling (Fig. 3b and 3e). We were not able to detect any significant labelling using the antibodies directed against OCT4 and γH2AX that is in favour of an absence of DNA double-strand breaks. Sertoli cells were characterized by a strong cytoplasmic AMH labelling (Fig. 3c and 3f) which filled the entire surface of the section of each tubule. Concomitantly, a very high AMH serum concentration was found in all fetuses (Fig. 3g), and the concentrations were similar in both groups. As a comparison, the mean levels of AMH in serum of female G28 fetuses were extremely low in both groups [0.53±0.06 ng/ml and 0.46±0.05 ng/ml in, respectively, polluted (n=9) and control groups (n=10)].
Histological and immunohistological analysis of testes of F1 fetuses collected at 28 day post-conception (dpc). In total, 6 μm sections of testes collected on male fetuses (F1) at 28 dpc (6 and 5 fetuses, issued from, respectively, 5 and 4 litters) were analyzed in the control and polluted group, respectively. At small magnification, the size and the structure of organs were not different. At large magnification, seminiferous tubules were clearly visible, filled with numerous round spermatogonia, and surrounded by stroma cells. The black arrowheads point the figures of mitosis. VASA (a, d) and PCNA (b, e) were localized by immunofluorescence in the cytoplasm and the nuclei of germ cells, respectively. The numbers of germ cells (VASA positive) and of PCNA positive cells were similar in testes from both groups. anti-Müllerian hormone (AMH) was localized in the cytoplasm of Sertoli cells (c, f). A similar labelling was observed in sections from both groups. The graph (g) shows the AMH serum concentration in G28 fetuses from polluted and control groups. Values are the mean± (n=10 in polluted and 9 in control groups).
Morphology of adult ovary
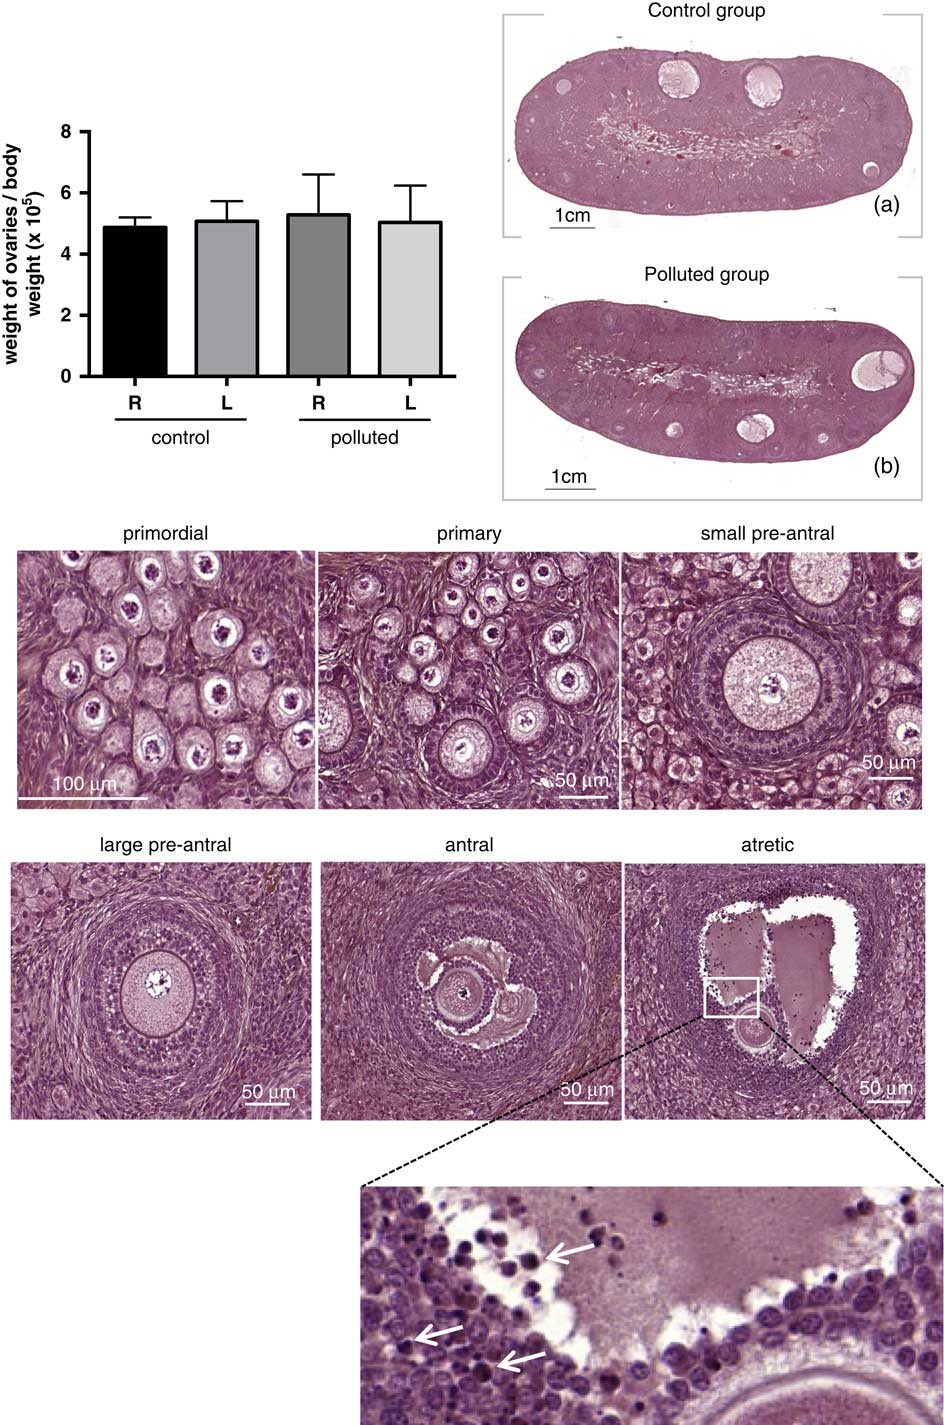
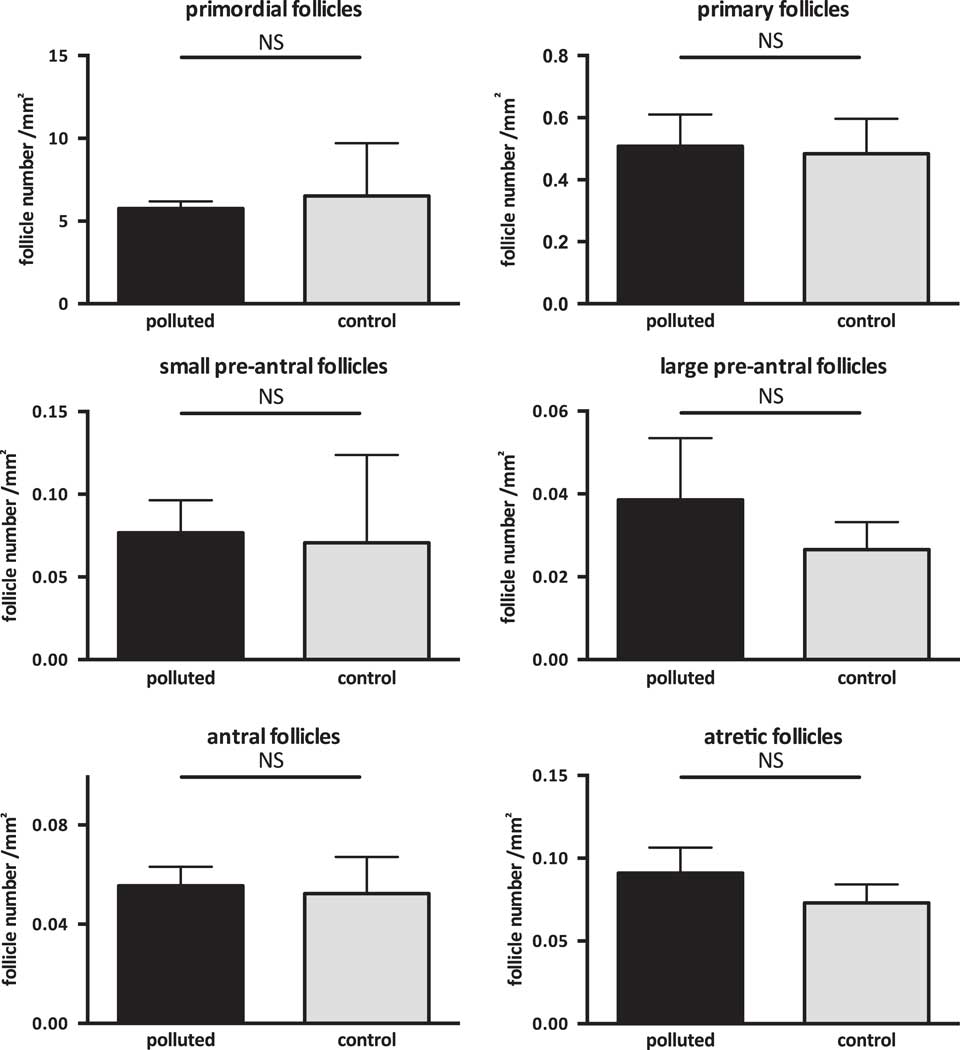
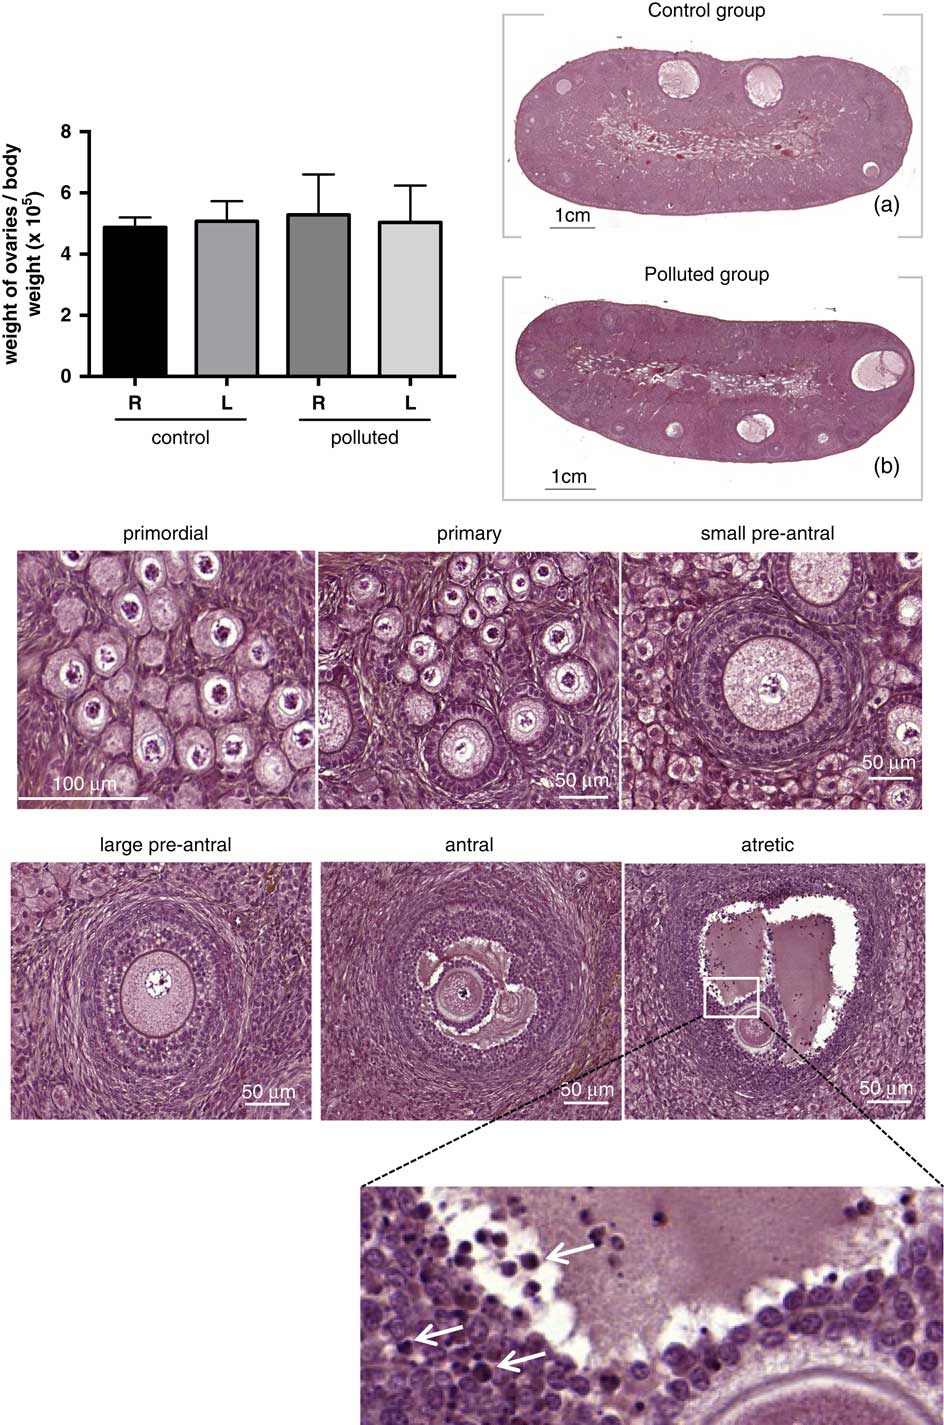
At 7 and a half months after birth, the weight of F1 ovaries was similar (Fig. 4). No morphological differences were found. The ovarian vascularization in the medulla appeared normal in all animals. All the defined classes of follicles already reported in this species were found in each ovary and no differences were detected with respect to their number when polluted and control ovaries were compared (Figs 4 and 5, Supplementary Table 4). Pycnotic figures were observed in large pre-antral and antral follicles, but without any specific abundance of atretic follicles in the polluted group. Therefore, DE prenatal exposure apparently did not impact on the morphology of all classes of follicles and had no effect on the number of follicles in the ovaries of offspring.
Morphological and histological analysis of F1 adult ovaries. The graph represents the weight of the right (R) and the left (L) ovaries of each animal after normalization to the weight of the body. Values are the mean±s.e.m. (control group, n=6; issued from 4 litters; polluted group, n=5; issued from 3 litters). The pictures (a) and (b) are longitudinal sections of representative ovaries of animals of the control and polluted groups. It shows clearly a cortical and a medullar zone, with similar structure in the two groups. The six pictures represent the well-defined stages of follicular growth, as observed in the control group. Similar pictures were observed in polluted group. In the primordial follicle, the oocyte is surrounded by a single layer of squamous granulosa cells. The primary follicle is characterized by the presence of one complete layer of cuboidal granulosa cells. The small pre-antral follicle is formed by 2–4 layers of granulosa cells and differentiating theca cells. The large pre-antral follicle display more than four layers of granulosa cells. Antral follicles are characterized by the antral cavity. Atretic follicles are recognizable by the presence of pycnotic bodies (white arrows) in granulosa cells.
Primordial, primary and atretic follicular count in F1 adult ovaries in polluted and control groups. Follicles were classified and counted as described in the Materials and methods section. In total, eight and six ovaries from the polluted and the control group, respectively, were analyzed. Each bar represents the mean±s.e.m. The statistical analysis showed no significant differences within each category of follicles between polluted and control ovaries.

Morphology of adult testis
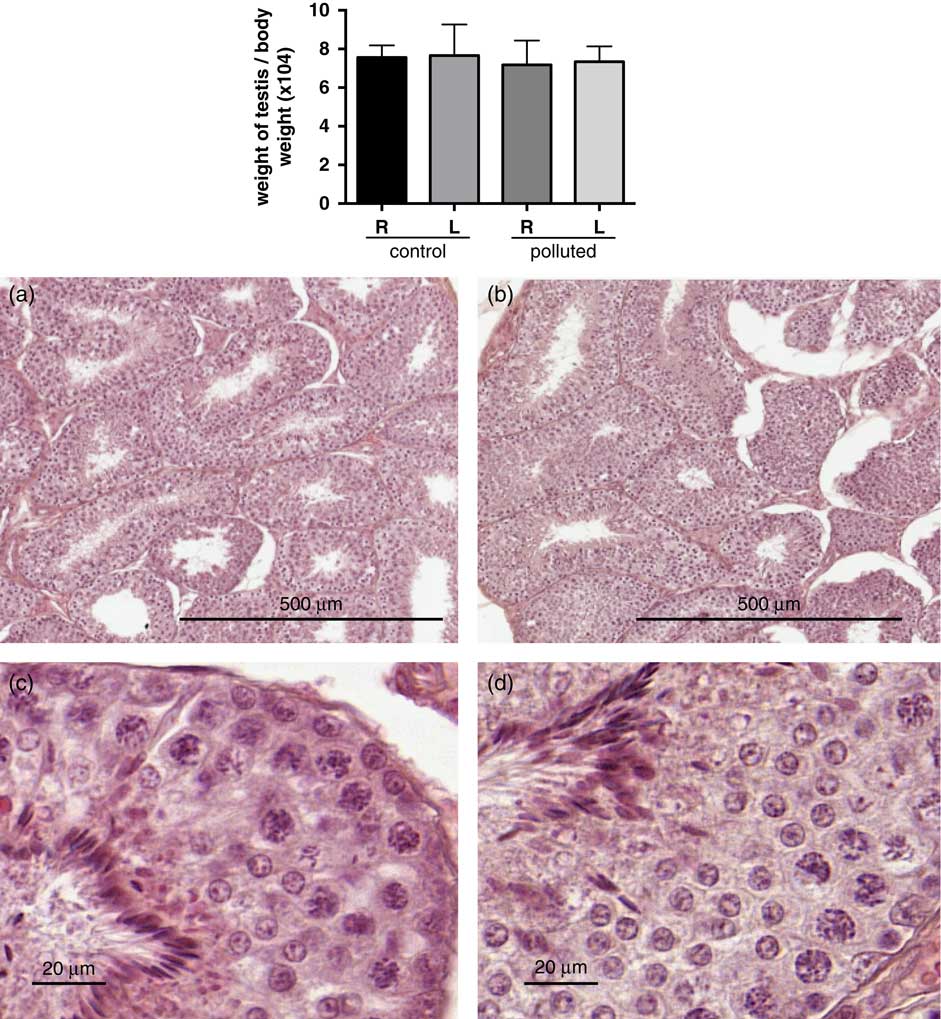
At 7 and a half months after birth, the weight of F1 testes was similar in both groups (Fig. 6). The histological analysis did not highlight any aberration in testis from polluted animals as it can be appreciated in Fig. 6b and 6d compared with the normal ones in Fig. 6a and 6c. Germ cells at various differentiation stages and morphologically normal spermatozoa were detected in the seminiferous tubules.
Morphological and histological analysis of F1 adult testes. The graph represents the weight of testes normalized to the body weight. Values are the mean±s.e.m. Control group, n=5; issued from five litters; polluted group, n=7; issued from five litters. Pictures represent representative sections of testis from control (a, c) and polluted (b, d) testis coloured by haematoxylin and eosin treatment, with two magnifications. The large magnifications show sections of tubes with a series of differentiation stages of germ cells, which are similar in the control and polluted groups. R, right testis; L, left testis.

Hormonal analysis of the F1 adult offspring
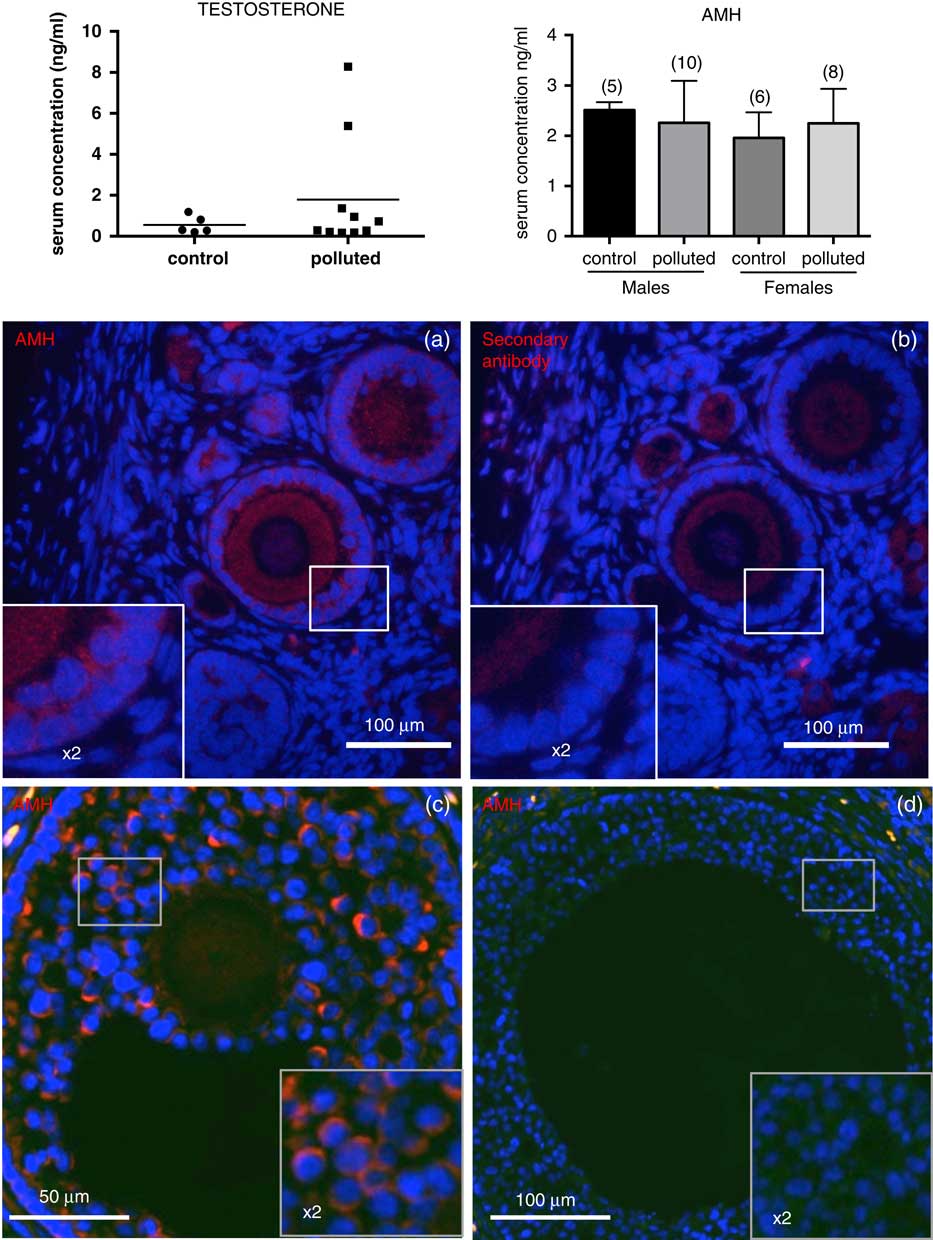
Testosterone and AMH serum levels were assayed in F1 adults, in males and females (Fig. 7). No significant differences were found as regard to the AMH serum levels in both groups. Concerning testosterone levels, a high dispersion of values was observed in polluted males. The search for outliers using the Graph Prism software analysis pointed out the two highest values but we had no experimental evidences to reject it. More, in these two animals, no other aberrant parameter could be noticed (AMH serum levels, testis morphology, sperm DNA fragmentation). However, excluding or not these values, average levels did not differ significantly in control and polluted groups.
Hormonal analyzes in F1 adult rabbits. Testosterone and anti-Müllerian hormone (AMH) serum levels were determined using a specific ELISA as described in the Materials and methods section. In males, the serum level of testosterone is given as individual values to show the dispersion of data. However, there is no significant difference between control and polluted samples (0.55±0.19 ng/ml in control; 1.78±0.88 ng/ml in polluted; P=0.2). The serum level of testosterone in all females was under the lower limit of the assay. As regard to the graph showing AMH serum concentrations, means are given with their respective s.e.m. Numbers in brackets are the numbers of analyzed serum samples. No significant difference was found between control and polluted animals. An immunofluorescence analysis was performed on ovarian sections using a specific antibody directed against AMH (a, c, d). (a) and (b) show adjacent sections. Granulosa cells from secondary (a), and small antral follicles (c) were specifically labelled [compare the labelling in A with the antibody directed against AMH and the labelling in (b) obtained with the secondary antibody]. Large antral follicles (d) were not labelled. AMH immunodetection was similar in control and polluted groups.

By immunodetection, a specific AMH labelling was observed in the cytoplasm of granulosa cells of secondary (Fig. 7a), and small antral (Fig. 7c) follicles and not in large antral follicles (Fig. 7d). Here also, there was no difference between control and exposed groups.
Sperm DNA fragmentation
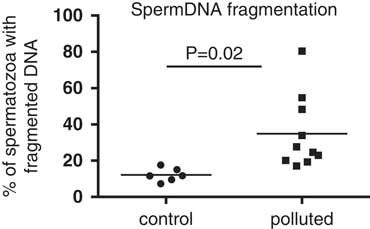
The fragmentation of sperm DNA was measured using a TUNEL analysis that measures single-strand and double-strand DNA breaks, the later, when it is extensive, being considered as incompatible with normal embryo development. All sperm samples presented some spermatozoa with fragmented DNA. However, the TUNEL assay evidenced almost a three-fold higher mean index of sperm DNA fragmentation in the polluted group when compared with the control group as depicted in Fig. 8. The smallest value was observed in the control group (7.27%) and the highest in the polluted group (80.37%). In spite of a large inter-individual variation in the polluted group, no outliers were found as specified by the GraphPad software analysis. Finally, the difference was statistically significant (12.15±1.52% in control sperm, n=6; 34.88±6.43% in polluted sperm, n=10; P=0.02).
Analysis of sperm DNA fragmentation. Sperm DNA fragmentation was measured as described in the Materials and methods section. The graph shows the percentage of FITC-positive spermatozoa in each collected sperm sample. The difference between control and polluted counts was significant (P=0.02).

CASA
In spite of the high number of rabbits in the experiment, only three sperm samples of the control group and seven from the polluted one were analyzed. Main sperm motility parameters are summarized in Supplementary Fig. 2. No satisfactory statistical analysis of the data could be performed due to the low number of samples. However, no clear differences were observed for the percentage of motile and progressive spermatozoa, VAP, VSL, VCL, BCF, ALH, straightness and linearity between both groups.
Discussion
This study belongs to a large-scale experimental approach aimed to review the effect of air pollution on health of the offspring.Reference Valentino, Tarrade and Aioun 35 A first paper reported the efficacy of the exposure and the effect on placenta function.Reference Valentino, Tarrade and Aioun 35 Interestingly, it was shown that pollutants [nano particle like (NP like)] were detected in pneumocytes, erythrocytes and plasma of exposed mothers but also in placenta cells (trophoblastic cells) and in fetal erythrocytes from polluted pregnancies and not from control ones, thus proving the possibility of a transplacental transfer of the NP like. However, to date, no other organs were tested for the presence of NP like.
The first step was to analyze the gonads just after the arrest of exposure (G28) to determine whether an immediate impact was already visible. The determinism of sex during fetal life was not significantly affected by the exposure, as shown by the equal number of males and females (G28 fetuses plus born offspring) from exposed or control mothers. Fetal gonads were apparently not affected by the exposure, in males and in females: similar morphology, same markers of differentiation. Notably, the lack of any DNA double-strand break shows that there was no severe apoptosis in gonads from exposed fetuses. No differences were observed as well in gonads collected after puberty.
The serum level of AMH was not different in females born from exposed or control gestations. Since AMH is currently considered as a marker of the follicle reserve, 44 indirectly, we can consider that the number and the endocrine function of the differentiating follicles that produce AMH were not affected by the exposure. The serum level of testosterone was assayed in males. However, in spite of the absence of any apparent stress and uncontrolled housing conditions, we observed abnormally high values in two males. This recalls the previously observed natural episodic releases of testosterone in the adult male rabbit without any clear explanation of their origin.Reference Younglai, Moor and Dimond 45 The serum level of testosterone was thus not possible to be considered as a significant parameter.
As regard to the CASA, among the several parameters of the motility of sperm that we analyzed, none were apparently modified but it would have been necessary to analyze a larger number of sperm samples for conducting a statistical analysis. Finally, the fragmentation of DNA of sperm was the only parameter significantly increased in polluted animals.
Clearly, our data do not resemble those reported in rodents. This could originate in the experimental protocol and from the species. First, the origin of air pollution and the mixture is not identical in all experiments, some experiments using diesel engine, and others cigarette. Second, as regard to the ovary, in mice and rats but not in rabbits, the meiosis occurred during the exposure period. It is conceivable that during meiosis, chromosomes are specifically exposed and sensitive to the action of pollutants. This could explain why in mice and rats severe changes were observed in the ovaries. Third, compared with other mammals, the rabbit blastocyst attaches to the uterine epithelium late in embryogenesis.Reference Fischer, Chavatte-Palmer, Viebahn, Navarrete Santos and Duranthon 29 Thus, one could suppose that since foeto-maternal exchanges were not of the same duration in experiments carried out in mice and rats, and in the rabbit (our present experiment), the pollution has not the same impact.
We have chosen to perform a sperm analysis on epididymal sperm and not on ejaculated sperm. This choice is explained by the fact that in rabbits, the quality of ejaculated sperm is highly variable depending on several parameters, some of which are easy to control (the season, the number of collection per day, the reproductive activity of the animal) but others are uncontrollable such as the daily behaviour of the animal, the efficacy of sperm ejaculation at successive collections and the ability of the technician.Reference Theau-Clément, Bolet, Sanchez, Saleil and Brun 46 Sperm was thus collected at the head of the epididymis. We analyzed the motility of sperm using a computer-assisted method. Among the several parameters that we measured, none was significantly modified. Considering that a small number of sperm samples were analyzed, the reliability of these data should be re-evaluated in a new experimental protocol.
An interesting result concerns the fragmentation of DNA of the sperm that we found significantly higher in F1 males from exposed gestation than in control animals. The TUNEL technique that we have used is considered as a reliable test for determination of sperm DNA fragmentation.Reference Sakkas and Alvarez 47 , Reference Bungum, Bungum and Giwercman 48 The impact of pollution on this parameter thus merits to be carefully considered. The formation of DNA breaks in male germ cells is a mandatory process that occurs at several steps in the course of spermatogenesis. First at meiosis prophase I, at leptotene-zygotene stages, just before chromosome pairing, it is necessary for genetic recombination and crossover formation. Second, DNA breaks occur in spermatids at the time of replacement of histones by protamines to condense the chromatin. These nicks have been supposed to suppress supercoiled structures that would be incompatible with DNA compaction (see for review inReference Sakkas and Alvarez 47 , Reference Rathke, Baarends, Awe and Renkawitz-Pohl 49 ). Alongside these natural and mandatory processes, sperm DNA fragmentation can be caused by exposure to environmental toxicants, radiotherapy and chemotherapy. The genomic integrity of sperm results from a balance between sperm endonuclease activity, which is responsible for the formation of DNA breaks, and reparative or protective activities.Reference Rubes, Selevan and Evenson 5 , Reference Evgeni, Lymberopoulos, Touloupidis and Asimakopoulos 50 , Reference Gunes, Al-Sadaan and Agarwal 51 These mechanisms, which are mandatory to avoid the production of damaged sperm, are influenced by environmental factors, namely air pollution.Reference Sakkas and Alvarez 47 In the study of air pollution-related illness, one of the most frequently reported nanoparticle-associated toxicities is the generation of reactive oxygen species (see for review in Reference Manke, Wang and Rojanasakul 52 ). It has been reported that sperm DNA is one of the major targets for oxidative stress.Reference Aitken, Baker and Sawyer 53 For all these reasons, in our present study, it would be interesting to study whether the oxidative stress differed in the gonads of exposed and control animals.
The next question is to know how the pollution at a very early step of gonad differentiation can affect the quality of sperm after puberty. The persistence of DNA breaks long after the time of exposure seems hardly compatible with the multiple checkpoints of the mitosis and meiosis occurring from the time of exposure to the differentiation of spermatozoa. In our experiment, the higher fragmentation of sperm DNA observed in the rabbits exposed to pollution signifies that male germ cells of the fetus – or other cells of the testis – have retained a memory of the insult that activated a process leading to DNA fragmentation of the spermatozoa. Therefore, it should be worth to analyze the DNA repair capacity of testis in exposed and control animals at the arrest of exposure in G28 fetuses and also in adult F1 males.
To conclude, this study shows that in the rabbits, a precocious air-pollution exposure of the gonads through the mother can impact the quality of the sperm of the offspring, especially by increasing sperm DNA fragmentation. Notably, it is generally accepted that spermatozoa have a poor DNA damage repair capacityReference Aitken, Baker and Sawyer 53 – Reference Russel, Brauch Russel and Kelly 55 but that sperm DNA abnormalities can be repaired by the oocyte after fertilization.Reference Meseguer, Santiso and Garrido 56 Now, it remains to be demonstrated whether the presence of such DNA strand breaks inherited from the paternal genome of in utero exposed animals could impact the development and health of the offspring.
Acknowledgements
The authors are grateful for the handling of animals during exposure performed by the MAPCEL team, and all the participants of the EPAPP project; for the care of animals at the facility performed by the team of UCEA (INRA, Jouy-en-Josas, France); for the invaluable assistance concerning histological and immunohistological techniques performed by A. Boukadiri (UMR 1313 GABI, INRA) and N. Daniel-Carlier (UMR 1198 BDR, INRA). The authors also thank the histology facility of UMR 1313 GABI and the MIMA2 platform for access to the virtual slide scanner both platforms located at INRA, Jouy-en-Josas. The authors are members of the COST action BM1308 ‘Sharing Advances on Large Animal models’ (SALAAM).
Financial Support
This study was supported by ANR grant ANR-13-CESA-0011-EPAPP.
Conflicts of Interest
The authors declare no conflicts of interest.
Ethical Standards
All procedures performed in studies involving animals were in accordance with the ethical standards of the institution or practice at which the studies were conducted. Informed consent was obtained from all individual participants included in the study
Supplementary material
To view supplementary material for this article, please visit https://doi.org/10.1017/S2040174418000351