Implications
The nutritive value of condensed distillers solubles (CDS) for cattle varies considerably between batches from different production plants, so that the use of mean values may lead to serious imbalances in the ration. Knowing the origin of CDS and analysis of some parameters is recommended to obtain a better estimate of the quality of each batch resulting in more accurate feed formulation. An alternative approach to derive the protein value of pasty feeds, like CDS, based on chemical analyses and in vitro solubility is proposed.
Introduction
The CDS are a by-product from the ethanol production based on grains. There are two major production processes: dry grind and wet milling (Liu and Rosentrater, Reference Liu and Rosentrater2012). In the first process whole grains are ground and then mixed and/or cooked with water. The starch in the flour is converted to sugars by enzymes and fermented into ethanol and carbon dioxide by yeast. After distillation of the alcohol, the remaining mash is centrifuged by which wet distillers grains are separated from the solubles, also called thin stillage. This latter fraction is further evaporated to a viscous paste, called CDS, sometimes also syrup. In most ethanol plants CDS is mixed again with the wet distillers grains and dried to dried distillers grains with solubles (DDGS), but in some plants CDS is an end product. In the wet-milling process grains are soaked in water, the softened grain is then milled and the fractions germ, fiber, gluten and starch are separated by screening, centrifuging and washing. The isolated starch is fermented by yeast into alcohol with CDS as by-product. As CDS needs no drying, it has a lower cost price per kilogram DM than DDGS, and is commercialized mainly for cattle and pigs farms in the neighborhood of the bio-ethanol plants or feed traders. On the other hand, feeding this by-product on the farm requires the investment for a tank or reservoir with stirring mechanism. Besides its good nutritive value, CDS is added to the diet to decrease dustiness, to decrease ingredient separation and animal sorting and to improve palatability (Schingoethe et al., Reference Schingoethe, Kalscheur, Hippen and Garcia2009).
In analogy with DDGS (De Boever et al., Reference De Boever, Blok, Millet, Vanacker and De Campeneere2014), one can expect that the nutritive value of CDS varies considerably depending on the grain type(s) used and further within the same grain type depending on the production process or plant. However, information about the nutritive value (metabolizable or net energy, digestible protein in the intestines) of CDS for cattle is scarce. There are some publications of production trials with corn CDS (Da Cruz et al., Reference Da Cruz, Brouk and Schingoethe2005; Bharathan et al., Reference Bharathan, Schingoethe, Hippen, Kalscheur, Gibson and Karges2008; Sasikala-Appukuttan et al., Reference Sasikala-Appukuttan, Schingoethe, Hippen, Kalscheur, Karges and Gibson2008). The latter concluded that corn CDS can be incorporated in dairy cattle diets (in replacement of soybean meal and corn grain) up to 20% of the DM, as long as the final diet does not contain >7% fat, without adversely affecting feed intake or milk production. Scientific articles about wheat CDS have not been published as far as known. The pasty nature of this product is undoubtedly an important obstacle to derive reliable nutritive values. It is indeed almost not possible to determine the rumen degradation characteristics of this by-product consisting of small particles by means of the nylon bag technique, which can be considered as the most appropriate method to evaluate the protein value of cattle feeds. Inaccurate knowledge of the nutritive value may lead to imbalances in cattle rations resulting in suboptimal performances and more losses into the environment. Therefore, it is important to dispose of reliable nutritive values of CDS, if not possible per batch, then at least per production plant.
The aim of this study was to determine the chemical composition, energy and protein value for cattle of five batches of wheat CDS originating from different production plants in Belgium, the Netherlands and Germany. The energy value was derived from digestion trials with sheep; for the protein value in situ degradation characteristics were predicted from chemical composition and in vitro solubility.
Material and methods
Condensed distillers solubles batches
In the course of 2011, five single day batches of CDS were purchased from different production plants: CDS1 from Alco Bio Fuel (Gent, Belgium), CDS2 from Syral (Aalst, Belgium), CDS3 from Biowanze (Wanze, Belgium), CDS4 from Verbio (Schwedt, Germany) and CDS5 from Cargill (Sas van Gent, the Netherlands). The CDS1 and CDS4 came from a dry-grind process with fermentation of whole wheat grains, whereas the other three batches originated from a wet-milling process with fermentation of wheat starch. The CDS were delivered and preserved in 1000 l IBC containers.
Digestion trials with sheep to derive the energy value
The net energy value for lactation (NEL) was derived from digestion trials with sheep following the procedure of the Centraal Veevoederbureau (1996) in accordance with the Belgian law for care of experimental animals (Royal Decision of 14 May 2010), approved by the Animal Ethics Committee of the Institute for Agriculture and Fisheries Research. It was considered that there are only small differences between sheep and cattle fed at the same feeding level, except for protein, which is generally better digested by sheep and for which a correction of 7% was made according to Van Es (Reference Van Es1978). The digestion trials were carried out from January until June 2012 in a Latin square design with six sheep and six feeds. We used mature castrated male sheep of the Texel breed, weighing (mean±SD) 83.6±5.3 kg. As CDS lacks physical structure, it could not be fed as sole feedstuff. Therefore, each batch of CDS was combined with maize silage (MS) in a ratio of 40/60 on DM basis. After thoroughly mixing MS with CDS, daily feed portions of 1 kg DM equivalent of the five mixtures of MS with CDS as well as of MS alone were weighed and frozen at −18°C. The daily portion, after thawing overnight, was fed in two meals per day. The MS, when fed alone, was supplemented with 20 g urea/day to provide sufficient N for the rumen bacteria. An adaptation period of at least 10 days in metabolic crates was followed by a 10-day experimental period with daily collection of all feces per animal, which was immediately frozen at −18°C. At the end of the experimental period, individual feces and eventual feed orts were weighed and sampled. The individual apparent digestion coefficients of organic matter (OM), CP, crude fat (CFA), crude fiber (CF), other carbohydrates (OC) and NDF of CDS were calculated by difference taking account of the mean digestion coefficients of MS assuming no digestive interactions and were then averaged per CDS batch. The NEL was calculated for a standard cow of 550 kg producing 15 kg milk with 4% fat according to Van Es (Reference Van Es1978) using the following formulae:
 $${\rm NEL(MJ}/{\rm kg)}\,{\equals}\,0.6\,{\times}\,\left[ {1{\plus}0.004{\times}(q{\minus}57)} \right]{\times}{\rm ME}{\times}0.9752$$
where q is the ratio of metabolizable energy (ME) to gross energy (GE); and ME (MJ/kg)=(15.90xDCP+37.66xDCFA+13.81xDCF+14.64xDOC)/1000, where DCP, DCFA, DCF and DOC the digestible nutrients in g/kg.
Chemical analyses
On a representative sample of the five CDS and MS and of the individual feces the contents of DM, CP, CFA, CF, crude ash and NDF were determined; the OC content was calculated by difference as 1000−CP−CFA−CF−ash (all parameters in g/kg DM). Samples of the five CDS batches were freeze-dried (Leybold, Zaventem, Belgium), whereas samples of MS and feces were dried in a ventilated oven (Memmert, Schwabach, Germany) at 65°C for minimum 48 h. Before drying the feces, a subsample was taken for N-analysis. Then, dried samples were ground through a 1 mm screen (Wiley, Rheotec, Maarkedal, Belgium). Residual moisture was determined by drying at 103°C (European Communities (EC), 1971b). Crude ash was obtained by incineration at 550°C (International Standards Organization (ISO), 2002). CP (N×6.25) was determined according to Kjeldahl (ISO, 2005). CFA was extracted with petroleum ether after hydrolysis with HCl (ISO, 1999). CF was obtained with the Ankom Fiber Analyser (Ankom Technology, Macedon, NY, USA) after boiling with sulfuric acid and sodium hydroxide (EC, 1992). The NDF was determined with an Ankom Fiber Analyser using α-amylase and sodium sulfite and expressed on ash-free basis (Van Soest et al., Reference Van Soest, Robertson and Lewis1991). ADF was determined with an Ankom Fiber Analyser and expressed exclusive ash; the residue was then treated with sulfuric acid to obtain ADL (Van Soest et al., Reference Van Soest, Robertson and Lewis1991). To obtain neutral detergent insoluble N (NDIN) and acid detergent insoluble N (ADIN), N was determined in the NDF and ADF residues, respectively. Starch was determined after autoclaving and hydrolysis with amyloglucosidase (Nederlandse Norm, 1974). Sugars were extracted with 40% ethanol and analyzed according to the Luff Schoorl method (EC, 1971a). Glycerol was determined with a gas chromatograph flame ionization detector after derivatization with trimethylsilylimidazole (Canale et al., Reference Canale, Valente and Ciotti1984). GE was determined with a bomb calorimeter (IKA C5003, IKA Werke, Staufen, Germany; ISO, 1998). Furthermore, silage quality parameters were determined, as the pasty CDS still contains a lot of sugars, which may ferment during preservation. Therefore, an extract was made by soaking 100 g CDS in 1 L distilled water at 4°C during about 16 h. On the extract, we analyzed pH, ammonia (Kjeldahl without previous destruction; ISO, 2005), lactic acid (Noll, Reference Noll1966; Gawehn, Reference Gawehn1984), acetic acid, propionic acid, butyric acid and alcohols with gas chromatography (Jouany, Reference Jouany1981).
The amino acids (exclusive tyrosine) were obtained with HPLC after acid hydrolysis (EC, 1998) and tryptophan after alkaline hydrolysis (EC, 2000). Reactive lysine was determined according to Moughan and Rutherfurd (Reference Moughan and Rutherfurd1996).
Estimation of the protein values
The protein value was calculated according to the Dutch DVE/OEB-system (Tamminga et al., Reference Tamminga, Van Straalen, Subnel, Meijer, Steg, Wever and Blok1994; Van Duinkerken et al., Reference Van Duinkerken, Blok, Bannink, Cone, Dijkstra, Van Vuuren and Tamminga2011). This system is based on degradability parameters derived from nylon bag incubations of feed samples in the rumen and intestines of fistulated animals. The bag technique is, however, not applicable for CDS, because most of the feed particles are smaller than the pore size of the nylon bags. To derive the protein value of CDS, two indirect approaches were investigated using a data set of 28 feeds of which chemical composition and in situ protein degradation parameters were determined previously (see Table 5). For this data set other by-products from ethanol production as well as from oil extraction were selected. It comprised 14 batches of DDGS (De Boever et al., Reference De Boever, Blok, Millet, Vanacker and De Campeneere2014), untreated and treated soybean meal (n=5), rapeseed meal (n=3), linseed meal (n=2), mixtures of these meals (n=2), wheat distillers grains and wheat solubles+bran. The rumen degradation characteristics were determined with three rumen cannulated lactating cows using nylon bags with a pore size of 37 μm incubated for 3, 8, 24, 48 and 336 h (CVB, 2004). The intestinal digestibility of undegraded protein (%DVBE) was determined by means of the mobile nylon bag technique using two cows provided with a T-cannula in the duodenum by incubating the undegraded residue obtained after 12 h rumen incubation and collection of the bags in the feces after passage through the intestines.
In the first approach, the fraction of rumen undegraded CP (%BRE) of CDS was derived from in vitro CP-degradability after 0, 1, 6, 24 and 48 h incubation determined according to Cone et al. (Reference Cone, Van Gelder and Van Vuuren1995). For the 0-h incubation, freeze-dried samples equivalent to 200 mg CP were incubated in 0.1 M borate–phosphate buffer at 40°C and pH 6.7 for 1 h and N was analyzed in the filtrate; the resulting CP-solubility is further indicated as BSCP. For the other incubation times, a bacterial protease from Streptomyces griseus (type XIV, Sigma P-5147, St. Louis, MO, USA) was added to the borate–phosphate buffer and the resulting CP-degradability is indicated as SG1DCP, SG6DCP, SG24DCP and SG48DCP, respectively. From the results (see Table 6) appeared that in vitro protein degradability of CDS increased up to 24 h of incubation, but remarkably decreased somewhat after 48 h of incubation. Therefore, SG24DCP was considered as the end point of enzymatic protein degradation to calculate %BRE vitro , based on the model of Van Duinkerken et al. (Reference Van Duinkerken, Blok, Bannink, Cone, Dijkstra, Van Vuuren and Tamminga2011):
 $$\eqalignno{\rm \%\,BRE_{{vitro}} \,{\equals}\,&U_{{vitro}} {\plus}D_{{vitro}} {\times}\left[ {kp_{D} \,/\,\left( {kp_{D} {\plus}kd_{D} _{{vitro}} } \right)} \right]\cr &{\plus} {S_{{vitro}} {\times}\left[ {kp_{S} \,/\,\left( {kp_{S} {\plus}kd_{S} } \right)} \right]$$
where U vitro is the rumen undegradable fraction, calculated as 100−SG24DCP; D vitro the potentially rumen degradable fraction, calculated as SG24DCP−BSCP; kp D the passage rate of CDS particles through the rumen, assumed to equal 8%/h, in between that of normal feed particles (6%/h) and liquid (11%/h); kd Dvitro the degradation rate, calculated by iterative fitting the in vitro CP-degradability values to the exponential model of Ørskov and McDonald (Reference Ørskov and McDonald1979); S vitro the soluble fraction in borate–phosphate buffer (BSCP); kd S the degradation rate of the soluble fraction, assumed to equal 200%/h; kp S the rumen passage rate of S, assumed to equal 11%/h.
To test the validity of the first approach, BSCP, SG1DCP, SG6DCP and SG24DCP were also determined on the 28 protein feeds in order to derive %BRE vitro and correlations between in vitro parameters and in situ degradation characteristics were calculated (see Table 5).
In the second approach, the rumen degradation rate (kd
D
) and the rumen undegradable fraction (U) of protein as well as %DVBE of CDS were predicted using equations based on chemical and in vitro parameters derived from the data set of 28 protein feeds. These equations were derived by multiple regression analysis according to the model:
 $$Y{\rm {\equals}}\,a{\rm {\plus}}b_{1} x_{1} {\plus}b_{2} x_{2} {\plus} \cdots {\plus}b_{n} x_{n} $$
. As potential independent variables we used the chemical parameters CP, CFA, CF, ash, NDF, starch and sugars, whereas the in vitro parameters concerned the already described BSCP, SG1DCP, SG6DCP and SG24DCP and further CP-solubility in water (WSCP) as well as in pepsin-hydrochloric acid (PHSCP). For WSCP, 2.5 g dried sample was incubated in water at 40°C for 30 min and N was analyzed in the centrifugate (CVB, 2004). For PHSCP, 2 g dried sample was incubated in a solution of pepsin (400 U/l) in 0.075 N HCl at 40°C for 48 h and N-analysis in the filtrate (EC, 1999).
Only regressions with all variables significantly (P<0.05) contributing to explain the variance in Y were considered. The regression with the highest adjusted determination coefficient (R²) and lowest residual standard deviation (RSD) was selected, being
 $$\eqalignno{kd_{{D{\rm pred}}} \, \left( {\rm \%/{\rm h}} \right)\,{\equals}\,&2.40\,{\minus}\,0.0266\,{\rm CP}\,\left( {{\rm g}/{\rm kg}\,{\rm DM}} \right) \cr &{{\plus}0.112\,{\rm SG}6{\rm DCP}\,\left(\rm \%\, \right){\plus}0.119\,{\rm PHSCP}\,\left(\rm \% \right)$$
where R 2=63.7% and RSD=1.71%/h.
U pred (%)=−0.98 – 0.0135 CP (g/kg DM)+0.0134 NDF (g/kg DM)+0.0978 ash (g/kg DM) where R 2=58.3% and RSD=1.4%-points.
%DVBE pred =106.64+0.0408 CP (g/kg DM) –0.0359 NDF (g/kg DM) –0.2479 ash (g/kg DM) −0.1900 SG6DCP (%) where R²=64.3% and RSD=3.7%-points.
The %BRE of CDS was calculated according to Van Duinkerken et al. (Reference Van Duinkerken, Blok, Bannink, Cone, Dijkstra, Van Vuuren and Tamminga2011):
 $$\eqalignno{\rm \%\,BRE_{{{\rm pred}}} \,{\equals}\,&U_{{{\rm pred}}} {\plus}D\,{\times}\left[ {kp_{D} \,/\,\left( {kp_{D} {\plus}kd_{{D{\rm pred}}} } \right)} \right]\cr&{{\plus}\,S{\times}\left[ {kp_{S} \,/\,\left( {kp_{S} {\plus}kd_{S} } \right)} \right]$$
where U pred is the predicted rumen undegradable fraction; D the potentially rumen degradable fraction, calculated as 100−U pred−WSCP; S the soluble fraction in water (WSCP); kd Dpred the predicted degradation rate of D; kp D the rumen passage rate of D, assumed to equal 8%/h for CDS particles; kd S the degradation rate of the soluble fraction, assumed to equal 200%/h; kp S the rumen passage rate of S, assumed to equal 11%/h.
To test the validity of the second approach, %BRE pred of the 28 protein feeds was calculated using the predicted kd D and U and was then compared and correlated with %BRE situ (see Table 5).
The true protein digested in the small intestine (DVE) of CDS was calculated as
 $${\rm DVE}\,{\equals}\,{\rm DVBE}{\plus}{\rm DVME}{\minus}{\rm DVMFE}$$
where DVBE is the rumen undegraded feed protein digested in the small intestine, calculated as CP content multiplied by %BRE pred and by %DVBE pred; DVME the microbial protein synthesized in the rumen and digested in the small intestine, calculated as the content of digestible OM (DOM, obtained in sheep digestion trial) minus the contents of CFA and BRE, multiplied by 0.095625; DVMFE the net endogenous CP lost in the digestive processes, calculated as (1000−DOM−crude ash×0.65)×0.075.
The rumen degradable protein balance (OEB) is the difference between the potential microbial synthesis based on available rumen degradable protein (MREN) and that based on available rumen degradable energy (MREE) with
 $$\eqalignno{ & {\rm MREN\,{\equals}\,CP}{\times}\left( {{\rm 1}{\minus}{\rm \,\%\,BRE}} \right) \cr & {\rm MREE\,{\equals}\,}\left( {{\rm DOM}{\minus}{\rm CFA}{\minus}{\rm BRE}} \right){\rm {\times}0}{\rm .150} $$
Analysis of data
In vivo digestion coefficients were analyzed by a two-factor ANOVA using Statistica 11.0 (Stat Soft Inc., Tulsa, OK, USA). The model used was
 $$Y_{{ij}} \,{\equals}\,\mu {\plus}{\rm CDS}_{i} {\plus}{\rm Sheep}_{j} {\plus}e_{{ij}} $$
where Y
ij
is an observation of the dependent variable ij, μ the population mean of the variable, CDS
i
the fixed effect of the batch, sheep
j
the fixed effect to correct for differences between animals and e
ij
the random error associated with observation Y
ij
. Mean values were compared using the Fisher LSD test and differences were declared significant at P<0.05.
Results
Chemical composition, amino acids and minerals
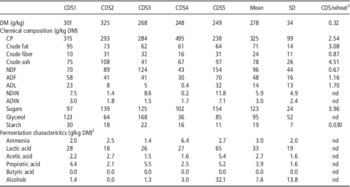
The chemical composition of the five CDS batches with mean and SD is presented in Table 1. As a reference, the ratio of the mean value for CDS to the tabular value of wheat (CVB, 2011) is also given. The DM content varied between 248 and 325 g/kg. On average, about one-third of the DM from CDS was CP, but the content varied largely from 238 g/kg DM to the extreme high value of 495 g/kg DM for CDS4. CDS was also rich in CFA, sugars, glycerol and crude ash, with a mean content of 71, 123, 95 and 78 g/kg DM, respectively. On the other hand, CDS contained on average <10% NDF, but the content varied largely from 43 to 154 g/kg DM. The ADF content was relatively constant, whereas ADL and ADIN showed a large variation. Compared with wheat, CDS contains very little starch. Moreover, cell walls in CDS were one-third lower compared with wheat and the difference seemed more pronounced for hemicellulose than for cellulose. The content of the other nutrients in CDS was strongly increased by a factor 4.5 for crude ash, a factor 4.0 for sugars, a factor 3.1 for CFA and a factor 2.5 for CP.
Chemical composition of the five batches condensed distillers solubles (CDS)Footnote 1

DM=Dry matter; NDIN=neutral detergent insoluble nitrogen; ADIN=acid detergent insoluble nitrogen; nd=not determined.
1 CDS1 and CDS4 come from the fermentation of whole wheat grains; the other three CDS from fermented wheat starch.
2 Fermentation characteristics were determined in a water extract of CDS.
3 Ratio of mean value for CDS and tabular value for wheat (CVB, 2011).
Concerning the silage quality parameters (Table 1), CDS contained on average 33 g lactic acid/kg DM, but hardly volatile fatty acids nor ammonia. The studied CDS contained almost no alcohols with exception of CDS5. The pH of the five CDS batches amounted to 4.7, 3.7, 4.1, 3.5 and 3.9, respectively.
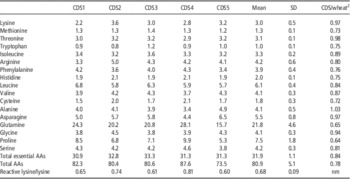
The amino acid content is presented relative to CP content in Table 2; as a reference, the ratio of the mean value for CDS to the tabular value of wheat (CVB, 2011) is given in the last column. The CP of CDS consisted on average of 80.9% amino acids, but this portion varied largely between 73.5% and 87.6%. The non-essential amino acids made up more than two-thirds of total amino acids with glutamine the most abundant amino acid followed by proline. The mean total amino acid content of CDS amounted to only 78% of that of wheat, with appreciably lower values (<70%) for glutamine and proline and higher values (>90%) for lysine, threonine, alanine, asparagine and glycine. The ratio of reactive lysine/lysine was on average 0.68, varying from 0.60 for CDS5 to 0.81 for CDS4.
Amino acid (AA) content (g/16 gN) of the five batches condensed distillers solubles (CDS)Footnote 1 and in comparison with wheat

nm=not mentioned.
1 CDS1 and CDS4 come from the fermentation of whole wheat grains; the other three CDS from fermented wheat starch.
2 Ratio of mean value for CDS and tabular value for wheat (CVB, 2011).
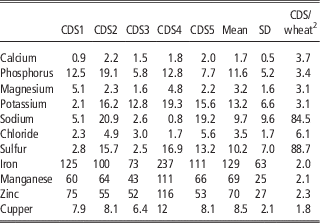
The total mineral content of CDS showed a large range from 30 to 82 g/kg DM. CDS contained on average 9.7 to 13.2 g of potassium, phosphorus, sulfur and sodium, about 3 g of chloride and magnesium and only 1.7 g of calcium/kg DM (Table 3). CDS4 contained considerably more trace elements than the other CDS batches. Compared with wheat, there is a three- to fourfold increase of the main minerals in CDS and a doubling of the concentrations of trace elements. Remarkable is the high content of sodium in CDS2 and CDS5 and of sulfur in CDS2, CDS4 and CDS5.
Minerals (g/kg DM) and trace elements (mg/kg DM) in the five batches condensed distillers solubles (CDS)Footnote 1 and in comparison with wheat

1 CDS1 and CDS4 come from the fermentation of whole wheat grains; the other three CDS from fermented wheat starch.
2 Ratio of mean value for CDS and tabular value for wheat (CVB, 2011).
Apparent in vivo digestion coefficients and energy value
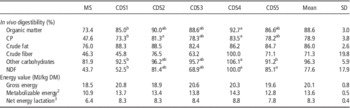
The MS, used as complementary feed to CDS in the digestion trials, had a DM content of 389 g/kg and contained 962 g OM, 80 g CP, 30 g CFA, 147 g CF, 704 g OC, 307 g NDF and 420 g starch/kg DM. The OM digestibility of the MS determined with six sheep averaged 73.4±1.5%, which can be considered as a low variation among animals. The digestibility of the nutrients in MS (Table 4) also showed little variation, with a SD amounting to 3.6% for CP, 2.2% for CFA, 4.3% for CF, 1.1% for OC and 3.9% for NDF. The OM digestibility of CDS was high with a mean value of 88.6%, varying from 85.0% to 92.7%. Among the nutrients, the OC showed the highest digestibility, on average 96.3% and CF the lowest, on average 71.3%. The digestibility of CFA averaged 86.0% and was quite constant among the five batches. CF and NDF showed a large variation in digestibility from about 50% to 100% for both. There were significant differences (P<0.05) between batches for the digestibility of OM, CP, OC and NDF. In all cases, CDS4 was better digestible than CDS1, with the other CDS batches in between.
In vivo digestion coefficients and energy value of maize silage (MS) and the five batches condensed wheat distillers solubles (CDS)Footnote 1

a,bDigestion coefficients are significantly different (P<0.05).
1 CDS1 and CDS4 come from the fermentation of whole wheat grains; the other three CDS from fermented wheat starch.
2 Metabolizable energy (ME) (MJ/kg)=(15.90×DCP+37.66×DCFA+13.81×DCF+14.64×DOC)/1000, with DCP, DCFA, DCF and DOC the digestible nutrients in g/kg (Van Es, Reference Van Es1978).
3 Net energy lactation (NEL) (MJ/kg)=0.6×[1+0.004×(q−57)]×ME×0.9752, with q=ME/GE×100 (Van Es, Reference Van Es1978).
The GE of CDS determined by bomb calorimeter amounted to 20.1 MJ/kg DM on average, ranging from 18.9 MJ/kg DM for CDS2 to 20.8 MJ/kg DM for CDS1. The ME calculated from the digestion coefficients was on average 13.6 MJ/kg DM, varying from 12.8 to 14.3 MJ/kg DM. The NEL amounted on average to 8.3 MJ/kg DM (range: 7.8 to 8.8 MJ/kg DM). Both ME and NEL were highest for CDS4 and lowest for CDS5.
Data set of 28 protein feeds and validation of the two approaches to derive the protein value
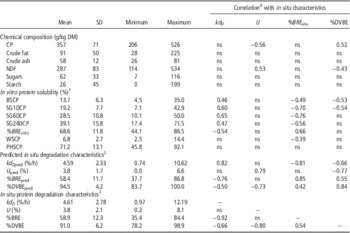
The chemical composition, the in vitro protein solubility and the predicted as well as determined in situ protein degradation characteristics of the 28 protein feeds are given in Table 5. Moreover, the correlations between chemical, in vitro solubility and predicted degradation characteristics at one side and the in situ characteristics at the other are presented. The data set showed a large variation in chemical composition encompassing the range of CDS for CP, CFA and starch, whereas some CDS batches showed a higher ash and sugar content and a lower NDF content than the extremes of the data set. Concerning the in vitro solubility tests, WSCP showed lowest values and PHSCP highest, with intermediate values for borate–phosphate buffer without and with protease added. The SG6DCP was best correlated with kd D (0.65) as well as with %BRE situ (−0.76). The %BRE vitro was on average 10%-points higher than %BRE situ (68.6 v. 58.9%) and the correlation between both parameters amounted to 0.66. From the studied in vitro tests, only BSCP and SG1DCP showed a significant (P<0.05), although weak correlation.
Chemical composition, in vitro solubility, predicted and determined in situ protein degradation characteristics of the 28 protein feeds and correlations with in situ parameters

ns=not significant.
1 BSCP=CP-solubility in borate–phosphate buffer; SG1DCP, SG6DCP, SG24DCP=CP-degradability in Streptomyces griseus after 1, 6 and 24 h of incubation, respectively; WSCP=CP-solubility in water; PHSCP=CP-solubility in pepsin-HCl; %BRE vitro =undegraded CP fraction calculated as (100−SG24DCP)+(SG24DCP−BSCP)×[6/(6+kd Dvitro )]+BSCP×[11/(11+200)], based on the model of the DVE/OEB-system (Van Duinkerken et al., Reference Van Duinkerken, Blok, Bannink, Cone, Dijkstra, Van Vuuren and Tamminga2011).
2 kd Dpred (%/h)=2.40−0.0266 CP (g/kg DM)+0.112 SG6DCP (%)+0.119 PHSCP (%); U pred (%)=−0.98−0.0135 CP (g/kg DM)+0.0134 NDF (g/kg DM)+0.0978 ash (g/kg DM); %DVBE pred=106.64+0.0408 CP (g/kg DM)−0.0359 NDF (g/kg DM)−0.2479 ash (g/kg DM)−0.1900 SG6DCP; %BRE pred=U pred+(100−U pred−WSCP)×[6/(6+kd Dpred)]+WSCP×[11/(11+200)], based on the model of the DVE/OEB-system (Van Duinkerken et al., Reference Van Duinkerken, Blok, Bannink, Cone, Dijkstra, Van Vuuren and Tamminga2011).
3 kd D =rumen degradation rate of the potentially degradable fraction; U=rumen undegradable fraction; %BRE=undegraded CP fraction calculated as U+(100−U−WSCP)×[6/(6+kd D )]+WSCP×[11/(11+200)] based on the model of the DVE/OEB-system (Van Duinkerken et al., Reference Van Duinkerken, Blok, Bannink, Cone, Dijkstra, Van Vuuren and Tamminga2011); %DVBE=intestinal digestibility of undegraded protein.
4 The correlation coefficient is only shown when significant (P<0.05).
The predicted kd D , U and %DVBE showed a high correlation with the respective in situ values, which is logic as prediction equations were derived from the same data set. The mean %BRE pred (58.4%) based on the predicted kd D and U was similar to %BRE situ and both parameters showed a correlation of 0.85.
In vitro solubility, predicted in situ degradation characteristics and protein value
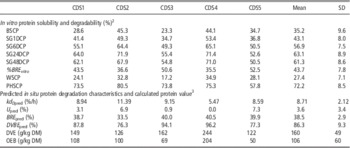
The in vitro protein solubility and degradability of CDS is given in Table 6. The ranking among CDS batches was more or less the same for WSCP, BSCP, SG1DCP and SG6DCP with the lowest solubility for CDS3 and the highest for CDS2 and CDS4. For SG24DCP and PHSCP the ranking changed somewhat with the lowest value for CDS5 and the highest for CDS2. Protein degradability with protease increased up to 24 h of incubation, but remarkably decreased somewhat after 48 h. The %BRE vitro amounted on average to 43.7%, varying from 35.5% to 52.5%.
In vitro protein solubility, estimated in situ protein degradation characteristics and calculated protein value of the five batches condensed distillers solubles (CDS)Footnote 1

1 CDS1 and CDS4 come from the fermentation of whole wheat grains; the other three CDS from fermented wheat starch.
2 BSCP=CP-solubility in borate–phosphate buffer; SG1DCP, SG6DCP, SG24DCP and SG48DCP=CP-degradability in Streptomyces griseus after 1, 6, 24 and 48 h of incubation, respectively; WSCP=CP-solubility in water; PHSCP=CP-solubility in pepsin-HCl; %BRE vitro =(100−SG24DCP)+(SG24DCP−BSCP)×[8/(8+kd Dvitro )]+BSCP×[11/(11+200)], based on the model used in the DVE/OEB-system (Van Duinkerken et al., Reference Van Duinkerken, Blok, Bannink, Cone, Dijkstra, Van Vuuren and Tamminga2011).
3 kd Dpred=predicted rumen degradation rate of the potentially degradable fraction; U pred=predicted rumen undegradable fraction; %BRE=undegraded fraction calculated as U pred+(100−U pred−WSCP)×[8/(8+kd Dpred)]+WSCP×[11/(11+200)] based on the model of the DVE/OEB-system (Van Duinkerken et al., Reference Van Duinkerken, Blok, Bannink, Cone, Dijkstra, Van Vuuren and Tamminga2011); %DVBEpred =predicted intestinal digestibility of undegraded protein; DVE=the true protein digested in the small intestine; OEB=the rumen degradable protein balance.
In Table 6 also the predicted kd D , U and %DVBE as well as the resulting DVE and OEB are presented for the five CDS batches.
The mean kd Dpred of CDS was 8.71%/h and varied from 5.47%/h to 11.39%/h. The U varied from 0.0% to 7.3%. The %BRE pred averaged 38.5±2.9%; as compared with %BRE vitro, 5.2%-points lower and less variable. The %DVBE pred was with 86.3% relatively low and varied strongly between 76.3% and 96.2%. The DVE averaged 160 g/kg DM, varying from 122 to 244 g/kg DM. The OEB of CDS amounted to 106 g/kg DM on average, with a range from 50 to 204 g/kg DM.
Discussion
Chemical composition
The distinction between CDS1 and CDS4 resulting from the fermentation of whole wheat grains and CDS2, CDS3 and CDS5 from wheat starch was numerically reflected in some chemical parameters. So, The CP content of CDS1 and particularly of CDS4 was higher than that of the other CDS batches. The lower CP content in CDS, originating from the wet-milling process may be explained by the (partial) extraction of protein from the grain before fermentation. On the other hand, the contents of CF, NDF and sugars were lower for the two CDS based on whole grains than for the three CDS based on starch, on average 18, 65 and 40 g/kg DM, respectively. However, the number of studied batches was too low to consider these differences as characteristic for the production process. Further, it is surprising that CDS still contains a lot of sugar, on average 123 g/kg DM, indicating that fermentation by yeast is not complete. Moreover, CDS contains on average 95 g glycerol/kg DM, which is formed as a by-product during conversion of sugars to ethanol and carbon dioxide by yeast (Anonymous, 2012). Literature data on chemical composition of CDS are very scarce. Mustafa et al. (Reference Mustafa, McKinnon and Christensen1999) reported for five batches wheat thin stillage (on average 84 g DM/kg) the following nutrient content per kilogram DM: 457 g CP, 340 g NDF, 136 g CFA, 83 g ash, 40 g ADF and 22 g starch. The stillage originated from the fermentation of whole wheat grains and the high CP content was similar to that of CDS4 in our study. On the other hand, NDF content of the stillage was much higher compared with our results, which they explained by the bounding of cell walls to N, amounting to >60% of total N. The clearly higher NDF and NDIN contents as compared with our study can be explained by the fact that Mustafa et al. (Reference Mustafa, McKinnon and Christensen1999) did not add sodium sulfite in the NDF-analysis, which is used to get rid of protein contamination.
As the residual sugars in CDS may ferment during preservation, we decided to determine some silage quality parameters. We found a relative low pH, varying from 3.5 to 4.7 for the five CDS batches, despite a low content of lactic acid and almost no volatile fatty acids. Afterwards, we learned from the suppliers of these by-products that organic acids like formic acid were added to reduce secondary fermentation and to increase storage time.
As concerns the protein quality, Mustafa et al. (Reference Mustafa, McKinnon and Christensen2000a) mentioned that >60% of thin stillage protein is bound to NDF, whereas most of soluble protein is NPN. According to the same authors, the amino acid composition of a given thin stillage is close to that of the original cereal grain with glutamic acid the most abundant amino acid followed by proline in the case of wheat thin stillage, which corresponded with our results. Compared with wheat DDGS (De Boever et al., Reference De Boever, Blok, Millet, Vanacker and De Campeneere2014), we found that CDS contains about 30% more lysine and almost 50% more reactive lysine. This indicates that the drying process denatures a lot of protein due to bounding of heat-labile amino acids like lysine in Maillard products as reported by Cromwell et al. (Reference Cromwell, Herkelman and Stahly1993).
Compared with the original grain the amount of minerals and trace elements in CDS is enriched by a factor 2 to 4. This can be explained by the almost complete fermentation of starch and the centrifugation of the remaining mash resulting in more smaller and heavier particles in the liquid. Considering the requirements of dairy cattle, wheat CDS is a good source of minerals with exception of calcium. The high concentrations of sodium and sulfur in some CDS batches can be explained by the addition of sodium hydroxide and sulfuric acid during the fermentation process to control pH.
Digestibility and energy value
To our knowledge, in vivo nutrient digestibility or energy value of wheat CDS has not been reported before. In our study, the digestibility of the five CDS batches was determined in experiments with sheep fed the CDS mixed with MS. The digestibility coefficients of CDS were calculated by difference from those of the mixture assuming additivity of the two ration components. CDS showed a high digestibility of the OM (mean: 88.6%), mainly due to the very high digestibility of the other or non-structural carbohydrates and also of CFA. The digestibility of CDS is variable and most nutrients in CDS4 were significantly better digested than those in CDS1. For CDS4, a digestion coefficient >100% was obtained for the OC, which indicates a positive effect on the digestibility of the mixture with MS. This synergistic effect on digestibility could be explained by the high CP content of CDS4, although the digestibility of MS alone was determined with extra provision of urea. Another explanation might be the presence of live yeast, which may stimulate digestion (Larson et al., Reference Larson, Stock, Klopfenstein, Sindt and Huffman1993; Bitencourt et al., Reference Bitencourt, Silva, Oliveira, Dias, Lopes, Siecola, Zacaroni and Pereira2011).
Based on the in vivo digestion coefficients we calculated a NEL content of on average 8.3 MJ/kg DM for CDS. In correspondence with OM digestibility, CDS4 had the highest NEL, but in contrast with digestibility, CDS1 was not lowest in NEL, because of its high CFA content. The NEL content of CDS is similar to that of the original product wheat (8.2 MJ/kg DM) according to CVB (2011), but higher than that of wheat DDGS (7.4 MJ/kg DM) (De Boever et al., Reference De Boever, Blok, Millet, Vanacker and De Campeneere2014). The lower energy value of DDGS can be explained by the combination of CDS with wet distillers grains, the latter containing more cell walls and being less digestible. Schingoethe et al. (Reference Schingoethe, Kalscheur, Hippen and Garcia2009) mentioned for corn CDS a NEL of 8.5 MJ/kg DM, but this product contained clearly less CP (18.5%) and more CFA (21.5%) as compared with our CDS.
Protein value
Because of the fine particle size of CDS, it was not possible to carry out reliable nylon bag incubations in the rumen, which is considered as the reference protein evaluation method. In order to cope with the large washout fraction for feeds with a high portion of small particles, for which no rumen degradation characteristics could be determined, De Jonge et al. (Reference De Jonge, van Laar, Hendriks and Dijkstra2015) recently proposed a milder rinsing procedure for nylon bags after incubation. In this way, they could reduce the protein washout fraction for three wheat CDS from 91.6% to 21.7%. Further, they derived a protein kd D varying between 9.4%/h and 18.8%/h, an U between 14.9% and 19.6% and a %BRE between 33.1% and 45.1%. In our study, two other approaches for deriving the protein value of CDS, were investigated. In the first approach, kd D , U and %BRE were derived from in vitro protein degradation of freeze-dried CDS samples in a solution of borate–phosphate buffer and protease during different incubation times up to 48 h. The lower degradability after 48 h as compared with 24 h incubation was also found for some feeds by Cone et al. (Reference Cone, Van Gelder and Van Vuuren1995), comparing 70 with 24 h of incubation. They explained this phenomenon by microbial contamination and by binding of the enzyme to the substrate, so that it not gets into the supernatant. We think that the lower degradation after longer incubation is simply due to volatilization of ammonia out of the in vitro tubes. A similar in vitro protease approach was used by some researchers for screening and comparing the protein value of liquid/pasty feeds. Mustafa et al. (Reference Mustafa, McKinnon and Christensen2000) derived for wheat thin stillage a %BRE vitro of 39.2% based on a BSCP of 28.8% and a kd D of 14.2%/h. Iwanchysko et al. (Reference Iwanchysko, McKinnon, Mustafa, Christensen and McCartney1999) mentioned a %BRE vitro of 44.6% for wheat-based thin stillage based on a BSCP of 20.4% and a kd D of 14.7%/h; they classified the stillage as a relatively degradable protein source for ruminants comparable with untreated rapeseed meal. Compared with these two studies, we obtained for the five CDS batches a higher mean value for BSCP (35.2%) as well as for kd D (27.9%/h), but a similar %BRE vitro (43.7%). From the validation of the in vitro approach with the 28 protein feeds appeared that %BRE vitro overestimated %BRE situ with on average 10%-points and was only weakly related. The weak relationship between in vitro enzymatic and in situ protein degradability was also shown for compound feeds in a previous study (De Boever et al., Reference De Boever, Cottyn, Vanacker and Boucque1997). The second approach by predicting kd D and U of CDS with regression equations based on the data set of 28 protein feeds with known in situ values gave lower and less variable values for %BRE than for %BRE vitro . Application of the second approach on the 28 protein feeds resulted in a %BRE pred, which was on average similar and highly correlated to %BRE situ . Therefore, the second approach was considered more reliable to derive %BRE of CDS than the in vitro approach with protease from S. griseus (mostly used in research). Further, the range in predicted %BRE of CDS (33.5% to 40.5%) in our study corresponded fairly good with the range of 33.1% to 45.1% for three wheat CDS mentioned by De Jonge et al. (Reference De Jonge, van Laar, Hendriks and Dijkstra2015). The mean %BRE and %DVBE of CDS are comparable with the tabular values (CVB, 2011) for rapeseed meal of 36% and 80%, respectively. The predicted %BRE and %DVBE of the five CDS batches showed quite a large variation resulting in a range in DVE from 122 to 244 g/kg DM for CDS5 and CDS4, respectively. The low DVE of CDS5 was mainly due to the low %DVBE, which was also reflected by the high NDIN and ADIN content as well as by the low ratio of total amino acids to CP, indicative of protein denaturation. The high DVE of CDS4 is not only due to the very high CP content, but also to the high %BRE combined with a high %DVBE.
Conclusions
It is clear from the above results that the composition and nutritive value of CDS, originating from the same grain type, may vary largely from one process to another, so that plant-specific nutritive values should be used for ration formulation. There was no clear distinction between CDS originating from the fermentation of whole wheat grains and CDS from wheat starch. For a more accurate estimation of the nutritive value of a CDS batch, it is recommended to analyze DM, CP, crude ash, NDF and sugars, and particularly for the protein quality to determine in vitro solubility in protease and/or pepsin-HCl. The indirect approach of predicting in situ protein degradation characteristics of CDS based on in vitro solubility and chemical analyses has to be validated with more CDS batches and other pasty feeds. The variation in nutritive quality with time and origin of the grain within a plant is another question which needs further study.
Acknowledgments
The authors want to thank the Agency for Innovation by Science and Technology (IWT, Flanders, Belgium) for the financial support of this project.